

Some key parts of the algorithm for interpretation of TLS matrices in terms of elemental atomic motions and corresponding ensembles of atomic models described in the article by Urzhumtsev et al. [(2015) Acta Cryst. D71, 1668–1683] are clarified and developed, and a reference on a wrong model is corrected.
Keywords: TLS model, TLS matrices, ensemble of atomic models, atomic displacement matrices, model validation, addenda and corrigendum
Abstract
Researcher feedback has indicated that in Urzhumtsev et al. [(2015) Acta Cryst. D71, 1668–1683] clarification of key parts of the algorithm for interpretation of TLS matrices in terms of elemental atomic motions and corresponding ensembles of atomic models is required. Also, it has been brought to the attention of the authors that the incorrect PDB code was reported for one of test models. These issues are addressed in this article.
1. Incorrect PDB code
In the original article (Urzhumtsev et al., 2015 ▸), we used several atomic models in order to test the algorithms and provide examples. Unfortunately, the incorrect PDB code had been reported for one of them. Everywhere in the text (§6.2, Tables 2 and 3), 1rge should be used instead of 1dqv and ribonuclease S should be used instead of synaptotagmin. We apologize for this confusion. The diffraction data set used for test refinement of ribonuclease S was obtained from the CCP4 (Winn et al., 2011 ▸) distribution (http://www.ccp4.ac.uk/examples/rnase/rnase25.mtz).
2. Origin choice
The problem of the origin choice is discussed in detail in the review of Urzhumtsev et al. (2013 ▸) leading us to provide less detail in Urzhumtsev et al. (2015 ▸). As mentioned in §2.2 of Urzhumtsev et al. (2015 ▸), the T and S matrices depend on the point (origin of the TLS group) with respect to which the three libration axes are defined. This is also important for generating the  matrices from a set of TLS matrices. Confusion arises from the fact that the TLS origin may be, and in fact usually is, different from the origin of the coordinate system in which the atomic coordinates are provided.
The choice of the TLS origin is arbitrary; some typical choices are described in §2.2. Let  , n = 1,…N be atomic Cartesian coordinates as the input parameters of the procedure; for example, they may be the coordinates given in the PDB file. Let
  be respective coordinates of the origin of the TLS group. The origin of basis [M] defined in Urzhumtsev et al. (2015 ▸) is assumed to coincide with this point. This means that the coordinates that are input to the ensemble generating procedure (
 in §7.2 of Urzhumtsev et al., 2015 ▸) are also expected to be shifted to the origin of the TLS group as follows
The matrix
 |
[equation (3) in Urzhumtsev et al., 2015 ▸] uses these new coordinates (1).
3. U n matrices
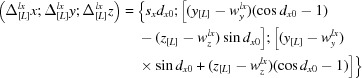
The TLS model is valid for harmonic motions and, as a consequence, for small libration amplitudes only. It allows for calculation of the individual atomic displacement parameters  in two different ways. They may be calculated analytically using the formulae (2) and (3) from Urzhumtsev et al. (2015 ▸). Alternatively, the same matrices can be calculated numerically from the coordinates of the set of models generated explicitly using the procedure described in §7 and Appendix A of Urzhumtsev et al. (2015 ▸). We stress that in formulae (59)–(61) the expressions
 |
 |
 |
are the coordinates of the libration shifts in the basis [L]; similarly, the values  in (48) are the coordinates of the vibration shifts in the basis [V]. These coordinates must be converted into the basis [M] in order to obtain the coordinates of the total shifts
  , n = 1,…N, to be applied to the atomic coordinates
  , n = 1, … N. Here k is the number of the generated model.
Once an ensemble is generated, the atomic displacement matrix for each atom n
 |
can be calculated directly from the coordinates  , k = 1,…K of the multiple copies of the same atom in the ensemble [see formula (2.2) from Urzhumtsev et al., 2013 ▸]. Here atomic coordinates are in the basis [M] and averaging is performed over all K instances of the atom in the ensemble.
These two somewhat independent routes to obtain the matrices allow a convenient way of validating the described procedures. Indeed, given parameters of elemental motions one can construct TLS matrices and then calculate from these TLS matrices using the analytical expression cited above. Also, one can use TLS matrices to generate an ensemble of models and then derive from the ensemble using formula (4). We added this comparison to cctbx (Grosse-Kunstleve et al., 2002 ▸) as a test-exercise of the implementation.
Now the Phenix (Adams et al., 2010 ▸) command phenix.tls_as_xyz model.pdb n_models = N creates three PDB files containing the following.
(i) An ensemble of N models (N can be any positive integer) that are consistent with the TLS model (TLS records must be present in the model.pdb file header).
(ii) A single model with anisotropic
(UTLS in ANISOU records) calculated from the TLS matrices analytically.(iii) A single model with anisotropic
(U
ensemble, ANISOU records) calculated numerically from the ensemble of models.
obtained using the two different approaches are expected to be similar with possible differences arising from several sources, such as the following.
(a) Non-linearity of the TLS approximation (large libration amplitudes; Table 1 ▸).
(b) A finite number of models in the ensemble; empirically we found that 5000–10 000 is sufficient most of the time (Fig. 1 ▸).
(c) Numerical errors arising from a long chain of transformations: from decomposing TLS matrices into basic parameters of elemental motions and using these parameters to generate a large set of models that are then used to compute the anisotropic
matrices.
Table 1. Matrix U calculated analytically for two atoms (see the text for details) from the TLS matrices (U TLS) and numerically from an ensemble of 20 000 models (U ensemble) for different libration amplitude dz .
Matrix elements U zz, U xz, U yz are always equal to 0 and not shown. The last column shows the ratio of the maximal difference between respective U TLS and U ensemble elements compared to the maximal U TLS element. Two lines for dz = 0.10 stand for two independent runs of the random model generation.
| dz (rad/°) | U TLS (U xx, U yy, U xy) | U ensemble (U xx, U yy, U xy) | Δmax/U max |
|---|---|---|---|
| 0.05/2.9 | 0.00250, 0.00063, −0.00125 | 0.00250, 0.00063, −0.00125 | 0 |
| 0.07/4.0 | 0.00490, 0.00123, −0.00245 | 0.00487, 0.00122, −0.00242 | 0.006 |
| 0.09/5.2 | 0.00810, 0.00202, −0.00405 | 0.00791, 0.00201, −0.00394 | 0.023 |
| 0.10/5.7 | 0.01000, 0.00250, −0.00500 | 0.00993, 0.00254, −0.00496 | 0.007 |
| 0.10/5.7 | 0.01000, 0.00250, −0.00500 | 0.00993, 0.00253, −0.00494 | 0.007 |
| 0.15/8.6 | 0.02250, 0.00562, −0.01125 | 0.02207, 0.00567, −0.01079 | 0.020 |
| 0.20/11.5 | 0.04000, 0.01000, −0.02000 | 0.03802, 0.01025, −0.01861 | 0.049 |
| 0.25/14.3 | 0.06250, 0.01562, −0.03125 | 0.05970, 0.01664, −0.02858 | 0.045 |
| 0.30/17.2 | 0.09000, 0.02250, −0.04500 | 0.08204, 0.02415, −0.03909 | 0.088 |
| 0.50/28.6 | 0.25000, 0.06250, −0.12500 | 0.20432, 0.07408, −0.08651 | 0.183 |
| 0.70/40.1 | 0.49000, 0.12250, −0.24500 | 0.32987, 0.15339, −0.11880 | 0.327 |
| 0.90/51.6 | 0.81000, 0.20250, −0.40500 | 0.44468, 0.25448, −0.12348 | 0.451 |
Figure 1.

Comparison of the matrices U
TLS calculated for an atomic model analytically (see the text for details) and the matrices calculated from the ensemble models (U
ensemble) as a function of the number of models generated. The mean relative difference between the elements of the two sets of matrices is defined as 
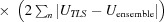 where the sums are calculated over all atoms and over all six elements of each pair of U matrices.
Since TLS modeling is based on a linearity approximation (Urzhumtsev et al., 2013 ▸) one may expect a significant difference between the matrices calculated analytically using TLS matrices and those calculated directly by (4) if the libration amplitudes are large. As mentioned in §6.1 of Urzhumtsev et al. (2015 ▸), large values for the vibration and libration amplitudes are not physically meaningful.
Table 1 ▸ shows matrices  for an artificial example of two atoms with the coordinates (0, 0, 0) and (1, 2, 3) when the only motion applied was libration around the axis parallel to Oz that passes through the center of mass of this system taken as the TLS origin. In the basis [M] the coordinates of these atoms are equal to (−0.5, −1.0, −1.5) and (0.5, 1.0, 1.5), respectively. The matrices were obtained using the two methods discussed above applying different amplitudes dz (for definitions see Urzhumtsev et al., 2015 ▸). As discussed previously (§2.3 in Urzhumtsev et al., 2013 ▸, and references therein), the discrepancy between two corresponding matrices is significant when the libration amplitude becomes larger than approximately 0.10–0.15 rad (6–9°).
To investigate the number of models sufficient to reproduce U
TLS by U
ensemble, we took the CA atoms from fragment A6–A61 of protein G IgG-binding domain III model (PDB code 2igd) and fitted TLS matrices to individual anisotropic of this model using the phenix.tls tool. Then we calculated U
TLS for each atom of the model and independently generated a set of random models from which we calculated U
ensemble to compare them with U
TLS. Fig. 1 ▸ shows the mean relative difference between the sets of the U elements as a function of the number of generated models.
Acknowledgments
We thank Professor D. Case (Rutgers University) for bringing our attention to the incorrectly reported PDB code, and for questions and discussions that prompted the clarifications.
References
- Adams, P. D. et al. (2010). Acta Cryst. D66, 213–221.
- Grosse-Kunstleve, R. W., Sauter, N. K., Moriarty, N. W. & Adams, P. D. (2002). J. Appl. Cryst. 35, 126–136.
- Urzhumtsev, A., Afonine, P. V. & Adams, P. D. (2013). Crystallogr. Rev. 19, 230–270. [DOI] [PMC free article] [PubMed]
- Urzhumtsev, A., Afonine, P. V., Van Benschoten, A. H., Fraser, J. S. & Adams, P. D. (2015). Acta Cryst. D71, 1668–1683. [DOI] [PMC free article] [PubMed]
- Winn, M. D. et al. (2011). Acta Cryst. D67, 235–242.