

Abstract
Background and Aims:
Inflammatory bowel diseases (IBDs) are heterogeneous disorders with complex aetiology. Quantitative genetic studies suggest that only a small proportion of the disease variance observed in IBD is accounted for by genetic variation, indicating a potential role for differential epigenetic regulation in disease aetiology. The aim of this study was to assess genome-wide DNA methylation changes specifically associated with ulcerative colitis (UC), Crohn’s disease (CD) and IBD activity.
Methods:
DNA methylation was quantified in peripheral blood mononuclear cells (PBMCs) from 149 IBD cases (61 UC, 88 CD) and 39 controls using the Infinium HumanMethylation450 BeadChip. Technical and functional validation was performed using pyrosequencing and the real-time polymerase chain reaction. Cross-tissue replication of the top differentially methylated positions (DMPs) was tested in colonic mucosa tissue samples obtained from paediatric IBD cases and controls.
Results:
A total of 3196 probes were differentially methylated between CD cases and controls, while 1481 probes were differentially methylated between UC cases and controls. There was considerable (45%) overlap between UC and CD DMPs. The top-ranked IBD-associated PBMC differentially methylated region (promoter region of TRIM39-RPP2) was also significantly hypomethylated in colonic mucosa from paediatric UC patients. In addition, we confirmed TRAF6 hypermethylation using pyrosequencing and found reduced TRAF6 gene expression in PBMCs of IBD patients.
Conclusions:
Our data provide new insights into differential epigenetic regulation of genes and molecular pathways, which may contribute to the pathogenesis and activity of IBD.
Key Words: Epigenetics, inflammatory bowel disease, DNA methylation
1. Introduction
The inflammatory bowel diseases (IBDs) Crohn’s disease (CD) and ulcerative colitis (UC) are chronic inflammatory conditions of the gastrointestinal tract. Inflammatory bowel disease is a heterogeneous disorder resulting from a complex interplay between genetic variation, intestinal microbiota, the host immune system and environmental factors. Genome-wide association studies (GWAS) have identified over 160 IBD susceptibility gene loci.1 However, only a small proportion of disease variance (13.6% for CD and 7.5% for UC) observed in IBD is accounted for by IBD-associated genetic variants,1,2 indicating a role for non-genetic factors in disease aetiology. Moreover, epidemiological studies have identified associations between environmental factors3,4 and subsequent risk for one or both IBD sub-phenotypes.
The importance of epigenetic processes acting to developmentally regulate gene expression via modifications to DNA, histone proteins and chromatin in complex disease phenotypes is becoming increasingly apparent.5 Epigenetic modifications, such as DNA methylation, are hypothesized to have a role in the immune dysfunction phenotype associated with IBD as they are influenced by certain environmental factors (e.g. smoking6 and diet7) known to be associated with inflammatory diseases.3,4 DNA methylation refers to the addition of a methyl group to the carbon at position 5 of the cytosine ring, resulting in 5-methylcytosine, and is a key regulatory mechanism of gene transcription.8 Recent research has implicated gene-specific changes in DNA methylation in the pathogenesis of IBD.9,10,11,12 For example, two recent studies11,12 used the HumanMethylation27 BeadChip microarray to identify differential DNA methylation at immune-related loci (e.g. TNFSF4, TNFSF12 and IL‐21R), including previously recognized IBD susceptibility genes (e.g. ICAM3 and IL8RB). Moreover, two recent genome-wide DNA methylation studies that assessed changes in colonic mucosa in treatment-naive paediatric IBD13 and childhood-onset CD14 identified a number of disease-associated methylation changes at various genetic loci, including miR21 and the HLA region. However, the majority of studies examining DNA methylation changes associated with IBD have primarily focused on candidate immune-related genes9,10 and/or studied one IBD subtype.11,14 The aim of the current study was to assess genome-wide DNA methylation changes using the HumanMethylation450 BeadChip array in peripheral blood obtained from adult IBD patients and to examine DNA methylation changes associated with disease activity. The identification of molecular pathways with differential epigenetic regulation in the peripheral blood of IBD patients would provide novel insights into disease pathogenesis and identification of potential biomarkers that could facilitate patient management.15
2. Methods
2.1. Study population
Patients with IBD (n = 150, median age 35 years, 83 male) attending a university teaching hospital between July 2011 and November 2013 were enrolled in this study. Participants completed a questionnaire regarding their clinical history and donated a blood sample. Clinical data, including biologic use, height and weight were documented (Supplementary Table S1). The Harvey–Bradshaw index or partial Mayo score, radiology, laboratory investigations, endoscopy and histology were used as appropriate to form a physician’s global assessment of disease activity. For further details see Supplementary Table S1. Forty individuals without a history of inflammatory disorders were recruited via an article placed in a national newspaper, an advertisement email sent to staff at St Vincent’s University hospital and University College Dublin, and from hospital patients without infectious or inflammatory diseases. Exclusion criteria for controls included those aged under 18 or over 70, those with self-reported acute infection, virus or other illness affecting the inflammatory system, chronic physical diseases with known inflammatory or gastroenterological components (e.g. IBD, irritable bowel syndrome, multiple sclerosis, rheumatoid arthritis or other autoimmune disorder). Individuals reporting use of medications affecting the inflammatory system, such as biologic agents or steroids, those with cardiac diseases or on cardiac medications and pregnant females were also excluded. Controls and IBD patients did not differ significantly with respect to gender, smoking, age and body mass index (BMI) (p > 0.05 for all comparisons). However, CD patients were younger than controls (p = 0.003). All samples were corrected for age during the statistical analyses. Ethical approval was obtained from St Vincent’s University Hospital Research and Ethics Committee.
Peripheral blood mononuclear cells (PBMCs) were isolated by density gradient centrifugation. DNA was extracted using a DNAeasy kit following the manufacturer’s protocol (Qiagen, Valencia, CA).
2.2. DNA methylation profiling
Genomic DNA (500 ng) was treated with sodium bisulphite using the EZ-96 DNA Methylation Kit (Zymo Research, CA, USA) following the manufacturer’s protocol. DNA methylation was quantified using the Infinium HumanMethylation450 BeadChip (Illumina, Inc., San Diego, CA) as previously described.16 Samples were randomized on the array with respect to disease status to avoid batch effects. GenomeStudio software (Illumina, Inc.) was used to extract signal intensities for each probe and perform initial quality control. Further quality control checks, quantile normalization and separate background adjustment of methylated and unmethylated intensities of type I and II probes were undertaken using the dasen function in the R wateRmelon package (available from www.bioconductor.org).16 Samples with 1% of sites with a detection p value <0.01 or a bead count <3 in 1% of samples (n = 2) were removed from the analysis. Non-specific probes and probes with known single-nucleotide polymorphisms ±10 base pairs (bp) from the single base extension site were removed.17,18 Batch effects were controlled for using the ComBAT function19 in the ChAMP R package.20 The final analyses included 430821 probes, and 188 samples (149 IBD cases [88 CD and 61 UC], 39 controls) passed our stringent quality control filter. Probes on the X and Y chromosomes were used to confirm the sex of the sample.
2.3. Estimating differential cell counts
Cellular heterogeneity is known to be a major potential confounder in epigenomic studies.21 Hence, differential cell counts for each individual were estimated using the Advanced Analysis Blood option of the online methylation age calculator (http://labs.genetics.ucla.edu/horvath/dnamage/).22 Cell count estimates for CD4+ T cells and B cells were calculated using a previously published algorithm.23 The distribution of cell types for each sample was inferred based on DNA methylation signatures of the constituent cell types. In addition, naive CD8+ T cells and CD8+CD28–CD45RA– T cells were estimated using a method developed by Horvath.22 A total of 4 different cell types, including CD4+ T cells, naive CD8+ T cells and CD8+CD28–CD45RA– T cells and B cells, were estimated.
2.4. Data analyses of genome-wide DNA methylation
Statistical analyses were performed using R Statistical Package 3.1.1. The β value is a ratio between methylated probe intensity and total probe intensities (sum of methylated and unmethylated probe intensities) and ranges from 0 to 1. Although β values exhibit heteroscedasticity for highly methylated or unmethylated CpG sites compared with M values, they have a more intuitive biological interpretation and thus were used in this study.24 Linear regression was used to examine differences in DNA methylation scores (reported as change in β values [∆β]) between CD cases and controls, UC cases and controls and active IBD vs inactive disease at each CpG site, whilst controlling for potential confounders (age, gender, smoking, BMI and estimated cellular composition). Probes were ranked according to p value and Q–Q were plots examined (Supplementary Figure 1). The p values were adjusted for multiple testing using a stringent Bonferroni correction. Global DNA methylation levels (calculated by averaging across all probes on the 450K array after adjusting for age, gender, smoking, BMI and cellular heterogeneity) were compared between cases and controls using an independent t test. Region-level analysis was performed using Comb-p software25 to group ≥4 spatially correlated CpGs in an 80-bp sliding window. Comb-p performs a Stouffer–Liptak correction on probes by assessing its neighbours within 80 bases, as weighted by their observed correlation. Following this, putative regions were identified by seeding on single probes with a Bonferroni-adjusted p value less than 1e–4 with extension, providing it finds another probe with an adjusted p value less than 1e–4 within 80 bases, as previously described.22
2.5. Gene ontology term enrichment analysis
Gene ontology (GO) term enrichment analysis was performed on genes annotated (Illumina UCSC gene annotation) to Bonferroni-significant differentially methylated positions (DMPs) identified in each analysis (UC vs controls and CD vs controls) using the R package GOseqv1.18.26 GOseq was used to correct for the number of Illumina 450K probes in each gene during GO term enrichment analysis. The number of probes per gene was calculated in our final dataset to create a probability weighting function, which was then used in the GO term enrichment analysis. For this analysis a less stringent multiple testing correction was applied (Benjamini–Hochberg false discovery rate [FDR]27) to identify significantly enriched GO terms (adjusted p values <0.05).
2.6. Bisulphite pyrosequencing
Technical validation of the 450K DNA methylation results was performed by bisulphite-pyrosequencing an amplicon spanning the TRAF6 CpG site, cg01476222. Pyrosequencing was performed on 181 bisulphite-modified DNA samples from our original cohort by Epigendx (Hopkinton, MA). Seven samples had insufficient remaining bisulphite-modified DNA. Samples were amplified by the bisulphite–polymerase chain reaction (PCR) (HotStar Taq Polymerase, Qiagen) and sequenced using the Pyrosequencing PSQ96 HS System (Qiagen) with an assay developed by Epigendx. The percentage of methylation was calculated for each CpG site as methylated cytosine divided by the sum of methylated and unmethylated cytosines. Correlation between DNA methylation levels at cg01476222 CpG sites estimated by pyrosequencing and the Illumina 450K BeadChip array was calculated using Spearman’s rank correlation coefficient.
2.7. Tumour necrosis factor receptor-associated factor 6 gene expression
RNA was extracted from the PBMCs of IBD patients (n = 63) and controls (n = 20) using an E.Z.N.A.® RNA Isolation Kit (VWR, Radnor, PA) and converted to cDNA (OmniScript, Qiagen) following the manufacturer’s instructions. Expression of the tumour necrosis factor (TNF) receptor-associated factor 6 gene (TRAF6) was measured using a Taqman Gene Expression Assay, Hs00371512_g1, with 18s as an endogenous control (Hs99999901_s1) (Applied BioSystems, Foster City, CA) as directed by the manufacturer on a LightCycler 480 system (Roche Diagnostics, Indianapolis, IN). TRAF6 gene expression was expressed as ∆Ct relative to the levels of 18s. A non-parametric Mann–Whitney U test was used to examine mean ∆Ct values between groups.
2.8. Colonic mucosa DNA methylation data
Colonic mucosa tissue samples were obtained from treatment-naive paediatric IBD cases (15 CD and 9 UC) and controls (n = 22). Samples were recruited from the paediatric gastroenterology tissue bank of the Pediatric Inflammatory Bowel Disease Consortium Registry of the Baylor College of Medicine (BCM) and MassGeneral Hospital for Children, as described in detail elsewhere.13 Genomic DNA was isolated from colonic mucosal biopsies using a standard QIAamp DNA Mini Kit (Qiagen, Valencia, CA). Treatment-naive IBD cases were diagnosed based upon clinical, biochemical and histological characteristics. DNA methylation was quantified using the Infinium HumanMethylation450 BeadChip as described above. The R Bioconductor minfi package28 was used to generate β values normalized to internal control probes and corrected for probe type I or II. The minfi package dmpFinder function was used to identify DMPs between controls and CD- or UC-affected individuals. Further details can be found elsewhere.13
3. Results
3.1. Site-specific DNA methylation differences are associated with IBD
We assessed genome-wide patterns of DNA methylation in IBD subtypes CD and UC compared with controls. No difference in overall mean DNA methylation (calculated by averaging across all probes on the 450K array) was observed when either CD or UC was compared with controls (p = 0.34 and p = 0.49, respectively), indicating that neither CD nor UC is associated with global changes in DNA methylation. In contrast, DNA methylation at individual CpG sites demonstrated considerable variability in both IBD subtypes compared with controls. A total of 3196 probes were differentially methylated (Bonferroni-adjusted p value <0.05) between CD cases and controls (Figure 1A). Table 1 shows the 10 top-ranked DMPs and all Bonferroni-significant DMPs are listed in Supplementary Table S2. The top-ranked DMP, cg16176675, located in the 5ʹ-UTR of the protein-coding TRAF interacting gene (TIFAB), was hypermethylated in CD cases compared with controls (mean Δβ = 0.092, Bonferroni-adjusted p value [p adjusted] 5.86e-17). Gene ontology (GO) enrichment analysis identified 104 FDR-corrected significantly enriched terms for the DMPs identified in CD vs control analysis (Supplementary Table S3). The most enriched pathways included immune response (GO:0006955, q = 1.14e-05), regulation of T cell activation (GO:0050863, q = 0.0001) and cellular response to molecules of bacterial origin (GO:0071219, q = 0.0037).
Figure 1.

DNA methylation changes are widespread in inflammatory bowel disease (IBD) subtypes compared with controls. (A) Manhattan plots showing the distribution of p values from the comparison of Crohn’s disease (CD) with controls and the distribution of Bonferroni-significant CD-associated differentially methylated positions (DMPs) across genomic features. (B) Manhattan plots showing the distribution of p values from the comparison of ulcerative colitis (UC) with controls and the distribution of Bonferroni UC-associated DMPs across genomic features. The top-ranked DMP for both UC and CD is cg16176675 (TIFAB). The horizontal red line corresponds to significance after Bonferroni correction. Compared with the genome average, both CD- and UC-associated DMPs are under-represented in CpG islands but more frequently present in enhancer regions and gene bodies. (C) Correlations between CD-associated changes in DNA methylation (∆β) at 3196 Bonferroni-significant DMPs compared with UC-associated differences at the same probes.
Table 1.
Top 10 ranked differentially methylated positions in Crohn’s disease (n = 88) compared with controls (n = 39).
| Probe ID | Mean ∆β | p value | Adjusted p | Hg19 | Illumina annotation | Probe type | Gene annotation from GREAT (distance from TSS) |
|---|---|---|---|---|---|---|---|
| cg16176675 | 0.092 | 1.36e-22 | 5.86e-17 | Chr5: 134786942 | TIFAB | II | C5orf20 (–3905) |
| cg21442182 | 0.092 | 5.49e-22 | 2.36e-16 | Chr13: 31446420 | II | ALOX5AP (+158806), HSPH1 (+289696) | |
| cg10311161 | 0.102 | 4.04e-21 | 1.74e-15 | Chr8: 68110902 | ARFGEF1 | II | CSPP1 (+134300), ARFGEF1 (+145009) |
| cg17579089 | 0.090 | 7.32e–21 | 3.15e-15 | Chr3: 47269695 | KIF9 | I | SETD2 (–64229), KIF9 (+54641) |
| cg05025332 | 0.103 | 1.20e–20 | 5.17e–15 | Chr2: 65165160 | II | SERTAD2 (–284115), SLC1A4 (–51334) | |
| cg20061654 | 0.081 | 2.43e–20 | 1.05e–14 | Chr22: 45608492 | C22orf9 | II | UPK3A (–72375), NUP50 (+48767) |
| cg10154880 | 0.125 | 2.55e–20 | 1.10e–14 | Chr7: 98603502 | TRRAP | II | TRRAP (+127390), SMURF1 (+138240) |
| cg21935981 | 0.075 | 5.36e–20 | 2.31e–14 | Chr22: 45608465 | C22orf9 | II | UPK3A (–72402), NUP50 (+48740) |
| cg22013370 | 0.105 | 5.87e–20 | 2.53e–14 | Chr1: 241981543 | II | OPN3 (–177843), EXO1 (–29949) | |
| cg05921138 | 0.102 | 6.11e–20 | 2.63e–14 | Chr2: 121440849 | SORL1 | I | SORL1 (+117938), BLID (+546073) |
Adjusted p, Bonferroni-corrected p value; Hg19, Human Genome version 19; GREAT; Genomic Regions Enrichment of Annotations Tool; TSS, transcription start site.
When UC patients were compared with controls, 1481 probes were significantly (p adjusted < 0.05) differentially methylated (Figure 1B). Table 2 shows the 10 top-ranked DMPs while all Bonferroni significant DMPs are listed in Supplementary Table S4. The top-ranked DMP was again cg16176675 (TIFAB) and was hypermethylated in UC cases compared with controls (mean Δβ = 0.084, p adjusted = 2.19e -11). GO enrichment analysis identified 2 FDR-corrected significantly enriched terms for DMPs identified in UC vs control analysis (Supplementary Table S5). The most enriched GO categories were related to immune response (GO:0006955, q = 0.03) and small-molecule catabolic processes (GO:0044282, q = 0.04).
Table 2.
Top 10 ranked differentially methylated positions in ulcerative colitis (n = 61) compared with controls (n = 39).
| Probe ID | Mean ∆β | p value | Adjusted p | Hg19 | Illumina annotation | Probe type | Gene annotation from GREAT (distance from TSS) |
|---|---|---|---|---|---|---|---|
| cg16176675 | 0.084 | 5.07e–17 | 2.19e–11 | Chr5: 134786942 | TIFAB | II | C5orf20 (–3905) |
| cg02619001 | 0.075 | 3.46e–16 | 1.49e–10 | Chr17: 47592333 | NGFR | II | NXPH3 (–60964), NGFR (+19679) |
| cg07795766 | 0.051 | 1.84e–15 | 7.95e–10 | Chr22: 45608516 | C22orf9 | I | UPK3A (–72351), NUP50 (+48791) |
| cg21935981 | 0.068 | 2.38e–15 | 1.02e–09 | Chr22: 45608465 | C22orf9 | I | UPK3A (–72402), NUP50 (+48740) |
| cg20061654 | 0.074 | 2.67e–15 | 1.15e–09 | Chr22: 45608492 | C22orf9 | I | UPK3A (–72375), NUP50 (+48767) |
| cg23320499 | –0.077 | 5.76e–15 | 2.48e–09 | Chr12: 12659177 | DUSP16 | II | MANSC1 (–156009), DUSP16 (+56270) |
| cg04223044 | 0.072 | 6.67e–15 | 2.87e–09 | Chr22: 45608428 | C22orf9 | II | UPK3A (–72439), NUP50 (+48703) |
| cg19380303 | 0.082 | 7.60e–15 | 3.27e–09 | Chr15: 90172193 | KIF7 | I | KIF7 (+26488), C15orf42 (+53376) |
| cg04407417 | 0.041 | 7.81e–15 | 3.36e–09 | Chr12: 52228651 | II | FIGNL2 (–2951) | |
| cg10311161 | 0.086 | 1.05e–14 | 4.51e–09 | Chr8: 68110902 | ARFGEF1 | II | CSPP1 (+134300), ARFGEF1 (+145009) |
Adjusted p, Bonferroni-corrected p value; Hg19, Human Genome version 19; GREAT, Genomic Regions Enrichment of Annotations Tool; TSS, transcription start site.
3.2. DNA methylation profiling demonstrates the absence of major epigenetic differences between CD and UC
There was considerable overlap in UC- and CD-associated DMPs, with 1443 (97%) of the UC-associated DMPs also differentially methylated in CD. Thirty-eight UC DMPs (3%) were differentially methylated in UC only. In contrast, 1753 CD DMPs (55%) were unique CD-associated DMPs. The ∆β values of CD-associated DMPs were strongly correlated (r = 0.99, p < 0.0001) with UC-associated differences at the same probes compared with controls (Figure 1C).
3.3. IBD-associated differentially methylated regions
Region-level analysis was performed using Comb-p software to identify differentially methylated regions of the genome associated with UC and CD compared with controls. Our analysis identified 2 differentially methylated regions (DMRs) in the UC vs control analysis and 7 DMRs in the CD vs control analysis (Table 3). Of note, the 2 UC-associated DMRs were also associated with CD. For example, we identified an IBD-associated DMR (spanning 11 CpG sites) in the promoter region of the TRIM39-RPP21 protein-coding gene, which also overlaps the third exon of TRIM39 (Figure 2A). This IBD-associated DMR was hypomethylated across all CpG sites in IBD cases compared with controls (Figure 2B).
Table 3.
Comb-p differentially methylated region analysis.
| Region | CpG sites in region | p value | Adjusted p value |
|---|---|---|---|
| CD-associated DMRs | |||
| Chr1: 2230601–2230924 | 4 | 7.66e–12 | 2.09e–06 |
| Chr14: 24540174–24540453 | 4 | 3.44e–09 | 0.001087 |
| Chr11: 65546988–65547173 | 4 | 1.02e–08 | 0.004868 |
| Chr2: 128458240–128458402 | 5 | 5.18e–25 | 2.82e–19 |
| Chr6: 6588693–6589076 | 5 | 1.11e–16 | 2.56e–11 |
| Chr22: 45608345–45608714 | 10 | 3.60e–15 | 8.50e–10 |
| Chr6: 30297174–30297628 | 11 | 1.88e–18 | 3.65e–13 |
| UC-associated DMRs | |||
| Chr2: 128458240–128458402 | 5 | 9.30e–13 | 5.07e–07 |
| Chr6: 30297257–30297628 | 10 | 2.61e–11 | 6.21e–06 |
CD, Crohn’s disease; UC, ulcerative colitis.
p value, slk-corrected p value; Adjusted p value, one-step Šidák multiple-testing correction.
Differentially methylated regions associated with IBD are highlighted in bold.
Figure 2.
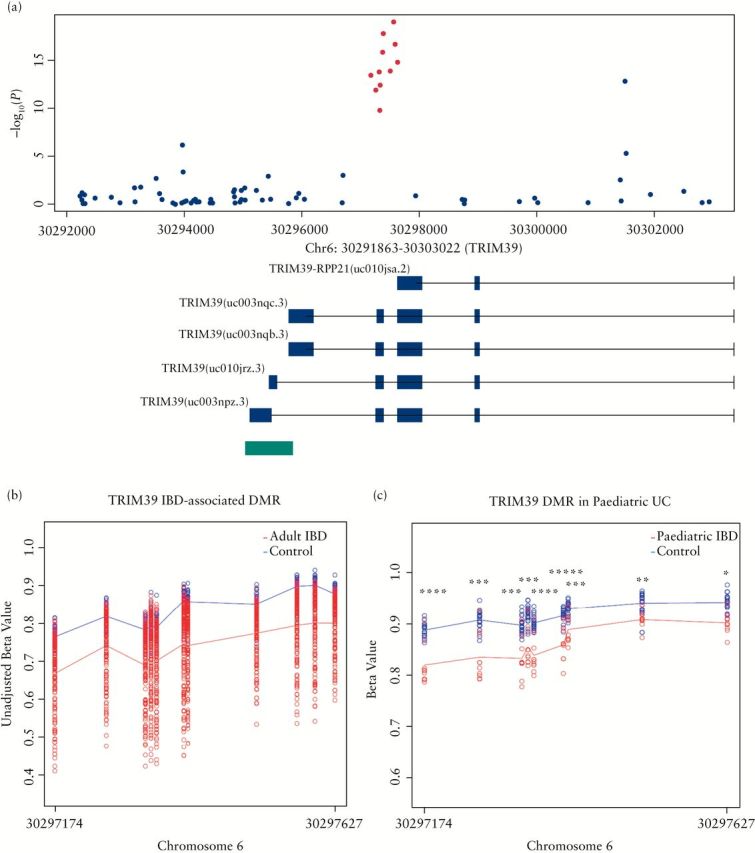
Inflammatory bowel disease (IBD)-associated differentially methylated region (DMR) TRIM39-RPP21. (A) A zoomed-in Manhattan plot illustrating the TRIM39 chromosomal regions. The 11 IBD-associated probes present in the DMR are highlighted in red. Green bars denote the location of an annotated nearby CpG island. Of note, the IBD-associated DMR overlaps a promoter region associated with the fusion gene TRIM39-RPP21. (B) DNA methylation levels (β values) are illustrated for each sample in the adult IBD blood cohort. All 11 CpG sites are hypomethylated in adult IBD cases compared with controls. (C) DNA methylation levels are illustrated for each sample in the paediatric UC and control cohort. All 9 CpG sites are significantly hypomethylated in paediatric UC cases compared with controls. Lines represent average CpG methylation across each sample in each group (disease, red; controls, blue). *****p < 1e–07; ****p < 1e–06; *** p < 1e–05; **p < 1e–04; *p < 1e–03.
3.4. DNA methylation differences, disease activity and biologic therapy
A number of CpG sites were nominally significantly (p < 0.05) differentially methylated in active IBD compared with inactive disease (Supplementary Figure S2). However, no DMP remained significant after Bonferroni correction for multiple testing. The 10 top-ranked DMPs are shown in Table 4. The top-ranked DMP, cg11971248, is located in the gene body of the 4-hydroxybenzoate polyprenyltransferase (COQ2) gene in a region associated with transcriptional activation (mean Δβ = 0.01, p = 1.79e–06). We also assessed the top 10 DMPs to determine whether there were differences associated with the use of biologic therapy. No differences were found between the two groups (data not shown).
Table 4.
Top 10 ranked differentially methylated positions (DMPs) in 149 patients comparing active (n = 79) with inactive (n = 70) inflammatory bowel disease.
| Probe ID | Mean ∆β | p value | Adjusted p | Hg19 | Illumina annotation | Probe type | Gene annotation from GREAT (distance from TSS) |
|---|---|---|---|---|---|---|---|
| cg11971248 | 0.011 | 1.79e–06 | 0.771 | Chr4: 84203337 | COQ2 | II | COQ2 (+2729), COPS4 (+247099) |
| cg26455541 | 0.007 | 2.48e–06 | 1 | Chr4: 26321238 | RBPJ | I | RBPJ (–1190) |
| cg10724442 | 0.004 | 2.87e–06 | 1 | Chr19: 40971809 | SPTBN4; BLVRB | I | SPTBN4 (–1316), BLVRB (–85) |
| cg21494337 | 0.006 | 2.88e–06 | 1 | Chr2: 25015597 | CENPO; C2orf79 | II | CENPO (–733), PTRHD1 (+653) |
| cg15613012 | –0.010 | 3.40e–06 | 1 | Chr6: 28887742 | TRIM27 | II | SCAND3 (–332631), TRIM27 (+4025) |
| cg21218864 | 0.017 | 3.41e–06 | 1 | Chr1: 206730120 | RASSF5 | II | RASSF5 (+49242), EIF2D (+55783) |
| cg17440044 | 0.017 | 4.05e–06 | 1 | Chr7: 100167198 | II | SAP25 (+4071), AGFG2 (+30365) | |
| cg22380652 | 0.006 | 4.57e–06 | 1 | Chr1: 43389667 | II | SLC2A1 (+35179), ZNF691 (+77424) | |
| cg27386912 | 0.007 | 4.64e–06 | 1 | Chr3: 52479108 | SEMA3G | II | SEMA3G (–66) |
| cg02712401 | 0.004 | 5.60e–06 | 1 | Chr12: 6961946 | USP5; CDCA3 | II | CDCA3 (–1491), USP5 (+662) |
Adjusted p; Bonferroni corrected p value; Hg19, Human Genome version 19; GREAT, Genomic Regions Enrichment of Annotations Tool; TSS, transcription start site.
3.5. TRAF6 technical validation and gene expression analysis
Technical validation of the 450K DNA methylation results was performed by pyrosequencing the TRAF6 CpG site, cg01476222. We studied TRAF6 because it was hypermethylated in both CD and UC compared with controls (∆β = 0.10, p adjusted = 1.52e–11; ∆β = 0.09, p adjusted = 6.59e–08) and is a key component of important immune response pathways, including NF-κB and TNF signalling. Bisulphite pyrosequencing of TRAF6 strongly correlated with our Illumina 450K DNA methylation results (r = 0.88, p < 0.0001, Figure 3A) and confirmed DNA hypermethylation in IBD cases compared with controls at this locus (p < 0.001, Figure 3B). We also examined mRNA levels of TRAF6 in a sub-cohort of IBD patients (n = 63) and controls (n = 20). TRAF6 gene expression was downregulated in IBD patients compared with controls, consistent with our finding of DNA hypermethylation at this region (Figure 3B and C).
Figure 3.

TRAF6 is hypermethylated and expression is reduced in peripheral blood mononuclear cells (PBMCs) of patients with inflammatory bowel disease (IBD) compared with healthy controls. (A) Bisulphite pyrosequencing of TRAF6 confirmed our Illumina 450K DNA methylation results. The β value for cg01476222 (TRAF6, intron 2) obtained from the Illumina 450K analysis was strongly correlated with DNA methylation levels of this CpG site obtained by pyrosequencing. Correlation was assessed using Spearman’s test. (B) TRAF6 DNA methylation (determined by pyrosequencing) was significantly increased in the PBMCs of patients with IBD (n = 146) compared with healthy controls (n = 35). Boxes represent interquartile ranges and error bars 95th centiles. (C) RNA was isolated from patient (n = 63) and control (n = 20) PBMCs and TRAF6 expression was analysed by real-time PCR. ∆Ct was calculated relative to 18s. TRAF6 expression was significantly reduced in IBD patient samples compared with controls. Boxes represent interquartile ranges and error bars 95th centiles. ***p < 0.001, Mann–Whitney U test.
3.6. Investigating top-ranked IBD-associated DMPs in colonic mucosa from treatment-naive paediatric IBD cases
We examined DNA methylation at the top-ranked IBD-associated DMP (cg16176675, TIFAB) and at cg01476222, TRAF6 in colonic mucosa from treatment-naive paediatric IBD cases and control samples (24 IBD cases [15 CD and 9 UC]) and 22 controls. The top-ranked IBD-associated DMP (cg16176675, TIFAB) was found to be significantly differentially methylated in paediatric colonic mucosal samples in patients with UC (mean ∆β = –0.06, q = 5.60e–06) and CD (mean ∆β = –0.03, q = 0.05) compared with controls. Meanwhile, the TRAF6-associated DMP was significantly differentially methylated in UC cases compared with controls (mean ∆β = –0.12, q = 0.005) but not in CD cases compared with controls (mean ∆β = –0.05, q = 0.21). Both DMPs were hypomethylated in colonic mucosa in paediatric IBD cases compared with controls, in contrast to our findings in PBMCs obtained from adult IBD patients, which showed evidence of hypermethylation compared with controls. In addition, the methylation status of 11 CpG sites in the TRIM39-RPP21 gene identified in our regional analysis was also examined in colonic mucosa from paediatric IBD cases. DNA methylation data were available for 9 of the 11 CpG sites and all 9 CpG sites were significantly hypomethylated in colonic mucosa from treatment-naive paediatric UC (but not CD) cases compared with controls (Figure 2C).
4. Discussion
This study has identified numerous site-specific changes in DNA methylation in genes that have not been widely described in IBD, but are associated with pathways that are integral to the disorder. The top-ranked DMP (cg16176675) was significantly hypermethylated in both CD and UC cases compared with controls. This IBD-associated DMP is located in the 5ʹ-UTR of protein coding gene, TIFAB (TRAF-interacting protein with forkhead-associated domain, family member B). TIFAB, by inducing a conformational change in TIFA (TRAF-interacting protein with a forkhead-associated domain), limits the interaction between IRAK1 and TRAF6.29 Interestingly, the same CpG site was also significantly differentially methylated in colonic mucosa samples of treatment-naive paediatric IBD patients compared with controls. Of note, we observed DNA hypermethylation at this locus in adult IBD patients in contrast to the DNA hypomethylation observed in the colonic mucosa samples of paediatric patients. It is possible, therefore, that while aberrant DNA methylation at this locus is associated with IBD pathogenesis, methylation patterns and potential regulation of this locus differs between adult and paediatric IBD or between blood and mucosal samples. Of note, comparison of the top-ranked DMPs and the TRIM39-RPP21 DMR identified in this study with previous DNA methylation studies in adult cohorts of IBD11,12 patients was not possible; these studies performed DNA methylation profiling using the HumanMethylation27 DNA methylation array, which only covers a small subset of the CpG sites covered by the HumanMethylation450 BeadChip array used in this study. The HumanMethylation27 DNA methylation array does not cover DMPs TIFAB (cg16176675) and TRAF6 (cg01476222) and the TRIM39-RPP21 DMR. However, further epigenetic profiling in clearly defined adult and paediatric cohorts in both CD and UC in multiple different nationalities is required to confirm the validity of our results and their relevance to other populations.
In this study, we found considerable overlap between UC and CD DMPs, with 45% of CD-associated DMPs also differentially methylated in UC and 97% of UC DMPs also differentially methylated in CD. These data indicate that, similar to genetic findings in IBD, where several of the described loci are common to both diseases, a large number of the epigenetic disease associations may be shared by the IBD subgroups.1 A DNA methylome study of colonic mucosal biopsies of paediatric IBD patients also reported significant overlap (53.7%) between CD-associated and UC-associated DMRs.13 Furthermore, a meta-analysis of whole-genome transcriptional profiling of IBD colon mucosa described an absence of major transcriptional differences between CD and UC.30 However, GO enrichment analysis in CD implicated pathways associated with both adaptive and innate immunity (e.g. T cell regulation) in contrast to UC, which highlighted those associated with innate responses only (e.g. cellular response to lipopolysaccharide and cellular response to molecules of bacterial origin). These data suggest that while distinct patterns of immune dysregulation occur, overall the epigenetic architecture appears similar.
Although the majority of top-ranked disease-associated DMPs identified in this study are hypermethylated compared with controls overall, there is no bias towards either hypermethylation or hypomethylation at significant DMPs in this study (Supplementary Figure 3). Several of the top-ranked UC- and CD-associated DMPs were located in the vicinity of genes involved in pathways implicated in IBD. For example, cg01476222, located in the gene body of TRAF6, was hypermethylated in both UC and CD. TRAF6 mediates signal transduction downstream of the TNF receptor superfamily as well as the Toll/IL-1 family.31 We confirmed DNA methylation levels at the cg01476222 (TRAF6) locus in IBD cases and controls by bisulphite pyrosequencing. Our results strongly correlated with DNA methylation levels obtained from the Illumina 450K BeadChip array; this is consistent with previous studies.32,33,34,35 Furthermore, we found a significant reduction in TRAF6 mRNA expression in cases compared with controls, indicating that hypermethylation at this locus coincides with reduced mRNA expression. To the best of our knowledge, this is the first report implicating aberrant DNA methylation and gene expression of TRAF6 in the pathogenesis or pathology of IBD. A recent study showing that mice lacking Traf6 have exacerbated dextran sodium sulphate-induced colitis corroborates our findings.36 Interestingly, we found that the same CpG site is significantly differentially methylated in colonic mucosa samples from treatment-naive paediatric UC patients compared with control subjects but in the opposite direction, suggesting that while aberrant DNA methylation at this locus is associated with IBD pathogenesis, DNA methylation patterns and potential regulation of this locus differ in adult and paediatric IBD. Future work evaluating both DNA methylation and gene expression changes in TRAF6 in a larger cohort of IBD patients and controls is warranted to evaluate its potential as a diagnostic biomarker or therapeutic target for IBD.
In addition to identifying site-specific disease-associated changes in DNA methylation, identification of regional DNA methylation variations may also be important. Our region-level analysis identified an IBD-associated DMR (spanning 11 CpG sites) in the promoter region of the TRIM39-RPP21 protein-coding gene and overlapping the third exon of TRIM39. TRIM39-RPP21 encodes a putative PKGI-interactor that is a novel variant of TRIM39.37 TRIM39-RPP21 regulates the type I interferon pathway and is thus important in regulation of viral immunity.38 This IBD-associated DMR was also significantly hypomethylated in colonic mucosa from paediatric UC patients. Interestingly, TRIM39 gene expression is significantly increased in both CD (log2 fold change = 0.175, corrected p value = 0.03) and UC (log2 fold change = 0.161, corrected p value = 0.0002) compared with controls in a whole-genome gene expression analysis of IBD colon mucosa.30 DNA methylation changes in this region could potentially have a regulatory role in both TRIM39 and TRIM39-RPP21 gene expression and/or splicing of this locus, warranting further investigation in larger cohorts of adult and paediatric IBD patients to help understand its potential role in disease pathology. Of note, due to limitations in the design of the 450K array, which contains sparsely represented areas of the genome, it is plausible that other disease-associated DMRs may not have been captured by the method used in this study.
The precise factors that lead to IBD development remain unknown, as do the molecular changes associated with disease recurrence and activity. We therefore examined genome-wide DNA methylation changes in patients with active and inactive IBD. We observed no statistically significant changes in DNA methylation in active IBD compared with inactive disease. However, a number of the top-ranked active disease-associated DMPs are associated with genes that have previously been implicated in IBD susceptibility. For example, cg26455541, which is hypermethylated in active IBD compared with inactive disease, is located in RBPJ. Mice harbouring IEC-specific deletion of Rbpj (RBP-JΔIEC) spontaneously develop chronic colitis.39 Further, larger studies assessing disease activity would be valuable in defining the association between activity and DNA methylation changes that may occur during disease progression and regression.
Our study does have several caveats. Firstly, methylation profiling was performed on PBMCs rather than on mucosal samples. However, it is well established that IBD is associated with systemic inflammation and it is therefore plausible that disease-related changes in DNA methylation can be identified in peripheral blood. Furthermore, in this study we confirmed IBD-associated differential methylation of 2 of top-ranked DMP (cg23933044) and DMP (cg01476222) and top-ranked DMR (TRIM39-RPP21) using colonic mucosal samples, indicating that locus-specific methylation patterns identified in peripheral tissue can reflect DNA methylation patterns in disease-related tissue. Moreover, the colonic samples we used were taken from treatment-naive cases, suggesting that changes in DNA methylation at these loci are not a consequence of IBD-related treatments. Although further comparison studies are necessary in paired mucosal and haematological tissues, our data indicate that easily accessible peripheral tissues, such as PBMCs, may have potential as candidate biomarkers for IBD in the future. A further caveat is that our study group included both CD and UC patients with varying degrees of disease activity as measured using a combination of clinical, biological and endoscopic variables. In addition, our study group was heterogeneous with regard to disease location, biologic use and disease duration. However, this heterogeneous cohort allowed us to determine epigenetic similarities and differences between those with CD and UC, and also compare DNA methylation profiles of patients with active and inactive IBD. We found no statistically significant epigenetic differences between patients with active or inactive disease or on biologic therapies. However, larger, more powerful studies on more homogeneous patient populations with respect to disease duration, disease location and other clinical features will be required to tease out these associations more thoroughly. A final comment is that RNA was only available for a sub-cohort of samples and thus we could only assess the functional effect of DNA methylation at one locus, TRAF6. Nevertheless, our results provide the impetus for future studies that aim to integrate methylomic findings with transcriptional profiles in large-scale IBD cohorts.
Overall, we present strong evidence that epigenetic variation is associated with IBD and that differences in DNA methylation can be identified in peripheral blood DNA samples. We identified numerous significant site-specific and regional changes in DNA methylation in genes associated with pathways integral to IBD pathogenesis, including TRIM39-RPP21 and TRAF6, which were hypomethylated and hypermethylated, respectively, in both UC and CD. Moreover, TRAF6 mRNA expression was reduced in IBD cases compared to controls, suggesting that hypermethylation at this locus coincides with reduced gene expression. Finally, there was considerable overlap between UC and CD DMPs. These findings are consistent with previous transcriptional and genetic findings in IBD, indicating a considerable overlap between CD and UC molecular pathology.
Funding
This research was supported by a grant from AbbVie (no. 10118). EMcD was the recipient of the Boston Scientific Newman Fellowship awarded by the UCD Foundation. RK was supported by Gutsy Kids Fund, including philanthropic donation from the Karen and Brock Wagner family, the Houston Men of Distinction and the National Institutes of Health (P30 DK56338).
Conflict of Interest
The authors declare no conflict of interest.
Supplementary Material
Acknowledgments
The authors acknowledge the helpful contributions of Professor Jack Satsangi and his scientific and clinical staff at the University of Edinburgh during preparation of this manuscript.
References
- 1. Jostins L, Ripke S, Weersma RK, et al. Host-microbe interactions have shaped the genetic architecture of inflammatory bowel disease. Nature 2012;491:119–24. [DOI] [PMC free article] [PubMed] [Google Scholar]
- 2. Ventham NT, Kennedy NA, Nimmo ER, Satsangi J. Beyond gene discovery in inflammatory bowel disease: the emerging role of epigenetics. Gastroenterology 2013;145:293–308. [DOI] [PMC free article] [PubMed] [Google Scholar]
- 3. Rubin DT, Hanauer SB. Smoking and inflammatory bowel disease. Eur J Gastroenterol Hepatol 2000;12:855–62. [DOI] [PubMed] [Google Scholar]
- 4. Mishkin S. Dairy sensitivity, lactose malabsorption, and elimination diets in inflammatory bowel disease. Am J Clin Nutr 1997;65:564–7. [DOI] [PubMed] [Google Scholar]
- 5. Murphy TM, Mill J. Epigenetics in health and disease: heralding the EWAS era. Lancet 2014;383:1952–4. [DOI] [PubMed] [Google Scholar]
- 6. Tsaprouni LG, Yang TP, Bell J, et al. Cigarette smoking reduces DNA methylation levels at multiple genomic loci but the effect is partially reversible upon cessation. Epigenetics 2014;9:1382–96. [DOI] [PMC free article] [PubMed] [Google Scholar]
- 7. Lim U, Song MA. Dietary and lifestyle factors of DNA methylation. Methods Mol Biol 2012;863:359–76. [DOI] [PubMed] [Google Scholar]
- 8. Murphy TM, Mullins N, Ryan M, et al. Genetic variation in DNMT3B and increased global DNA methylation is associated with suicide attempts in psychiatric patients. Genes Brain Behav 2013;12:125–32. [DOI] [PubMed] [Google Scholar]
- 9. Lin Z, Hegarty JP, Yu W, et al. Identification of disease-associated DNA methylation in B cells from Crohn’s disease and ulcerative colitis patients. Dig Dis Sci 2012;57:3145–53. [DOI] [PubMed] [Google Scholar]
- 10. Karatzas PS, Mantzaris GJ, Safioleas M, Gazouli M. DNA methylation profile of genes involved in inflammation and autoimmunity in inflammatory bowel disease. Medicine 2014;93:e309. [DOI] [PMC free article] [PubMed] [Google Scholar]
- 11. Nimmo ER, Prendergast JG, Aldhous MC, et al. Genome-wide methylation profiling in Crohn’s disease identifies altered epigenetic regulation of key host defense mechanisms including the Th17 pathway. Inflamm Bowel Dis 2012;18:889–99. [DOI] [PubMed] [Google Scholar]
- 12. Cooke J, Zhang H, Greger L, et al. Mucosal genome-wide methylation changes in inflammatory bowel disease. Inflamm Bowel Dis 2012;18:2128–37. [DOI] [PubMed] [Google Scholar]
- 13. Harris RA, Nagy-Szakal D, Mir SA, et al. DNA methylation-associated colonic mucosal immune and defense responses in treatment-naive pediatric ulcerative colitis. Epigenetics 2014;9:1131–7. [DOI] [PMC free article] [PubMed] [Google Scholar]
- 14. Adams AT, Kennedy NA, Hansen R, et al. Two-stage genome-wide methylation profiling in childhood-onset Crohn’s disease implicates epigenetic alterations at the VMP1/MIR21 and HLA loci. Inflamm Bowel Dis 2014;20:1784–93. [DOI] [PMC free article] [PubMed] [Google Scholar]
- 15. Pardi DS, Sandborn WJ. Predicting relapse in patients with inflammatory bowel disease: what is the role of biomarkers? Gut 2005;54:321–2. [DOI] [PMC free article] [PubMed] [Google Scholar]
- 16. Pidsley R, CC YW, Volta M, Lunnon K, Mill J, Schalkwyk LC. A data-driven approach to preprocessing Illumina 450K methylation array data. BMC Genomics 2013;14:293. [DOI] [PMC free article] [PubMed] [Google Scholar]
- 17. Price ME, Cotton AM, Lam LL, et al. Additional annotation enhances potential for biologically-relevant analysis of the Illumina Infinium HumanMethylation450 BeadChip array. Epigenetics Chromatin 2013;6:4. [DOI] [PMC free article] [PubMed] [Google Scholar]
- 18. Chen YA, Lemire M, Choufani S, et al. Discovery of cross-reactive probes and polymorphic CpGs in the Illumina Infinium HumanMethylation450 microarray. Epigenetics 2013;8:203–9. [DOI] [PMC free article] [PubMed] [Google Scholar]
- 19. Johnson WE, Li C, Rabinovic A. Adjusting batch effects in microarray expression data using empirical Bayes methods. Biostatistics 2007;8:118–27. [DOI] [PubMed] [Google Scholar]
- 20. Morris TJ, Butcher LM, Feber A, et al. ChAMP: 450k Chip Analysis Methylation Pipeline. Bioinformatics 2014;30:428–30. [DOI] [PMC free article] [PubMed] [Google Scholar]
- 21. Jaffe AE, Irizarry RA. Accounting for cellular heterogeneity is critical in epigenome-wide association studies. Genome Biol 2014;15:R31. [DOI] [PMC free article] [PubMed] [Google Scholar]
- 22. Horvath S. DNA methylation age of human tissues and cell types. Genome Biol 2013;14:R115. [DOI] [PMC free article] [PubMed] [Google Scholar]
- 23. Houseman EA, Accomando WP, Koestler DC, et al. DNA methylation arrays as surrogate measures of cell mixture distribution. BMC Bioinformatics 2012;13:86. [DOI] [PMC free article] [PubMed] [Google Scholar]
- 24. Du P, Zhang X, Huang CC, et al. Comparison of beta-value and M-value methods for quantifying methylation levels by microarray analysis. BMC Bioinformatics 2010;11:587. [DOI] [PMC free article] [PubMed] [Google Scholar]
- 25. Pedersen BS, Schwartz DA, Yang IV, Kechris KJ. Comb-p: software for combining, analyzing, grouping and correcting spatially correlated P-values. Bioinformatics 2012;28:2986–8. [DOI] [PMC free article] [PubMed] [Google Scholar]
- 26. Young MD, Wakefield MJ, Smyth GK, Oshlack A. Gene ontology analysis for RNA-seq: accounting for selection bias. Genome Biol 2010;11:R14. [DOI] [PMC free article] [PubMed] [Google Scholar]
- 27. Benjamini Y HY. Controlling the false discovery rate: a practical and powerful approach to multiple testing. R Stat Soc Series B Stat Methodol 1995;57:289–300. [Google Scholar]
- 28. Aryee MJ, Jaffe AE, Corrada-Bravo H, et al. Minfi: a flexible and comprehensive Bioconductor package for the analysis of Infinium DNA methylation microarrays. Bioinformatics 2014;30:1363–9. [DOI] [PMC free article] [PubMed] [Google Scholar]
- 29. Matsumura T, Semba K, Azuma S, et al. TIFAB inhibits TIFA, TRAF-interacting protein with a forkhead-associated domain. Biochem Biophys Res Commun 2004;317:230–4. [DOI] [PubMed] [Google Scholar]
- 30. Granlund A, Flatberg A, Ostvik AE, et al. Whole genome gene expression meta-analysis of inflammatory bowel disease colon mucosa demonstrates lack of major differences between Crohn’s disease and ulcerative colitis. PLoS One 2013;8:e56818. [DOI] [PMC free article] [PubMed] [Google Scholar]
- 31. Wu H, Arron JR. TRAF6, a molecular bridge spanning adaptive immunity, innate immunity and osteoimmunology. BioEssays 2003;25:1096–105. [DOI] [PubMed] [Google Scholar]
- 32. Dempster EL, Wong CC, Lester KJ, et al. Genome-wide methylomic analysis of monozygotic twins discordant for adolescent depression. Biol Psychiatry 2014;76:977–83. [DOI] [PMC free article] [PubMed] [Google Scholar]
- 33. Pidsley R, Viana J, Hannon E, et al. Methylomic profiling of human brain tissue supports a neurodevelopmental origin for schizophrenia. Genome Biol 2014;15:483. [DOI] [PMC free article] [PubMed] [Google Scholar]
- 34. Roessler J, Ammerpohl O, Gutwein J, et al. Quantitative cross-validation and content analysis of the 450k DNA methylation array from Illumina, Inc. BMC Res Notes 2012;5:210. [DOI] [PMC free article] [PubMed] [Google Scholar]
- 35. Harris RA, Nagy-Szakal D, Pedersen N, et al. Genome-wide peripheral blood leukocyte DNA methylation microarrays identified a single association with inflammatory bowel diseases. Inflamm Bowel Dis 2012;18:2334–41. [DOI] [PMC free article] [PubMed] [Google Scholar]
- 36. Vlantis K, Polykratis A, Welz PS, van Loo G, Pasparakis M, Wullaert A. TLR-independent anti-inflammatory function of intestinal epithelial TRAF6 signalling prevents DSS-induced colitis in mice. Gut 2015. pii:gutjnl-2014-308323. doi:10.1136/gutjnl-2014-308323. [Epub ahead of print]. [DOI] [PMC free article] [PubMed] [Google Scholar]
- 37. Roberts JD, Jr, Chiche JD, Kolpa EM, Bloch DB, Bloch KD. cGMP-dependent protein kinase I interacts with TRIM39R, a novel Rpp21 domain-containing TRIM protein. Am J Physiol Lung Cell Mol Physiol 2007;293:L903–12. [DOI] [PubMed] [Google Scholar]
- 38. Kurata R, Tajima A, Yonezawa T, Inoko H. TRIM39R, but not TRIM39B, regulates type I interferon response. Biochem Biophys Res Commun 2013;436:90–5. [DOI] [PubMed] [Google Scholar]
- 39. Obata Y, Takahashi D, Ebisawa M, et al. Epithelial cell-intrinsic Notch signaling plays an essential role in the maintenance of gut immune homeostasis. J Immunol 2012;188:2427–36. [DOI] [PubMed] [Google Scholar]
Associated Data
This section collects any data citations, data availability statements, or supplementary materials included in this article.