Abstract
Motivation: The Illumina HumanMethylation450 BeadChip has been extensively utilized in epigenome-wide association studies. This array and its successor, the MethylationEPIC array, use two types of probes—Infinium I (type I) and Infinium II (type II)—in order to increase genome coverage but differences in probe chemistries result in different type I and II distributions of methylation values. Ignoring the difference in distributions between the two probe types may bias downstream analysis.
Results: Here, we developed a novel method, called Regression on Correlated Probes (RCP), which uses the existing correlation between pairs of nearby type I and II probes to adjust the beta values of all type II probes. We evaluate the effect of this adjustment on reducing probe design type bias, reducing technical variation in duplicate samples, improving accuracy of measurements against known standards, and retention of biological signal. We find that RCP is statistically significantly better than unadjusted data or adjustment with alternative methods including SWAN and BMIQ.
Availability: We incorporated the method into the R package ENmix, which is freely available from the Bioconductor website (https://www.bioconductor.org/packages/release/bioc/html/ENmix.html).
Contact: niulg@ucmail.uc.edu
Supplementary information: Supplementary data are available at Bioinformatics online.
1 Introduction
The advance of DNA methylation arrays in recent years has enabled large-scale epigenome-wide studies at single CpG site resolution. The Illumina Infinium HumanMethylation450 BeadChip (Bibikova et al., 2011) is currently the most commonly utilized array. It provides measurement of methylation level at about half a million individual CpG sites. Its successor, the Infinium MethylationEpic BeadChip, provides measurement of methylation level at more than 850 000 sites. To increase CpG coverage across the human genome, both arrays utilize probes of two different chemistries, Infinium I (type I) and Infinium II (type II). However, methylation measurements (beta values) derived from the two types of probes exhibit different distributions. In particular, beta values derived from type II probes have a smaller dynamic range and are not as reproducible as the beta values derived from type I probes (Dedeurwaerder et al., 2011).
Several methods have been proposed to normalize the beta values derived from the two types of probes. These include adjusting the beta values from both types of probes so that they are more ‘comparable’ (e.g. SWAN (Maksimovic et al., 2012) implemented in the minfi package), or adjusting beta values from type II probes using beta values from type I probes as referents, (e.g. the Peak Based Correction (PBC) (Dedeurwaerder et al., 2011) and Beta MIxture Quantile dilation (BMIQ) (Teschendorff et al., 2013). Here, we proposed a novel method of adjusting type II probe beta values based on the correlation between a subset of closely spaced pairs of type I and II probes. This method, Regression on Correlated Probes (RCP), is simple, accurate and efficient. We tested RCP on multiple datasets and found that RCP outperformed BMIQ and other methods. RCP has been implemented in Bioconductor package ENmix (Xu et al., 2015), is freely available for use, and can be combined with other pre-processing methods.
2 Methods
2.1 RCP: Regression on correlated probes
Spatial correlation of DNA methylation is well known (Eckhardt et al., 2006; Zhang et al., 2015) with CpG sites near to one another (e.g. <100 base pairs) often having similar methylation, particularly if they have similar genomic context (e.g. location in CpG island, shore or shelf). Taking advantage of this correlation we propose a novel method, RCP, which uses a subset of type I and II probe pairs to derive the quantitative relationship between different probe type measurements. Once derived, this relationship is used to recalibrate all of the less-accurate type II probe measurements so that they more closely approximate the more accurate type I probe measurements.
RCP first identifies pairs of nearby (<25 base pairs apart) type I and II probes that have the same genomic context according to Illumina annotation (Island, N_Shelf, N_Shore, S_Shelf, S_shore or OpenSea) and, for each sample, regresses the methylation M-value (logit of beta value) quantiles obtained from the type I probes on the corresponding quantiles for the type II probes. Using the estimated linear regression coefficients ( and ), RCP then adjusts all type II probe measurements as:
where is the index of a type II probe, is the raw M-value of the probe and Mi,adj is the adjusted M-value. Finally, RCP uses the inverse logit function to convert the adjusted M-values Mi,adj to the adjusted beta values.
2.2 Evaluation datasets
Dataset 1: A total of 19 pairs of duplicate whole blood samples (38 samples total) from Markunas et al. (2014). As part of this study, duplicate samples were located on separate 96 well plates that underwent independent bisulfite conversion, hybridization and array scanning. To avoid possible impact on evaluations we excluded 69 075 probes, including probes with non-specific binding, probes with common (MAF > 0.05) SNPs at CpG target regions, probes on sex chromosomes and probes with multimodal methylation distributions identified using the ENmix package. We also excluded data points with low quality methylation values where the number of beads was less than 3 or detection P-value greater than 0.05.
Dataset 2: A total of 39 methylation laboratory standard control samples reported by Xu et al. (2015). Human unmethylated DNA (HCT116 double knock out (DKO) of both DNA methyltransferases DNMT1 (-/-) and DNMT3b (-/-)) and fully methylated DNA (HCT116 DKO DNA enzymatically methylated) were obtained commercially (Zymo Research, Irving CA) and mixed together in different proportions to create laboratory control samples with specific methylation levels: 0, 5, 10, 20, 40, 50, 60, 80 and 100% methylated. Replicates for each methylation level (n = 10, 3, 2, 3, 3, 2, 3, 3 and 10, respectively) were independently assayed on different arrays.
Three publically available methylation datasets have been utilized to evaluate various probe type bias correction methods in a previous publication (Teschendorff et al., 2013). To facilitate direct comparison of different correction methods we evaluated RCP in these same datasets:
Dataset 3: 450K dataset of three replicates from the HCT116 WT cell-line (Dedeurwaerder et al., 2011) and matched bisulfite pyrosequencing (BPS) data for nine type II probes (Dedeurwaerder et al., 2011);
Dataset 4: 450K dataset of five fresh frozen (FF) head and neck cancer (HNC) samples, of which two were HPV+ and three HPV- (GEO accession number: GSM937820 to GSM937824; (Lechner et al., 2013)); and
Dataset 5: 450K dataset of 32 formalin-fixed paraffin-embedded (FFPE) HNC samples, of which 18 were HPV+ and 14 HPV- (GEO accession number: GSE38266; (Lechner et al., 2013)). Note that the original GEO dataset GSE38266 contains datasets for 42 FFPE HNC samples, of which 10 were excluded from the evaluation due to poor data quality.
3 Results
3.1 RCP is robust to parameter selections
RCP is based on regression estimates in methylation M-value quantiles between nearby type I and II probes. To investigate the robustness of RCP to the distance cutoff between type I and II probes, we chose four distance cutoffs: 10 bp (resulting in 6523 pairs), 25 bp (15 855 pairs), 50 bp (27 937 pairs) and 100 bp (47 090 pairs). To investigate robustness to the number of evenly spaced quantiles we chose three sets of quantiles with 199, 999 and 1999 members. For each of the 38 samples in Dataset 1, we used the twelve different combinations of distance and quantiles to obtain RCP-adjusted type II beta values. Using the values obtained from one of these twelve combinations (cutoff = 25 bp and 999 quantiles) as the referent, we observed little difference in the resulting adjusted beta values obtained with different distance or quantile combinations (Supplementary Table 1). Thus, for all of the subsequent RCP analyses presented here, we used a distance cutoff of 25 base pairs and 999 evenly spaced quantiles (0.001, 0.002,…, 0.999).
3.2 RCP reduces probe design type bias
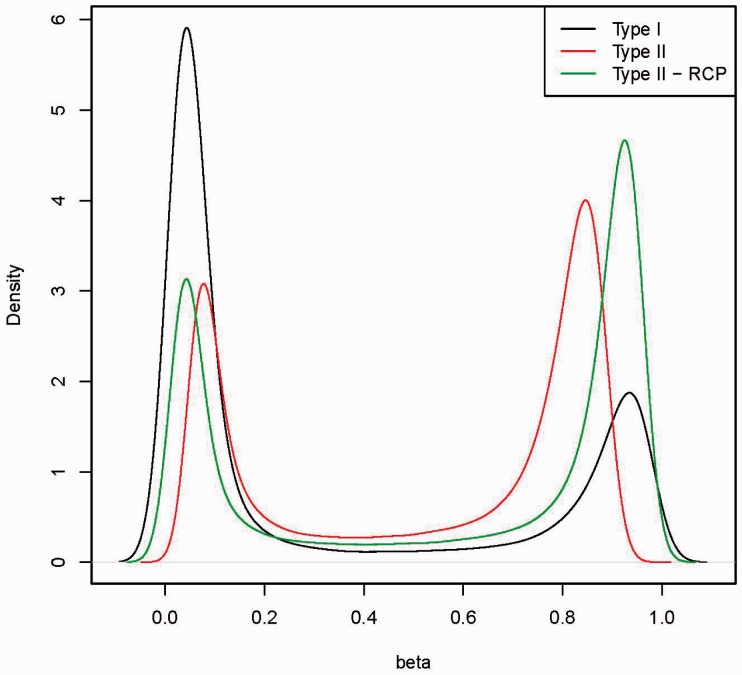
RCP reduces probe-type bias such that type I and II probes have distributions with similar modes (a mode here is a value at which the distribution has a local maximum value) and dynamic ranges (Fig. 1). For the 38 samples in Dataset 1, the average absolute difference between type I and II probes for the first (left) mode in raw beta value distributions was 0.014 (SD = 0.007) and for the second (right) mode was 0.11 (SD = 0.02). After RCP adjustment, the mode location differences were significantly reduced to 0.001 (SD = 0.001) and 0.005 (SD = 0.003) (Student paired T test P = and , respectively).
Fig. 1.
Density estimations of beta values from type I probes (Type I), type II probes (Type II) and RCP adjusted beta values from Type II probes (Type II—RCP) for a typical sample whole blood sample (Markunas et al., 2014)
3.3 RCP reduces technical variation
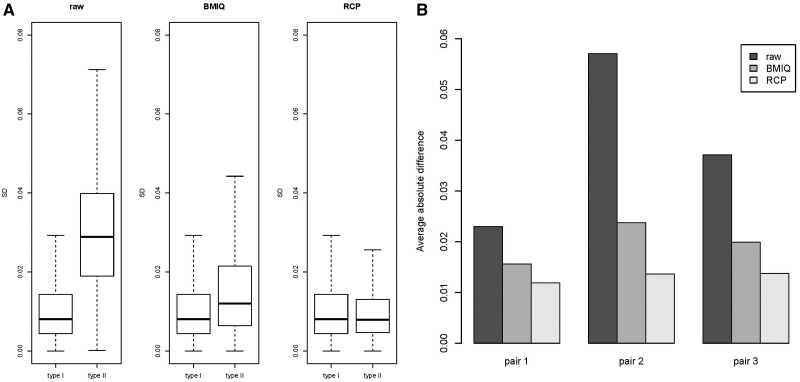
Similar to Xu et al. (2013), we calculated the mean-centered correlation and the mean absolute difference between duplicates in Dataset 1. We used these two measures as performance metrics to evaluate the effect of RCP and alternative methods on technical variation and reproducibility. As shown in Table 1, all three methods (RCP, SWAN and BMIQ) provided significant improvement over raw values for type II probes; and direct comparison of RCP to other methods showed that RCP was significantly better than BMIQ and SWAN for both performance metrics. As a further test of RCP in reducing technical variation, and to facilitate direct comparisons with previously published methods, we replicated the analysis of Dataset 3 originally published in Dedeurwaerder et al. (2011) and again in Teschendorff et al. (2013). Using the three replicate 450K measurements made on HCT116 WT cell-lines we computed the standard deviation for each probe after different adjustment methods. RCP provided the greatest reduction in variation for type II probes (Fig. 2A), and that reduction is statistically significant compared against either raw data (P < ) or BMIQ (P < ). RCP also reduced the average absolute difference in methylation between replicate pairs (Fig. 2B), and that reduction is statistically significant against raw data (P < for all three pairs respectively) and BMIQ (P < for all three pairs respectively).
Table 1.
Effect of various bias correction methods on methylation concordance for 19 pairs of duplicate samples evaluated using mean-centered correlation coefficient (larger is better) and average absolute methylation difference (smaller is better)
| Infinium I |
Infinium II |
|||||||
|---|---|---|---|---|---|---|---|---|
| Method | Ra | Pb | MethDiffc | Pb | Ra | Pb | Methdiffc | Pb |
| RAW | 0.449 | Ref | 2.182 | Ref | 0.387 | ref | 3.165 | ref |
| BMIQ | 0.449 | Ref | 2.182 | Ref | 0.428 | 0.024 | 2.782 | |
| SWAN | 0.446 | 0.625 | 2.223 | 0.900 | 0.436 | 2.499 | ||
| RCP | 0.449 | Ref | 2.182 | Ref | 0.500§ | 2.354‖ | ||
Although all methods provide improvement over unadjusted type II probe raw data, RCP is significantly better than BMIQ and SWAN.
aAverage mean-centered correlation coefficient for 19 duplicate-pairs.
bBased on one-sided Student’s paired T-test against raw result.
cMethDiff: Average mean absolute methylation beta value difference (%) for 19 duplicate pairs.
§P-values of one-sided Student’s paired T-test of RCP result against BMIQ result and SWAN result are and respectively.
‖P-values of one-sided Student’s paired T-test of RCP result against BMIQ result and SWAN result are and 0.019 respectively.
Fig. 2.
(A) Boxplots of the standard deviations of beta values across the three HCT116 WT replicates considered in Dedeurwaerder et al. (2011), for raw beta values (raw), adjusted beta values by BMIQ (BMIQ) and adjusted beta values by RCP (RCP). (B) Bar plots of the averaged (across type II probes) absolute difference of beta values between two replicates in each of three possible pairs of the three replicates, for raw beta values (raw), adjusted beta values by BMIQ (BMIQ) and adjusted beta values by RCP (RCP)
3.4 RCP improves data accuracy
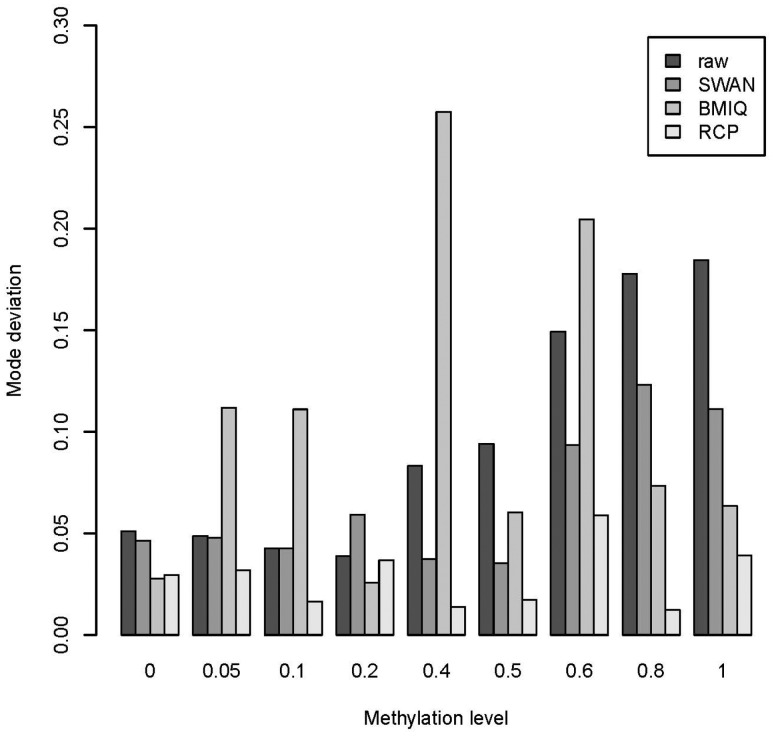
In order to determine the effect of different adjustment methods on methylation accuracy we evaluated RCP and alternative methods using data from a set of laboratory controls with known methylation ranging from 0 to 100% (Dataset 2). We compared the performance of all three methods (RCP, SWAN and BMIQ) on improving data accuracy for beta values from type II probes. In particular, for each of the 39 samples, we identified the mode of the distribution of beta values from type II probes following different adjustment methods. We then calculated the absolute difference between the expected methylation level (0, 5, 10, 20, 40, 50, 60, 80 or 100%) and the average of the modes obtained from the replicate samples representing that methylation level. Overall RCP had modes that were significantly closer to the expected level than raw data (P ), SWAN (P ) and BMIQ (P ). Additionally, unlike BMIQ and SWAN, the RCP modes were always more accurate than raw values (Fig. 3).
Fig. 3.
Bar plots comparing absolute difference between distribution modes of type II probes and true methylation levels from Dataset 2 considered in Xu et al. (2015). Nine different methylation levels (0, 5, 10, 20, 40, 50, 60, 80 and 100%) were created by mixing unmethylated and fully methylated DNA together in different proportions, with each level of methylation represented by multiple replicates. RCP adjustment resulted in modes with the smallest average deviation from true levels
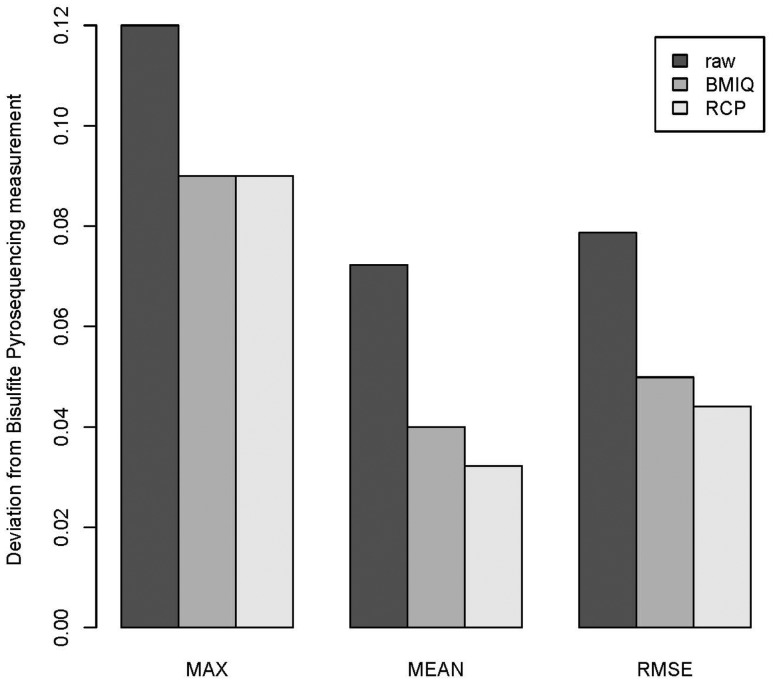
As a further test that RCP adjusts beta values closer to true methylation values and to facilitate direct comparisons with other published methods we reanalyzed Dataset 3 for which bisulfite pyrosequencing (BPS) measurements of nine type II probe sites were available (Dedeurwaerder et al., 2011). These BPS data were used as a gold standard by previous publications (Dedeurwaerder et al., 2011; Teschendorff et al., 2013). For the replicate in GEO dataset GSM815138, we calculated the absolute difference in beta value from the true estimate obtained by pyrosequencing at each of the nine probe sites. RCP outperforms raw and BMIQ-adjusted measures with RCP having statistically significantly smaller mean deviations from pyrosequencing results than raw beta values (P = 0.005) and BMIQ (P = 0.004) (Fig. 4).
Fig. 4.
Bar plots of the maximum (MAX), average (MEAN) and root mean square error (RMSE) of the deviations (absolute differences) from the bisulfite pyrosequencing measurement across nine type II probes for a HCT116 WT cell considered in (Dedeurwaerder et al., 2011), for three types of beta values: raw beta values and adjusted beta values by BMIQ and RCP respectively
3.5 RCP identifies more CpG sites associated with HPV status
A bias correction method should retain biological signals while reducing the technical variation. Similar to Teschendorff et al. (2013) we used a cross validation strategy to evaluate how RCP performs in identifying CpGs associated with HPV status. The two HPV+ and three HPV- HNC samples in Dataset 4 were used as a discovery set to identify HPV status-related differentially methylated CpG sites using the limma method (Smyth, 2004). The test set consists of 18 HPV+ and 14 HPV- FFPE HNC samples in Dataset 5 (Lechner et al., 2013). At false discovery rate (FDR) cutoff 0.35 (the same cutoff used by Teschendorff et al.), we identified similar numbers of differentially methylated CpG sites to those originally reported by Teschendorff et al. (2013) in raw data or BMIQ adjusted data (Table 2). RCP outperformed SWAN, PBC and BMIQ: it identified the most differentially methylated CpG sites (290) in the training set (Dataset 4), resulted the largest number of validated sites (81), and had the highest positive predictive value (PPV = 0.28). 56 sites were validated in both BMIQ-adjusted and RCP-adjusted data (Supplementary Table 2).
Table 2.
Comparison of different bias correction methods on retaining biological signals was done by counting the number of differentially methylated sites (nDMSs) associated with HPV status in FF HNC samples using the training set (Dataset 4), the number of validated differentially methylated sites (nTPs) associated with HPV status in FFPE HNC samples using the test set (Dataset 5), and also the estimates for the positive predictive value (PPV), i.e. nTP/nDMS
| Counts | Raw | SWAN | PBC | BMIQ | RCP |
|---|---|---|---|---|---|
| nDMS | 51 (51a) | 41a | 70a | 258 (252a) | 290 |
| PPV | 0.31 (0.25a) | 0.19a | 0.18a | 0.24 (0.20a) | 0.28 |
| nTP | 16 (13a) | 8a | 13a | 61 (51a) | 81 |
aValues reported by Teschendorff et al. (2013).
4 Discussion
Here, we introduce RCP, a novel method for 450K and EPIC BeadChips that reduces technical noise and improves measurement quality of type II probes. Although type I probes were used exclusively on the original 27K methylation arrays, Illumina has increasingly replaced them on subsequent arrays by type II probes, which now comprise 72% of the 450K array and 84% of the EPIC array. While type II probes facilitate increased array density, they cannot substitute for type I probes at some CpG sites and have decreased dynamic range and reproducibility compared to type I probes (Dedeurwaerder et al., 2011). Taking advantage of the high spatial correlation of DNA methylation levels along the human genome, RCP utilizes nearby type I and II probe pairs that share the same genomic context to derive a quantitative relationship between probe types for each sample using a quantile linear regression model, and then monotonically and smoothly recalibrates all type II probe measures of the sample based on the regression estimates. Evaluation of multiple datasets shows that RCP consistently outperforms PBC, SWAN and BMIQ in correcting probe design bias and improving data quality.
Like SWAN and BMIQ, RCP uses quantile information to normalize type II probe measures toward comparable type I probe measures. SWAN assumes that type I and II probes have identical distributions across the entire genome if they share similar genomic context and adjusts the distributions of both sets of probes to match. This assumption may not hold given that the use of type I and II probes in the methylation array is non-random. SWAN normalization adversely alters type I data, resulting in increased type I probe technical variation, reduced concordance between duplicates (Table 1), and results in few validated differentially methylated sites (Table 2). RCP only assumes comparable quantiles between type I and II probes that are in close proximity and have the same genomic context. Like BMIQ, RCP leaves the values of type I probes unchanged. BMIQ utilizes a model-based approach, and assumes that methylation values from type I and II probes will fit a three-state beta-mixture distribution model. After finding the best fit for type I probes, it assumes the same model for type II probes, reassigning the quantiles of the type II probes according to the type I distribution. BMIQ model parameter estimation is computationally intensive (e.g. 500 sample processing time of 7.8 h for BMIQ versus 2.5 min for RCP with one CPU core) which may be problematic for large studies. Although the model works reasonably well for most data, it may not fit some experimental data, resulting in highly inaccurate adjustments that are much worse than raw data (Fig. 3). RCP is directly applicable to the new Illumina MethylationEPIC BeadChip and can be used with other preprocessing methods to improve data quality. It is incorporated as a user-selectable function into ENmix (Xu et al., 2015), a multiprocessor-capable R package that contains a suite of preprocessing, data quality, and visualization tools designed to facilitate large-scale analysis of methylation data.
5 Conclusions
RCP is a novel and computationally efficient method to correct probe type design bias for Illumina methylation BeadChips. It can significantly improve data quality for type II probes, resulting in increased precision and detection of true biological signals in DNA methylation analysis.
Supplementary Material
Funding
This work was supported by the Center for Environmental Genetics grant (National Institute of Environmental Health Sciences award P30ES00606) and Intramural Research Program of the NIH, National Institute of Environmental Health Sciences (Z01 ES049033, and Z01 ES049032).
Conflict of Interest: none declared.
References
- Bibikova M. et al. (2011) High density DNA methylation array with single CpG site resolution. Genomics, 98, 288–295. [DOI] [PubMed] [Google Scholar]
- Dedeurwaerder S. et al. (2011) Evaluation of the Infinium Methylation 450K technology. Epigenomics, 3, 771–784. [DOI] [PubMed] [Google Scholar]
- Eckhardt F. et al. (2006) DNA methylation profiling of human chromosomes 6, 20 and 22. Nat. Genet., 38, 1378–1385. [DOI] [PMC free article] [PubMed] [Google Scholar]
- Lechner M. et al. (2013) Identification and functional validation of HPV-mediated hypermethylation in head and neck squamous cell carcinoma. Genome Med., 5, 15. [DOI] [PMC free article] [PubMed] [Google Scholar]
- Maksimovic J. et al. (2012) SWAN: subset-quantile within array normalization for illumina infinium HumanMethylation450 BeadChips. Genome Biol., 13, R44. [DOI] [PMC free article] [PubMed] [Google Scholar]
- Markunas C.A. et al. (2014) Identification of DNA methylation changes in newborns related to maternal smoking during pregnancy. Environ. Health Persp., 122, 1147–1153. [DOI] [PMC free article] [PubMed] [Google Scholar]
- Smyth G.K. (2004) Linear models and empirical bayes methods for assessing differential expression in microarray experiments. Stat. Appl. Genet. Mol. Biol., 3, Article3. [DOI] [PubMed] [Google Scholar]
- Teschendorff A.E. et al. (2013) A beta-mixture quantile normalization method for correcting probe design bias in Illumina Infinium 450 k DNA methylation data. Bioinformatics, 29, 189–196. [DOI] [PMC free article] [PubMed] [Google Scholar]
- Xu Z. et al. (2013) Epigenome-wide association study of breast cancer using prospectively collected sister study samples. J. Natl. Cancer Inst., 105, 694–700. [DOI] [PMC free article] [PubMed] [Google Scholar]
- Xu Z. et al. (2015) ENmix: a novel background correction method for Illumina HumanMethylation450 BeadChip. Nucleic Acids Res., 44, e20. [DOI] [PMC free article] [PubMed] [Google Scholar]
- Zhang W. et al. (2015) Predicting genome-wide DNA methylation using methylation marks, genomic position, and DNA regulatory elements. Genome Biol., 16, 14. [DOI] [PMC free article] [PubMed] [Google Scholar]
Associated Data
This section collects any data citations, data availability statements, or supplementary materials included in this article.


