

Abstract
We studied the health of low-income US women affected by the largest social policy change in recent US history: the 1996 welfare reforms. Using the Behavioral Risk Factor Surveillance System (1993–2012), we performed 2 types of analysis. First, we used difference-in-difference-in-differences analyses to estimate associations between welfare reforms and health outcomes among the most affected women (single mothers aged 18–64 years in 1997; n = 219,469) compared with less affected women (married mothers, single nonmothers, and married nonmothers of the same age range in 1997; n = 2,422,265). We also used a synthetic control approach in which we constructed a more ideal control group for single mothers by weighting outcomes among the less affected groups to match pre-reform outcomes among single mothers. In both specifications, the group most affected by welfare reforms (single mothers) experienced worse health outcomes than comparison groups less affected by the reforms. For example, the reforms were associated with at least a 4.0-percentage-point increase in binge drinking (95% confidence interval: 0.9, 7.0) and a 2.4-percentage-point decrease in the probability of being able to afford medical care (95% confidence interval: 0.1, 4.8) after controlling for age, educational level, and health care insurance status. Although the reforms were applauded for reducing welfare dependency, they may have adversely affected health.
Keywords: health behaviors, health care utilization, self-rated health, single mothers, welfare reform
Editor's note:An invited commentary on this article appears on page 539, and the authors’ response appears on page 542.
The 2007 economic recession heightened discourse about how governments should respond to poverty (1). Declines in life expectancy over the past 2 decades among low-income white women in the United States suggest that conditions affecting the health of these women deteriorated substantially in the late 1990s and early 2000s (2, 3). In concert, mortality among low-income minority women in the United States remained as much as twice that of their peers in Western Europe (4).
In the present study, we examined how women were affected by one of the largest social policy changes in US history: the welfare reforms of 1996. The 1996 Personal Responsibility and Work Opportunity Act (PRWORA) eliminated the Assistance for Families With Dependent Children (AFDC) program, conventionally known as “welfare,” and replaced it with Temporary Assistance for Needy Families (TANF), which contained time limits, work requirements, and related restrictions (5). The reforms intended to shift poor single mothers “from welfare to work” (6) and had 3 main consequences: They induced the largest decline in participation in cash welfare programs in US history, shifted some individuals from long-term cash assistance to temporary assistance, and shifted other individuals to neither work nor government income assistance (7).
A claim emphasized during the 1996 reform debates was that the reforms would improve the lives of those affected (8, 9). Prior evaluations of these claims were generally focused on 4 outcomes: 1) fertility and marriage, 2) health insurance coverage (as Medicaid enrollment was previously tied to the AFDC program), 3) welfare caseloads, and 4) work participation (for detailed reviews, see Grogger et al. (7) and National Bureau of Economic Research (10)). Reforms were associated with negligible changes in fertility or marriage (11–14), small declines in overall health care insurance coverage (with some compensatory coverage for subpopulations eligible for private employer-based insurance and Medicaid expansions for parents (15–18)), and a large decline in welfare caseloads (10). Although PRWORA passed in 1996, states varied in their time of implementation, and some reforms were implemented through a series of waivers among individual states as far back as 1992 (Web Table 1, available at http://aje.oxfordjournals.org/) (7, 10). However, although labor force participation increased in general, not all individuals succeeded in transitioning to work. Approximately 32% of women who were previously on welfare disappeared from both welfare rolls and labor force registries (19), and in a 2002 paper, Blank observed that “we have little evidence on how these women are surviving” (10, p. 1119). Overall, median benefits distributed to a typical household of 3 fell from $480 per month to $379 per month (in year 2000 dollars), despite a drop in the overall number of beneficiaries (20). Because the AFDC program permitted entry into the Food Stamp Program (now the Supplemental Nutrition Assistance Program), food stamp use also fell, because eligible individuals were not enrolled automatically in all states (21), removing the other major source of cash-equivalent support. Participation of eligible persons in the Food Stamp Program fell from 78% to 62% nationally from 1995 to 1997, and further to 53% in 1999 (22).
Two countervailing theories are relevant to anticipating the potential health implications of the reforms. One theory emphasizes the health benefits of work and higher earnings (23–27). An alternative view suggests that the restrictions to safety net participation would produce negative stressors, inducing unhealthy choices (e.g., between reporting to work or seeking medical attention) (28, 29) or unhealthy behaviors for coping with stress (e.g., binge drinking) (30–32). In the present study, we tested our hypothesis that the negative consequences of PRWORA reforms on health offset the advantages of encouragement into work because of increased work-related stresses.
METHODS
Design overview
We tested our hypothesis by comparing nationally representative repeated cross-sectional data on the health of the principal population cohort previously eligible for the AFDC program with data from other similar population cohorts. We compared changes in health among single mothers (the “treatment group”) to simultaneous changes among married women with children, single women without children, and married women without children (populations used as “control groups” in the economics literature on PRWORA and labor participation (7, 33)). Although welfare participation among single mothers declined from approximately 33% to 7% because of the welfare reforms (34), less than 5% of married women with children, single women without children, or married women without children received welfare before or after the reforms (35). To compare the population-level associations between the welfare reforms and health in these populations, we first applied ordinary least squares regression in a difference-in-difference-in-differences (DDD) model. A DDD model controls for 3 types of unmeasured confounders: those that vary between types of people but are constant within a group of people over time (i.e., fundamental differences between single mothers and married mothers); those that vary over time but similarly between groups of people (e.g., changes in national medical treatment guidelines); and those that vary over time but may have affected health differentially among the groups (i.e., labor market opportunities) (36).
To address the main shortcoming of DDD models (that there is no single ideal control group for the most affected population cohort), we also used the novel method of synthetic control analysis (37), which applies weights among the control group populations (married women with children, single women without children, and married women without children) to construct a synthetic control population that mirrors the pre-reform characteristics of the treatment group (single mothers). This method provides an additional control for numerous unmeasured time-varying factors correlated with welfare reform that may have affected health differentially among the groups.
Data sources
We used data from the 1993–2012 waves of the Behavioral Risk Factor Surveillance System (BRFSS) (n = 5,951,982, of whom we studied the n = 2,641,934 women who were 18–64 years of age in 1997) (38). The BRFSS is a repeated cross-sectional telephone survey conducted annually and stratified to provide state- and nationally representative samples of the noninstitutionalized US adult population. BRFSS changed its weighting methodology in 2011; thus, we used a standard post-stratification reweighting method to allow for multiyear estimates, accounting for differential sampling of individuals with cellular phones over survey waves (39). Given that there was less than 5% missing data for all outcomes of interest, we performed only complete case analyses without imputation.
Outcome variables of interest
The extant literature suggests that welfare reforms might impact health through stress pathways (affecting mental health and stress-related health behaviors, such as tobacco smoking and alcohol abuse, by increasing stress related to the transition from long-term cash assistance to work, temporary assistance, or unemployment (40–44)), as well as by reducing access to health care, especially preventive or screening services (by affecting availability of time away from work, childcare to seek personal health care, and eligibility for health care insurance (45, 46)). Despite providing childcare block grants to states, welfare reforms were generally associated with lower availability of childcare (29).
We therefore focused on a few well-studied metrics associated with future morbidity and mortality that were measured consistently across survey waves and had high reliability and validity compared with direct physical measures (47–49). As defined in Table 1, these were tobacco smoking, binge alcohol consumption, days per month of self-rated good mental health, access to a regular doctor/clinic, inability to get medical care because of cost, routine Pap test for cervical cancer screening, and routine mammography for breast cancer screening. The included measures of health care access and preventive health care utilization have been related to morbidity and mortality among low-income populations in the United States (50–52). To reduce arbitrary variability around cutpoints (53), all metrics were scaled and ordered such that a value of zero would indicate the worst health outcome (e.g., no days per month of good mental health, smoking tobacco), whereas a value of one would indicate the best possible health outcome (e.g., having good mental health all month, not smoking tobacco). All coefficient estimates in the models below are therefore risk differences expressed as percentage-point changes in the risk of a health outcome. Table 1 provides summary statistics on each metric among the studied populations. Web Table 1 details the sample sizes across states and years among each studied population.
Table 1.
Definitions and Summary Statistics for the Health Outcomes Studied, Behavioral Risk Factor Surveillance System, 1993–2012a
| Health Metric | Definition | Intervention Group (Single Mothers), mean (SD) | Control Group |
|||
|---|---|---|---|---|---|---|
| Married Mothers, mean (SD) | Single Nonmothers, mean (SD) | Married Nonmothers, mean (SD) | Synthetic Control Group, mean (SD) | |||
| Pre-Reform Group, 1993–1996 | ||||||
| Binge alcohol drinking | Not drinking >30 drinks/month (1) or drinking >30 drinks/month (0) | 0.67 (0.47) | 0.76 (0.43) | 0.63 (0.48) | 0.82 (0.38) | 0.63 (0.48) |
| Smoking | Not smoking tobacco (1) or smoking (0) | 0.67 (0.47) | 0.73 (0.44) | 0.70 (0.46) | 0.73 (0.44) | 0.7 (0.46) |
| Days of good mental health | Fraction of days per month with good mental health | 0.85 (0.28) | 0.91 (0.22) | 0.89 (0.24) | 0.93 (0.21) | 0.89 (0.23) |
| Medical access | Access to a regular doctor or clinic (1) versus not (0) | 0.80 (0.39) | 0.87 (0.34) | 0.81 (0.39) | 0.89 (0.31) | 0.81 (0.39) |
| Able to afford doctor visit | Able to see a doctor despite cost for medical conditions (1) versus not (0) | 0.80 (0.40) | 0.87 (0.34) | 0.87 (0.34) | 0.92 (0.26) | 0.87 (0.34) |
| Pap test | Ever had a Pap screen (1) versus not (0) | 0.90 (0.41) | 0.98 (0.16) | 0.88 (0.32) | 0.96 (0.20) | 0.89 (0.29) |
| Mammogram | Ever had a mammogram (1) versus not (0) | 0.38 (0.49) | 0.45 (0.50) | 0.56 (0.50) | 0.75 (0.43) | 0.45 (0.5) |
| Post-Reform Group, 1997–2012 | ||||||
| Binge alcohol drinking | Not drinking >30 drinks/month (1) or drinking >30 drinks/month (0) | 0.60 (0.49) | 0.72 (0.45) | 0.63 (0.48) | 0.80 (0.40) | 0.63 (0.48) |
| Smoking | Not smoking tobacco (1) or smoking (0) | 0.69 (0.46) | 0.83 (0.38) | 0.75 (0.43) | 0.85 (0.35) | 0.75 (0.43) |
| Days of good mental health | Fraction of days per month with good mental health | 0.83 (0.30) | 0.90 (0.23) | 0.87 (0.27) | 0.92 (0.22) | 0.88 (0.25) |
| Medical access | Access to a regular doctor or clinic (1) versus not (0) | 0.66 (0.48) | 0.79 (0.40) | 0.76 (0.43) | 0.89 (0.32) | 0.76 (0.43) |
| Able to afford doctor visit | Able to see a doctor despite cost for medical conditions (1) versus not (0) | 0.76 (0.43) | 0.87 (0.34) | 0.86 (0.35) | 0.92 (0.27) | 0.87 (0.34) |
| Pap screen | Ever had a Pap screen (1) versus not (0) | 0.89 (0.31) | 0.98 (0.15) | 0.89 (0.31) | 0.97 (0.18) | 0.90 (0.28) |
| Mammogram | Ever had a mammogram (1) versus not (0) | 0.39 (0.49) | 0.47 (0.50) | 0.67 (0.47) | 0.84 (0.36) | 0.47 (0.5) |
Abbreviation: SD, standard deviation.
a The synthetic control group refers to a population constructed by weighting the other 3 control groups to match not only pre-intervention health outcome distributions but also characteristics among the intervention group, as described in the Methods section. Hence, the group is not simply designed to match the distribution of pre-intervention outcomes from the intervention group. All health metrics are scaled from 0 (worst score, e.g., tobacco smoking) to 1 (best score, e.g., not smoking). “Days of good mental health” refers to a survey question in which participants were asked how many days in the past 30 days they felt that they had good mental health; we expressed the outcome metric here as a fraction. Note that the group means and standard deviations presented here were calculated using survey sampling weights to account for differential probabilities of sampling and response among demographic groups but are not corrected for covariates or secular trends, whereas the estimates shown in Figures 1 and 2 include covariates and time trend corrections.
Model specification
DDD analysis
We contrasted health outcomes among the population cohort of single mothers aged 18–64 years in 1997 who would likely have been eligible for the AFDC program (n = 219,469) to outcomes among population cohorts of women in the same age group in 1997 who would likely not have been eligible (married mothers, n = 477,934; single nonmothers, n = 987,103; and married nonmothers, n = 957,428), using state of residence to incorporate the timing of implementation of TANF policies (Web Table 1). The same age range was not used for every survey year because we wished to track the population cohort of women who would have been most affected by the PRWORA reforms over time; thus, we studied 18–64-year-old women in 1997, 19–65-year-old women in 1998, and so on. Following prior assessments of other outcomes in the economics literature (7, 33, 36), our model took the following form:
| (1) |
where for individuals i who live in state s in calendar year t, Y represented the health outcome; Reform was an indicator variable for whether the woman lived in a state with a waiver or TANF in effect in year t (Web Table 2); Single was an indicator variable for whether the woman was single (1) or married (0); Child was an indicator variable for whether the women had a child (1) or not (0); and Z was a vector of control variables, including age, age squared, race/ethnicity (non-Hispanic white, non-Hispanic black, Hispanic, and other), educational level (less than high school or high school or greater), and health care insurance coverage status (insured or uninsured). We included state fixed effects (γs) to remove long-term state-specific differences, year fixed effects (γt) to remove common changes that occurred in all states in the same year (i.e., national tax credits, minimum wage changes), an interaction term between Single and Child to remove long-term differences unique to the population of single mothers, and interaction terms between Reform and Single and Reform and Child to remove unmeasured factors correlated to welfare reform (i.e., labor market conditions) that could affect health differently among the studied populations. The key DDD parameter is β7, which isolates the association between welfare reform and health specifically among single mothers as compared with all of the other groups, net of the control variables. In other words, this is an intention-to-treat analysis that does not provide the effect of removal from TANF on affected persons but rather studies the overall associations between welfare reform and health among the population of single mothers as compared with other groups.
Before model estimation, we tested all regressions for the following model assumptions: 1) that intervention and control groups shared common trends in the outcome slopes in pre-reform years and 2) that no deviations in the year before the reforms occurred as compared with previous years (which might indicate that the intervention group changed behavior in anticipation of the pending legislation). We additionally conducted subgroup analyses by employment status, expecting that the associations between welfare reforms and health would be strongest for the employed group who experienced work-related stressors.
For model estimation, we applied the svyset and subpop commands in Stata, version MP-13 (StataCorp LP, College Station, Texas) to account for differential sampling and nonresponse through the application of sampling weights. All models were estimated with robust standard errors to account for potential heteroscedasticity.
Synthetic control analysis
Even though the DDD model attempts to control both time-varying and time-invariant differences among the groups, it is limited by potential bias in the estimation of parameters that can result from serial autocorrelation, as well as from misestimation of secular trends when time series have few pre-intervention time periods (54). Hence, we repeated our analysis using synthetic control analysis (37), which constructs a statistical control group by weighting members of the available control groups to closely match the pre-reform health outcomes of the intervention group. As opposed to propensity score matching, which matches based on individual characteristics, the synthetic control approach also weights the control groups by pre-intervention health outcome metrics to match the pre-intervention health outcome trajectory of the treatment population (37).
Specifically, given treated group J = 1 (single mothers), J = 2 … N possible control groups (married mothers, single nonmothers, and married nonmothers), and yit as the outcome of the group i at time t, we wish to estimate which is the difference between the observed outcome in group 1 and a counterfactual outcome constructed from the other groups after the introduction of the policy. We choose weights wJ to minimize or the difference in observed outcomes between the treated and weighted control groups before the intervention, where xJ are observable characteristics predictive of the outcome (37). As shown in a formal proof (37), the factor-weighting method matches the time-varying pre-intervention exposed population's observed health outcomes, as well as a set of their time-varying observed covariates not affected by the intervention (e.g., distributions of demographic characteristics). Such pre-intervention can only occur if it also holds that time-varying unobserved confounders are equally distributed among the exposed and synthetic control groups. If the weighting method above produces a better match in observed outcomes between the treated and control group than does the DDD approach, the synthetic control method can be less biased even if the data are autocorrelated and only available for short pre-intervention periods (37).
The Stata package “synth” was used to perform the weighting. The predictors of each outcome included the level of each health outcome variable in each group J in the years before the PRWORA legislation (e.g., the rate of binge alcohol consumption in each group), age and age squared, race/ethnicity, educational level, and health care insurance status (55, 56). Table 1 details the results of the weighting process and the distribution of outcomes among the exposed population and the synthetic control group.
We also conducted a placebo analysis in which we estimated the change in health outcomes among each of the 3 control groups (married mothers, single nonmothers, and married nonmothers) when repeating the synthetic control analysis and treating each control population as if they were an intervention population—a falsification test to check for spurious associations between welfare reform and health outcomes.
RESULTS
DDD analysis
TANF reforms were associated with worsening of several health metrics among single mothers compared with changes in health outcomes among married mothers, single nonmothers, or married nonmothers, net of the covariates included in equation 1. As shown in Figure 1, the reforms were associated with a 4.0-percentage-point (absolute, not relative) increase in the probability of binge drinking among single mothers (95% confidence interval (CI): 0.9, 7.0, from a baseline probability of 33%), a 2.4-percentage-point decrease in the probability of being able to afford medical care among single mothers (95% CI: 0.1, 4.8, from a baseline probability of 80%), a 0.8-percentage-point decrease in the probability of cervical cancer screening among single mothers (95% CI: 0.6, 2.3, from a baseline probability of 90%), and a 0.8-percentage-point decrease in the probability of breast cancer screening among single mothers (95% CI: −2.8, 1.3, from a baseline probability of 38%). The associations of welfare reforms with tobacco smoking, mental health, and access to medical services among single mothers were also negative, but with wide confidence intervals that included both harmful and slightly beneficial coefficients (Figure 1).
Figure 1.
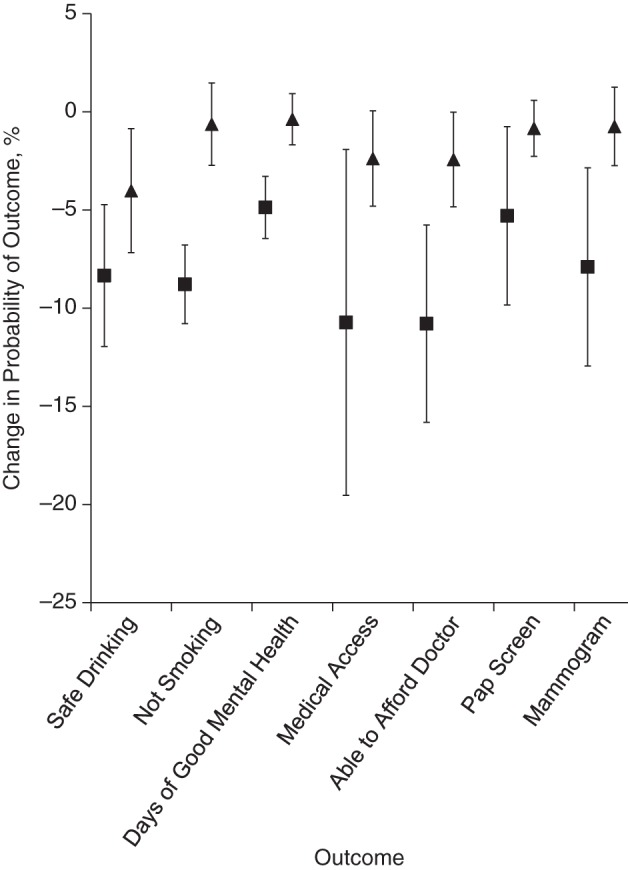
Welfare reforms and health outcomes among single mothers in the Behavioral Risk Factor Surveillance System, 1993–2012. The Figure presents the estimated percentage-point change in health status of single mothers associated with the 1996 welfare reforms using both a difference-in-difference-in-differences model (triangles) and a synthetic control estimation method (squares). The difference-in-difference-in-differences model expressed in equation 1 corrects for pre-existing secular trends in health, as well as unmeasured time-invariant and time-varying confounders between the single mothers and “control” groups (married mothers, single nonmothers, and married nonmothers). The synthetic control method compares single mothers with a control group constructed by weighting members of the less affected groups (married mothers, single nonmothers, and married nonmothers) to better match the health characteristics of single mothers prior to welfare reforms in order to strengthen the quality of inferences when there is no single ideal control group. The y-axis reflects a percent change in probability of a health outcome; negative results reflect worsening health; that is, single mothers experienced a 4-percentage-point (absolute, not relative change) lower chance of safe alcohol drinking in association with the welfare reforms, per the difference-in-difference-in-difference model. Outcomes are defined in Table 1. See Web Table 4 for coefficients. Bars, 95% confidence intervals.
Results from our subgroup analysis, however, did not support our a priori stress-based hypothesis that the associations between the welfare reforms and health would be strongest among the employed group. As shown in Figure 2, the results were mixed between the unemployed and employed groups; overall, the unemployed group experienced more consistently worse health outcomes, although the confidence intervals of the association between welfare reform and health outcomes overlapped between the unemployed and employed groups.
Figure 2.
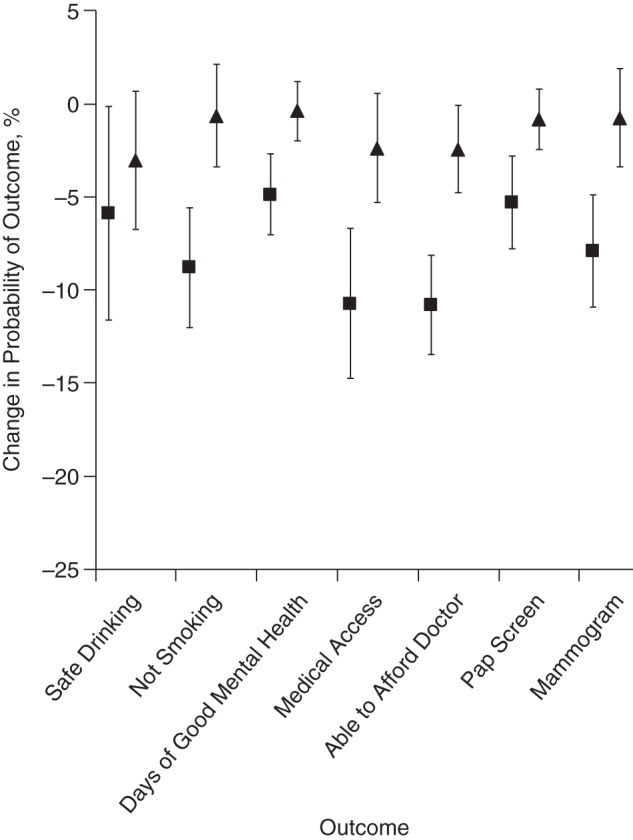
Welfare reforms and health outcomes among employed (triangles) and unemployed (squares) single mothers in the Behavioral Risk Factor Surveillance System, 1993–2012. Data are based on difference-in-difference-in-differences specifications. The Figure presents the estimated association between the 1996 welfare reforms and the change in health status of single mothers by employment status, using a difference-in-difference-in-differences model. The difference-in-difference-in-differences model expressed in equation 1 corrects for pre-existing secular trends in health, as well as unmeasured time-invariant and time-varying confounders between the single mothers and “control” groups (married mothers, single nonmothers, and married nonmothers). The y-axis reflects a percent change in the probability of a health outcome; negative results reflect worsening health; that is, employed single mothers experienced a 3-percentage-point (absolute, not relative) lower chance of safe alcohol drinking in association with the welfare reforms. Outcomes are defined in Table 1. See Web Table 5 for coefficients. Bars, 95% confidence intervals.
Synthetic control analysis
Using the synthetic control method, we found that the associations between welfare reform and health outcomes analysis were in the same direction as the standard DDD estimates (i.e., associations between the welfare reforms and worse health outcomes). However, as shown in Figure 1, the synthetic control method estimated larger associations between the welfare reforms and the health outcomes, which suggests that the limitations of the DDD model (bias towards the null) might have blunted the estimated associations between reforms and some adverse health outcomes in the standard DDD analysis as compared with the synthetic control analysis. In particular, the largest differences between the DDD model and the synthetic control estimates were for the associations between welfare reforms and 3 outcomes: tobacco smoking, access to medical care, and ability to afford medical care. Using the synthetic control model, welfare reform was associated with a 8.8-percentage-point increase in the probability of tobacco smoking among single mothers (95% CI: 6.8, 10.8, compared with a DDD estimate of 0.6), a 10.7-percentage-point decrease in the probability of having access to medical care among single mothers (95% CI: 1.9, 19.5, compared with a DDD estimate of 2.4), and a 10.8-percentage-point decrease in the probability of being able to afford medical care among single mothers (95% CI: 5.7, 15.8, compared with a DDD estimate of 2.4; Figure 1). The synthetic control estimates were found to be robust in placebo analysis, which suggests that the observed coefficient estimates from the synthetic control model were unlikely to be due to chance (Web Table 3).
DISCUSSION
The largest set of welfare reforms in US history, the reforms of the mid-1990s, have generally been viewed as successfully shifting persons from welfare to work and increasing incomes (12). In the present study, we found generally adverse associations between the reforms and health outcomes when using multiple analytic approaches. The reforms were most consistently associated with increases in binge drinking and decreases in medical access and preventive health care utilization among single mothers as compared with less affected women. Our findings are consistent with concerns that the reforms may have increased stressors (financial, time-related, and psychological) associated with poor health outcomes (57). Results from our subgroup analysis by employment status were consistent with the theory that exclusion from work and work-related income could have been as much a determinant of health effects of welfare reforms as was work-related stress (40). Alternatively, because women who did not find work experienced worse outcomes (except for access to medical care) than did those who found work, those who found work may have remained in good health except for the challenge of fitting in medical visits around work schedules, whereas those who remained unemployed may be a particularly negatively selected group of mothers manifesting the poorest behavioral and mental health features.
Unlike in prior econometric assessments, our use of synthetic control methods allows us to generate a more ideal control group than is typically available for assessments of welfare policies, given that there is no natural control group for the most affected population. Our results from the synthetic control analysis were generally stronger (showing more adverse associations with welfare reforms) than those from a more classic DDD model; the latter is known to be potentially biased when time trends are affected by serial autocorrelation, as is the case with many health measures (54). Notably, our results were also based on a long-term analysis of a reform that occurred nearly a decade ago. The economic expansion in the later years of Bill Clinton's presidency might have masked the (potential) deleterious impacts of welfare reforms over the short-term, whereas our longer follow-up periods offer more insight into complex long-term effects. Furthermore, the findings were based on models that incorporated health care insurance status as a control variable, which suggests that insurance could not fully explain the findings.
The design and measurement challenges of providing rigorous effect estimates of large-scale social reforms shaped aspects of our study but entailed some limitations. First, our coefficients represent the average association after 1997 and therefore cannot address short-term (i.e., 1998) versus long-term (i.e., 2012) responses to welfare reform. Not knowing exactly which women participated in the AFDC program and were no longer in the TANF program means principally that we cannot know for certain that other large federal policy changes implemented simultaneously with PRWORA did not explain the associations we observed. Second, our choice of the BRFSS data set provides us with large-scale data from a nationally representative sample, yet it has only 3 years of data collected before the policy change compared with 16 years of data collected after. Because it is a telephone survey, it also may not reach the most affected populations. The BRFSS also lacks consistent details about work conditions (i.e., part time versus full time employment), age of children, and income sources, providing limited insights into the mechanistic pathways linking welfare reform to health outcomes. Further analysis of longitudinal data might assist in overcoming these limitations. Longitudinal follow-up studies of randomized cash assistance reform trials have suggested that mortality may increase from specific PRWORA-like work provisions, but these studies tested welfare changes that differed from the final PRWORA reforms instituted nationwide (58).
No single study can conclusively establish the overall health consequences of PRWORA. Our study suggests that PRWORA reforms may have harmed some aspects of the health of women affected by them, despite economic benefits from the program. Further insights are needed into which elements of work-generating and income-generating programs are indeed “healthy” and which may be detrimental to health, particularly when administered through large federal programs that are the major safety net for vulnerable populations.
Supplementary Material
ACKNOWLEDGMENTS
Author affiliations: Center on Poverty and Inequality, Stanford University, Stanford, California (Sanjay Basu); Institute for Economic Policy Research, Stanford University, Stanford, California (Sanjay Basu); Centers for Health Policy, Primary Care, and Outcomes Research, Stanford University, Stanford, California (Sanjay Basu); and Prevention Research Center, Department of Medicine, Stanford University, Stanford, California (Sanjay Basu); Department of Public Health and Policy, London School of Hygiene and Tropical Medicine, London, United Kingdom (Sanjay Basu); Division of General Medical Disciplines, Department of Medicine, Stanford University, Stanford, California (David H. Rehkopf); Department of Epidemiology, Dalla Lana School of Public Health, University of Toronto, Toronto, Canada (Arjumand Siddiqi); Department of Social and Behavioral Sciences, Dalla Lana School of Public Health, University of Toronto, Toronto, Canada (Arjumand Siddiqi); Department of Health Behavior, Gillings School of Global Public Health, University of North Carolina Chapel Hill, Chapel Hill, North Carolina (Arjumand Siddiqi); Department of Epidemiology and Biostatistics, University of California San Francisco, San Francisco, California (M. Maria Glymour); and Department of Social and Behavioral Sciences, Harvard School of Public Health, Boston, Massachusetts (Ichiro Kawachi).
Research reported in this publication was supported by the National Institute on Minority Health and Health Disparities of the National Institutes of Health under award number DP2MD010478.
The content is solely the responsibility of the authors and does not necessarily represent the official views of the National Institutes of Health.
Conflict of interest: none declared.
REFERENCES
- 1.Piketty T, Saez E. Inequality in the long run. Science. 2014;3446186:838–843. [DOI] [PubMed] [Google Scholar]
- 2.Meara ER, Richards S, Cutler DM. The gap gets bigger: changes in mortality and life expectancy, by education, 1981–2000. Health Aff (Millwood). 2008;272:350–360. [DOI] [PMC free article] [PubMed] [Google Scholar]
- 3.Olshansky SJ, Passaro DJ, Hershow RC et al. A potential decline in life expectancy in the United States in the 21st century. N Engl J Med. 2005;35211:1138–1145. [DOI] [PubMed] [Google Scholar]
- 4.Cohen B, Preston SH, Crimmins EM et al. Explaining Divergent Levels of Longevity in High-Income Countries. Washington, DC: National Academies Press; 2011. [PubMed] [Google Scholar]
- 5.Solow RM. Work and Welfare. Princeton, NJ: Princeton University Press; 2009. [Google Scholar]
- 6.Gueron JM, Pauly E. From Welfare to Work. New York, NY: Russell Sage Foundation; 1991. [Google Scholar]
- 7.Grogger J, Karoly LA, Klerman JA. Consequences of Welfare Reform: a Research Synthesis. Santa Monica, CA: The RAND Corporation; 2002. http://www.rand.org/pubs/drafts/DRU2676.html Accessed October 24, 2014. [Google Scholar]
- 8.Haskins R. Liberal and conservative influences on the welfare reform legislation of 1996. In: Chase-Lansdale PL, Duncan GJ, eds. For Better or for Worse: Welfare Reform and Children's Well-being. New York, NY: Russell Sage Foundation; 2001:9–34. [Google Scholar]
- 9. Urban Institute. Does work pay? An analysis of the work incentives under TANF. http://webarchive.urban.org/publications/308033.html Published July 1, 1998. Updated October 24, 2014. Accessed October 24, 2014.
- 10. National Bureau of Economic Research. Evaluating Welfare Reform in the United States. Cambridge, MA: National Bureau of Economic Research; 2002. http://www.nber.org/papers/w8983 Published June 2002. Accessed October 24, 2014. [Google Scholar]
- 11. National Bureau of Economic Research. What Has Welfare Reform Accomplished? Impacts on Welfare Participation, Employment, Income, Poverty, and Family Structure. Cambridge, MA: National Bureau of Economic Research; 2000. http://www.nber.org/papers/w7627 Published March 2000. Accessed October 24, 2014. [Google Scholar]
- 12.Kaushal N, Kaestner R. From welfare to work: Has welfare reform worked? J Policy Anal Manage. 2001;204:699–719. [Google Scholar]
- 13. National Bureau of Economic Research. The impact of social policy and Economic Activity Throughout the Fertility Decision Tree. Cambridge, MA: National Bureau of Economic Research; 2002. http://www.nber.org/papers/w9021 Published June 2002. Accessed October 24, 2014. [Google Scholar]
- 14.Kearney MS. Is there an effect of incremental welfare benefits on fertility behavior? A look at the family cap. J Hum Resour. 2004;392:295–325. [Google Scholar]
- 15. National Bureau of Economic Research. Parental Medicaid Expansions and Health Insurance Coverage. Cambridge, MA: National Bureau of Economic Research; 2003. http://www.nber.org/papers/w9907 Published August 2003. Accessed October 24, 2014. [Google Scholar]
- 16.Borjas GJ. Welfare reform, labor supply, and health insurance in the immigrant population. J Health Econ. 2003;226:933–958. [DOI] [PubMed] [Google Scholar]
- 17.Kaestner R, Kaushal N. Welfare reform and health insurance coverage of low-income families. J Health Econ. 2003;226:959–981. [DOI] [PubMed] [Google Scholar]
- 18.Bitler MP, Gelbach JB, Hoynes HW. Welfare reform and health. J Hum Resour. 2005;402:309–334. [Google Scholar]
- 19. Urban Institute. Where Are They Now? What States’ Studies of People Who Left Welfare Tell Us. Washington, DC: Urban Institute; 1999. http://webarchive.urban.org/publications/309065.html Published May 1, 1999. Accessed May 20, 2015. [Google Scholar]
- 20. National Bureau of Economic Research. The Clinton Legacy for America's Poor. Cambridge, MA: National Bureau of Economic Research; 2001. http://www.nber.org/papers/w8437 Published August 2001. Accessed October 24, 2014. [Google Scholar]
- 21. Urban Institute. Former welfare families continue to leave the food stamp program. http://www.urban.org/publications/310288.html Published April 1, 2001. Accessed October 24, 2014.
- 22. Economic Research Service. Supplemental Nutrition Assistance Program (SNAP) Data System. Beltsville, MD: USDA; 2013. [Google Scholar]
- 23.Pritchett L, Summers LH. Wealthier is healthier. J Hum Resour. 1996;314:841–868. [Google Scholar]
- 24.Kessler RC, Turner JB, House JS. Unemployment, reemployment, and emotional functioning in a community sample. Am Sociol Rev. 1989;544:648–657. [Google Scholar]
- 25.Dooley D, Fielding J, Levi L. Health and unemployment. Annu Rev Public Health. 1996;17:449–465. [DOI] [PubMed] [Google Scholar]
- 26.Artazcoz L, Benach J, Borrell C et al. Unemployment and mental health: understanding the interactions among gender, family roles, and social class. Am J Public Health. 2004;941:82–88. [DOI] [PMC free article] [PubMed] [Google Scholar]
- 27.Ross CE, Mirowsky J. Does employment affect health? J Health Soc Behav. 1995;363:230–243. [PubMed] [Google Scholar]
- 28.Heymann J. Forgotten Families: Ending the Growing Crisis Confronting Children and Working Parents in the Global Economy. New York, NY: Oxford University Press; 2006. [Google Scholar]
- 29.Heymann SJ, Earle A. The impact of welfare reform on parents’ ability to care for their children's health. Am J Public Health. 1999;894:502–505. [DOI] [PMC free article] [PubMed] [Google Scholar]
- 30.Mullainathan S, Shafir E. Scarcity: Why Having too Little Means so Much. New York, NY: Times Books; 2013. [Google Scholar]
- 31.Zwane AP. Implications of scarcity. Science. 2012;3386107:617–618. [DOI] [PubMed] [Google Scholar]
- 32.Jencks C, Swingle J. Without a net. Am Prospect. 2000;114:37–41. [Google Scholar]
- 33.Moffitt RA, others. Welfare, the Family, and Reproductive Behavior: Research Perspectives. Washington, DC: National Academies Press; 1998. [PubMed] [Google Scholar]
- 34. Federal Reserve Bank of San Francisco. Did Welfare Reform Work for Everyone? A Look at Young Single Mothers. San Francisco, CA: Federal Reserve Bank of San Francisco; 2009. [Google Scholar]
- 35.Falk G. Temporary Assistance for Needy Families (TANF): Size and Characteristics of the Cash Assistance Caseload. Washington, DC: Congressional Research Service; 2014. [Google Scholar]
- 36.Kaushal N, Gao Q, Waldfogel J. Welfare reform and family expenditures: How are single mothers adapting to the new welfare and work regime? Soc Serv Rev. 2007;813:369–396. [Google Scholar]
- 37.Abadie A, Diamond A, Hainmueller J. Synthetic control methods for comparative case studies: estimating the effect of California's tobacco control program. J Am Stat Assoc. 2010;105490:493–505. [Google Scholar]
- 38. CDC. Behavioral Risk Factor Surveillance System (BRFSS). Atlanta, GA: CDC; 2014. [Google Scholar]
- 39. Health Indicators Warehouse. Fair or Poor Health: Adults. Washington, DC: Department of Health and Human Services; 2014. [Google Scholar]
- 40.Riumallo-Herl C, Basu S, Stuckler D et al. Job loss, wealth and depression during the Great Recession in the USA and Europe. Int J Epidemiol. 2014;435:1508–1517. [DOI] [PMC free article] [PubMed] [Google Scholar]
- 41.Harhay MO, Bor J, Basu S et al. Differential impact of the economic recession on alcohol use among white British adults, 2004–2010. Eur J Public Health. 2014;243:410–415. [DOI] [PubMed] [Google Scholar]
- 42.Stuckler D, Basu S, Suhrcke M et al. The public health effect of economic crises and alternative policy responses in Europe: an empirical analysis. Lancet. 2009;3749686:315–323. [DOI] [PubMed] [Google Scholar]
- 43.Stuckler D, Basu S, Suhrcke M et al. Effects of the 2008 recession on health: a first look at European data. Lancet. 2011;3789786:124–125. [DOI] [PubMed] [Google Scholar]
- 44.Reeves A, Stuckler D, McKee M et al. Increase in state suicide rates in the USA during economic recession. Lancet. 2012;3809856:1813–1814. [DOI] [PubMed] [Google Scholar]
- 45.Duncan GJ, Brooks-Gunn J. Family poverty, welfare reform, and child development. Child Dev. 2000;711:188–196. [DOI] [PubMed] [Google Scholar]
- 46.Lundberg O, Yngwe MÅ, Stjärne MK et al. The role of welfare state principles and generosity in social policy programmes for public health: an international comparative study. Lancet. 2008;3729650:1633–1640. [DOI] [PubMed] [Google Scholar]
- 47.Nelson DE, Holtzman D, Bolen J et al. Reliability and validity of measures from the Behavioral Risk Factor Surveillance System (BRFSS). Soz Praventivmed. 2000;46(Suppl 1):S3–S42. [PubMed] [Google Scholar]
- 48.Pierannunzi C, Hu SS, Balluz L. A systematic review of publications assessing reliability and validity of the Behavioral Risk Factor Surveillance System (BRFSS), 2004–2011. BMC Med Res Methodol. 2013;13:49. [DOI] [PMC free article] [PubMed] [Google Scholar]
- 49.Idler EL, Benyamini Y. Self-rated health and mortality: a review of twenty-seven community studies. J Health Soc Behav. 1997;381:21–37. [PubMed] [Google Scholar]
- 50.Akers AY, Newmann SJ, Smith JS. Factors underlying disparities in cervical cancer incidence, screening, and treatment in the United States. Curr Probl Cancer. 2007;313:157–181. [DOI] [PubMed] [Google Scholar]
- 51.Berry DA, Cronin KA, Plevritis SK et al. Effect of screening and adjuvant therapy on mortality from breast cancer. N Engl J Med. 2005;35317:1784–1792. [DOI] [PubMed] [Google Scholar]
- 52.Sommers BD, Baicker K, Epstein AM. Mortality and access to care among adults after state Medicaid expansions. N Engl J Med. 2012;36711:1025–1034. [DOI] [PubMed] [Google Scholar]
- 53.Salomon JA, Nordhagen S, Oza S et al. Are Americans feeling less healthy? The puzzle of trends in self-rated health. Am J Epidemiol. 2009;1703:343–351. [DOI] [PMC free article] [PubMed] [Google Scholar]
- 54.Bertrand M, Duflo E, Mullainathan S. How much should we trust differences-in-differences estimates? Q J Econ. 2004;1191:249–275. [Google Scholar]
- 55. Bureau of Labor Statistics. Local Area Unemployment Statistics (LAUS). Washington, DC: BLS; 2014. [Google Scholar]
- 56. Centers for Medicare & Medicaid Services. State Medicaid and CHIP Income Eligibility Standards. Washington, DC: CMS; 2014. [Google Scholar]
- 57.Morris PA. Welfare program implementation and parents’ depression. Soc Serv Rev. 2008;824:579–614. [DOI] [PMC free article] [PubMed] [Google Scholar]
- 58.Muennig P, Rosen Z, Wilde ET. Welfare programs that target workforce participation may negatively affect mortality. Health Aff (Millwood). 2013;326:1072–1077. [DOI] [PubMed] [Google Scholar]
Associated Data
This section collects any data citations, data availability statements, or supplementary materials included in this article.