

Vos et al. compare the prevalence and prognosis of Alzheimer’s disease at the mild cognitive impairment stage based on the IWG-1, IWG-2 and NIA-AA criteria. All three aid identification of early Alzheimer’s disease, but combining amyloid and neuronal injury markers according to the NIA-AA criteria offers the most accurate prognosis.
Keywords: Alzheimer’s disease, MCI, biomarkers, diagnostic criteria, prognosis
Vos et al. compare the prevalence and prognosis of Alzheimer’s disease at the mild cognitive impairment stage based on the IWG-1, IWG-2 and NIA-AA criteria. All three aid identification of early Alzheimer’s disease, but combining amyloid and neuronal injury markers according to the NIA-AA criteria offers the most accurate prognosis.
Abstract
Three sets of research criteria are available for diagnosis of Alzheimer’s disease in subjects with mild cognitive impairment: the International Working Group-1, International Working Group-2, and National Institute of Aging-Alzheimer Association criteria. We compared the prevalence and prognosis of Alzheimer’s disease at the mild cognitive impairment stage according to these criteria. Subjects with mild cognitive impairment (n = 1607), 766 of whom had both amyloid and neuronal injury markers, were recruited from 13 cohorts. We used cognitive test performance and available biomarkers to classify subjects as prodromal Alzheimer’s disease according to International Working Group-1 and International Working Group-2 criteria and in the high Alzheimer’s disease likelihood group, conflicting biomarker groups (isolated amyloid pathology or suspected non-Alzheimer pathophysiology), and low Alzheimer’s disease likelihood group according to the National Institute of Ageing-Alzheimer Association criteria. Outcome measures were the proportion of subjects with Alzheimer’s disease at the mild cognitive impairment stage and progression to Alzheimer’s disease-type dementia. We performed survival analyses using Cox proportional hazards models. According to the International Working Group-1 criteria, 850 (53%) subjects had prodromal Alzheimer’s disease. Their 3-year progression rate to Alzheimer’s disease-type dementia was 50% compared to 21% for subjects without prodromal Alzheimer’s disease. According to the International Working Group-2 criteria, 308 (40%) subjects had prodromal Alzheimer’s disease. Their 3-year progression rate to Alzheimer’s disease-type dementia was 61% compared to 22% for subjects without prodromal Alzheimer’s disease. According to the National Institute of Ageing-Alzheimer Association criteria, 353 (46%) subjects were in the high Alzheimer’s disease likelihood group, 49 (6%) in the isolated amyloid pathology group, 220 (29%) in the suspected non-Alzheimer pathophysiology group, and 144 (19%) in the low Alzheimer’s disease likelihood group. The 3-year progression rate to Alzheimer’s disease-type dementia was 59% in the high Alzheimer’s disease likelihood group, 22% in the isolated amyloid pathology group, 24% in the suspected non-Alzheimer pathophysiology group, and 5% in the low Alzheimer’s disease likelihood group. Our findings support the use of the proposed research criteria to identify Alzheimer’s disease at the mild cognitive impairment stage. In clinical settings, the use of both amyloid and neuronal injury markers as proposed by the National Institute of Ageing-Alzheimer Association criteria offers the most accurate prognosis. For clinical trials, selection of subjects in the National Institute of Ageing-Alzheimer Association high Alzheimer’s disease likelihood group or the International Working Group-2 prodromal Alzheimer’s disease group could be considered.
Introduction
In recent years three sets of research criteria for diagnosis of Alzheimer’s disease in subjects with mild cognitive impairment (MCI) have been proposed: the International Working Group (IWG)-1 (Dubois et al., 2007, 2010), IWG-2 (Dubois et al., 2014), and National Institute of Ageing-Alzheimer Association (NIA-AA) criteria (Albert et al., 2011). The criteria include biomarkers of Alzheimer’s disease pathology to increase the confidence that subjects with MCI have Alzheimer’s disease as underlying cause. However, they differ in the definition of MCI and biomarker abnormality (Visser et al., 2012) (Table 1). A direct comparison between the criteria is lacking and it remains unclear which criteria are best to use.
Table 1.
Classification according to the IWG-1, IWG-2 and NIA-AA criteria
| Criteria | Definition |
|---|---|
| IWG-1 (2007) | |
| No prodromal Alzheimer’s disease | No memory impairment or normal biomarkers |
| Prodromal Alzheimer’s disease | Memory impairment, at least one abnormal Alzheimer’s disease biomarker |
| IWG-2 (2014) | |
| No prodromal Alzheimer’s disease | Any cognitive impairment, normal CSF amyloid-β1-42 and/or tau or normal amyloid PET scana |
| Prodromal Alzheimer’s disease | Any cognitive impairment, abnormal CSF amyloid-β1-42 and tau or abnormal amyloid PET scana |
| NIA-AA (2011) | |
| Low Alzheimer’s disease likelihood group | Any cognitive impairment, normal amyloid and neuronal injury markers |
| High Alzheimer’s disease likelihood group | Any cognitive impairment, abnormal amyloid and neuronal injury markers |
| Conflicting IAP group | Any cognitive impairment, abnormal amyloid and normal neuronal injury marker |
| Conflicting SNAP group | Any cognitive impairment, normal amyloid and abnormal neuronal injury marker |
| Intermediate Alzheimer’s disease likelihood group | Any cognitive impairment, one marker testedb and abnormal |
| Inconclusive/uninformative group | Any cognitive impairment, one marker testedb and normal |
Amyloid marker = CSF amyloid-β1-42; neuronal injury marker = CSF tau/medial temporal lobe atrophy score/hippocampal volume/FDG-PET, cognitive impairment is defined as Z-score < −1.5.
aIn our study, CSF data are used for subject classification.
bIn our study, only neuronal injury markers were tested.
The IWG criteria use the term prodromal Alzheimer’s disease for diagnosis of Alzheimer’s disease and were designed to serve as research criteria. The IWG-1 criteria require episodic memory impairment and at least one abnormal Alzheimer’s disease biomarker. This biomarker can be a topographical marker [i.e. medial temporal lobe atrophy on MRI or parieto-temporal hypoperfusion on 18F-fluorodeoxyglucose (FDG)-PET] or a pathophysiological marker (i.e. decreased CSF amyloid-β1-42, increased CSF tau, or increased amyloid PET uptake) (Dubois et al., 2007, 2010). The updated IWG-2 criteria require cognitive impairment in any cognitive domain and either both decreased CSF amyloid-β1-42 and increased tau, or increased amyloid PET uptake (Dubois et al., 2014). These criteria specify two subtypes: typical prodromal Alzheimer’s disease if impairment on a memory test is present; and atypical prodromal Alzheimer’s if only impairment on a non-memory test is present. The NIA-AA criteria use the term ‘mild cognitive impairment due to Alzheimer’s disease’ and were designed for both clinical and research use. They require cognitive impairment in any cognitive domain and abnormal amyloid markers (i.e. decreased CSF amyloid-β1-42 or increased amyloid PET uptake) or neuronal injury markers (i.e. medial temporal lobe atrophy on MRI, increased CSF tau, or parietotemporal hypoperfusion on FDG-PET). They relate the number of abnormal biomarkers to the likelihood that MCI is due to Alzheimer’s disease (Albert et al., 2011) (Table 1).
Preliminary studies have shown that the IWG-1 and NIA-AA criteria have a fair to good predictive ability for progression to Alzheimer’s disease-type dementia in subjects with MCI (Bouwman et al., 2010; Oksengard et al., 2010; Petersen et al., 2013; Prestia et al., 2013). The validity of the IWG-2 criteria has not yet been tested. The aim of the present study is to compare the IWG-1, IWG-2 and NIA-AA criteria on prevalence and outcome of Alzheimer’s disease at the MCI stage by means of a large multicentre study.
Material and methods
Subjects
Subjects were recruited from five multicentre studies: DESCRIPA (Visser et al., 2008), AddNeuroMed (Lovestone et al., 2009), German Dementia Competence Network (DCN; Kornhuber et al., 2009), the European Alzheimer’s Disease Consortium (EADC)-PET (Morbelli et al., 2012), and American Alzheimer’s Disease Neuroimaging Initiative (ADNI-1) study (Mueller et al., 2005; Supplementary material); and from eight centres of the EADC: Amsterdam (van der Flier et al., 2014), Antwerp (Van der Mussele et al., 2014), Brescia (Frisoni et al., 2009), Coimbra (Baldeiras et al., 2008), Gothenburg (Eckerström et al., 2010), Kuopio (Seppälä et al., 2011), Liège (Bastin et al., 2010), and Lisbon (Maroco et al., 2011). If a subject participated in more than one study, we used data from the study with the longest follow-up.
Inclusion criteria of the present study were diagnosis of MCI, availability of at least one of the following biomarkers: amyloid-β1-42 and tau in CSF, qualitative or quantitative measures of medial temporal lobe atrophy on MRI [visual rating scale (medial temporal lobe atrophy score) or hippocampal volume], or cerebral glucose metabolism on brain FDG-PET; and at least one clinical follow-up assessment. Exclusion criteria were diagnosis of dementia at baseline or any other vascular, somatic, psychiatric or neurological disorder that might have caused the cognitive impairment.
Clinical assessment
Clinical assessment was performed according to the routine protocol at each site, including a clinical interview, Mini-Mental State Examination scoring, and neuropsychological assessment. Baseline diagnosis of MCI was made according to the criteria of Petersen et al. (2004). Raw scores on neuropsychological tests were converted to Z-scores at each centre. Cognitive impairment was defined as Z-score < −1.5 standard deviation (SD) on at least one cognitive test (Supplementary Table 1). Subjects with a Z-score < −1.5 SD on a memory test were classified as having amnestic MCI. Subjects with a Z-score < −1.5 SD on a non-memory test only were classified as having non-amnestic MCI.
Primary outcome measures were the proportion of subjects with Alzheimer’s disease at the MCI stage based on the IWG-1, IWG-2 and NIA-AA criteria and progression to Alzheimer’s disease-type dementia according to the Diagnostic and Statistical Manual of Mental Disorders, Fourth Edition (APA, 1994) and National Institute of Neurological and Communicative Disorders and Stroke - Alzheimer’s Disease and Related Disorders Association criteria (McKhann et al., 1984). Secondary outcome measure was cognitive decline on the Mini-Mental State Examination.
The medical ethics committee at each centre approved the study. All subjects provided informed consent.
Biomarker assessment
Biomarker assessment was performed according to the routine protocol at each site. PET scans were rated centrally. We used centre-specific cut-offs to define abnormal biomarkers (Supplementary Table 2). Visual assessments of medial temporal lobe atrophy on MRI and cerebral glucose metabolism on FDG-PET were performed by experienced clinicians who were blinded to clinical and CSF biomarker data.
Subject classification
According to the IWG-1 criteria, subjects were classified as ‘prodromal Alzheimer’s disease’ if they had episodic memory impairment and at least one abnormal biomarker. This could be a topographical or pathophysiological marker (Table 1). Although the IWG-1 criteria recommended a cued recall test to define memory impairment, such tests were not available for most studies and we used non-cued memory tests as well. According to the IWG-1 update of 2010, we defined atypical prodromal Alzheimer’s disease as non-amnestic MCI with abnormal biomarkers in a post hoc analysis.
According to the IWG-2 criteria, subjects were classified as ‘prodromal Alzheimer’s disease’ if they had impairment in memory (typical prodromal Alzheimer’s disease) or non-memory domains (atypical prodromal Alzheimer’s disease) and abnormal CSF amyloid-β1-42 and tau biomarkers (Table 1). In the main analysis we pooled typical and atypical prodromal Alzheimer’s disease but we also performed analyses for each subgroup separately.
According to the NIA-AA criteria, we distinguished between amyloid (i.e. CSF amyloid-β1-42) and neuronal injury markers (i.e. CSF tau, cerebral glucose metabolism on FDG-PET, medial temporal lobe atrophy score or hippocampal volume). Subjects with MCI in any domain were classified in the low Alzheimer’s disease likelihood group if both amyloid and neuronal injury markers were normal, in the high Alzheimer’s disease likelihood group if amyloid and at least one neuronal injury marker were abnormal, and in one of the two conflicting biomarker groups if the amyloid marker was abnormal and neuronal injury markers normal [isolated amyloid pathology group (IAP)] or if at least one neuronal injury marker was abnormal and the amyloid marker normal [suspected non-Alzheimer pathophysiology group (SNAP)] (Jack et al., 2012; Petersen et al., 2013; Vos et al., 2013a). Of the subjects who had only one biomarker available, subjects were classified in the intermediate Alzheimer’s disease likelihood group if the marker that was tested was abnormal and in the uninformative/inconclusive group if the marker was tested normal (Table 1).
Statistical analyses
Statistical analyses were done with SPSS version 20.0 with significance set at P < 0.05. Baseline differences between the biomarker subgroups were analysed using ANOVA for continuous variables and χ2 tests or logistic regression models for categorical variables. Cox proportional hazards models were used to test the predictive ability for Alzheimer’s disease-type dementia. The relation of the criteria with change on the Mini-Mental State Examination was assessed by slope analyses with general linear mixed models including the baseline and last follow-up score. The model was specified with a random intercept and slope and with centre as a random effect because this model provided the best −2 log-likelihood compared with models with simpler covariance structures. All analyses were adjusted for age, gender, education and centre. Additionally, we calculated the sensitivity, specificity, positive and negative predictive value, and Youden index (sensitivity + specificity−1) for Alzheimer’s disease-type dementia after 3 years.
Results
Sample demographics
We included 1607 subjects with a mean follow-up of 2.4 years (SD 1.3, range 0.5–9). One thousand five hundred and eleven subjects had a 1-year follow-up, 1069 a 2-year follow-up, 594 a 3-year follow-up, 170 a 4-year follow-up, 70 a 5-year follow-up, and 44 subjects had a follow-up longer than 5 years. Seven hundred and sixty-six subjects had data on amyloid and neuronal injury markers (CSF amyloid-β1-42 with CSF tau, medial temporal lobe, or FDG-PET) and 841 subjects had data on only a neuronal injury marker (medial temporal lobe n = 698; FDG-PET n = 143). Supplementary Tables 3 and 4 show the number of subjects for each biomarker by centre and the characteristics for the total sample and separate biomarker groups.
Prevalence and outcome
Table 2 shows the classification and characteristics of subjects according to the criteria and Table 3 shows the outcome according to the criteria classification. Eight hundred and fifty (53%) subjects had prodromal Alzheimer’s disease according to the IWG-1 criteria, and 308 (40%) subjects according to the IWG-2 criteria, either typical or atypical (Table 2). Subjects with prodromal Alzheimer’s disease were more likely to progress to Alzheimer’s disease-type dementia (Table 3 and Fig. 1) and showed a larger decline on the Mini-Mental State Examination (Supplementary Table 5 and Supplementary Fig. 1) than subjects without prodromal Alzheimer’s disease.
Table 2.
Demographics and clinical outcome according to the IWG-1, IWG-2 and NIA-AA criteria
| IWG-1 criteria | IWG-2 criteria | NIA-AA criteria | ||||||||
|---|---|---|---|---|---|---|---|---|---|---|
| No prodromal Alzheimer’s disease | Prodromal Alzheimer’s disease | No prodromal Alzheimer’s disease | Prodromal Alzheimer’s disease | Low Alzheimer’s disease likelihood | High Alzheimer’s disease likelihood | Conflicting A: IAP | Conflicting B: SNAP | Intermediate Alzheimer’s disease likelihood | Uninformative/inconclusive | |
| Normal markers or no amnestic mild cognitive impairment n = 757 | Amnestic mild cognitive impairment and at least one marker + n = 850 | CSF markers − n = 458 | CSF markers + n = 308 | Amyloid − Injury − n = 144 | Amyloid + Injury + n = 353 | Amyloid + Injury − n = 49 | Amyloid − Injury + n = 220 | Amyloid? Injury + n = 459 | Amyloid? Injury − n = 382 | |
| Age, years | 68.6 (8.7)P | 71.3 (7.9) | 67.2 (8.9)P | 71.4 (7.6) | 62.9 (9.0)H,A,B,I,U | 71.4 (7.6)L,A,B,I,U | 66.1 (7.7)L,H,B,I,U | 69.4 (8.3)L,H,A,I | 72.8 (7.3)L,H,A,B,U | 69.0 (8.4)L,H,A,I |
| Female, n | 406 (54%)P | 402 (47%) | 206 (45%) | 147 (48%) | 63 (44%)U | 165 (47%)U | 21 (43%)U | 104 (47%)U | 223 (49%)U | 232 (61%)L,H,A,B,I |
| Education, years | 10.3 (4.4)P | 11.2 (4.2) | 10.6 (3.9)P | 11.9 (4.1) | 10.5 (3.2)H | 11.7 (4.3)L,B,I,U | 11.0 (4.0) | 10.5 (4.0)H | 10.7 (4.4)H | 10.3 (4.8)H |
| Amnestic mild cognitive impairment, n | 357 (47%)P | 850 (100%) | 310 (68%)P | 259 (84%) | 98 (68%)H,I | 293 (83%)L,A,B,U | 30 (61%)H,I | 148 (67%)H,I | 379 (83%)L,A,B,U | 259 (68%)H,I |
| Follow-up, years | 2.4 (1.3) | 2.3 (1.3) | 2.4 (1.3) | 2.3 (1.2) | 2.4 (1.1) | 2.3 (1.2) | 2.7 (1.5)I | 2.5 (1.3)I | 2.2 (1.3)A,B,U | 2.4 (1.4)I |
| APOE-ε4 | 218 (37%)P | 342 (53%) | 137 (33%)P | 190 (66%) | 36 (28%)H,A,I | 207 (63%)L,A,B,I,U | 22 (46%)L,H | 62 (32%)H,I | 144 (51%)L,H,B,U | 89 (35%)H,I |
| MMSE at baseline | 27.5 (2.2)P | 26.4 (2.3) | 27.1 (2.3)P | 26.2 (2.5) | 27.7 (2.3)H,B,I | 26.2 (2.4)L,A,B,I,U | 27.6 (1.9)H,B,I | 26.7 (2.3)L,H,A,U | 26.7 (2.2)L,H,A,U | 27.6 (2.2)H,B,I |
| MMSE at last follow-up | 26.2 (3.9)P | 23.3 (4.5) | 25.8 (3.9)P | 22.4 (5.0) | 27.0 (3.2)H,B,I | 22.5 (4.9)L,A,B,I,U | 26.3 (4.0)H,I | 25.7 (4.0)L,H,I | 24.2 (3.8)L,H,A,B,U | 26.2 (4.0)H,I |
| Progression to Alzheimer’s disease-type dementia at last follow-up | 134 (18%)P | 405 (48%) | 84 (18%)P | 186 (60%) | 5 (4%)H,A,B,I,U | 207 (59%)L,A,B,I,U | 11 (22%)L,H,I | 47 (21%)L,H,I | 201 (44%)L,H,A,B,U | 68 (18%)L,H,I |
| Time to Alzheimer’s disease-type dementia, years | 2.4 (1.3) | 2.3 (1.3) | 2.5 (1.7) | 2.3 (1.2) | 2.9 (1.1) | 2.3 (1.2) | 3.1 (1.8) | 2.6 (1.8) | 2.3 (1.3)U | 2.7 (1.5)I |
| Progression to non-Alzheimer’s disease dementia at last follow-up | 45 (6%) | 40 (5%) | 43 (9%)P | 5 (2%) | 15 (10%)H,U | 10 (3%)L,B | 2 (4%) | 21 (10%)H,U | 26 (6%) | 11 (3%)L,B |
| Diagnosis of non-Alzheimer’s disease dementia: | ||||||||||
| Frontotemporal dementia | 15 | 9 | 13 | 7 | 6 | 8 | 3 | |||
| Lewy body dementia | 12 | 4 | 7 | 5 | 2 | 8 | 1 | |||
| Vascular dementia | 7 | 1 | 4 | 1 | 2 | 1 | 1 | 2 | 2 | 1 |
| Parkinson’s disease dementia | 2 | 2 | 1 | |||||||
| Progressive supranuclear palsy | 1 | 1 | ||||||||
| Alcohol-related dementia | 1 | 1 | 1 | |||||||
| Not available | 10 | 23 | 16 | 4 | 1 | 8 | 1 | 10 | 8 | 5 |
Results are mean (SD) for continuous variables or frequency (%).
MMSE = Mini-Mental State Examination (range 0–30)
APOE genotype was only available in a subgroup of the sample: IWG-1 no prodromal Alzheimer’s disease n = 593 and prodromal Alzheimer’s disease n = 641; IWG-2 no prodromal Alzheimer’s disease n = 410 and prodromal Alzheimer’s disease n = 289; NIA-AA Low n = 128, High n = 327, IAP n = 48, SNAP n = 196, Intermediate n = 281, Inconclusive n = 254.
LP < 0.05 compared to low Alzheimer’s disease likelihood.
HP < 0.05 compared to high Alzheimer’s disease likelihood.
AP < 0.05 compared to conflicting A group IAP.
BP < 0.05 compared to conflicting B group SNAP.
IP < 0.05 compared to intermediate Alzheimer’s disease likelihood.
UP < 0.05 compared to uninformative/inconclusive group.
pP < 0.05 compared to prodromal Alzheimer's disease.
Table 3.
Alzheimer’s disease-type dementia survival probability by the IWG-1, IWG-2 and NIA-AA criteria
| 3-year progression rate to Alzheimer’s disease-type dementia* | Hazard ratio** (95% CI) | P-value | |
|---|---|---|---|
| IWG-1 | |||
| No prodromal Alzheimer’s disease | 21% | Reference | |
| Prodromal Alzheimer’s disease | 50% | 3.0 (2.4–3.7) | <0.0001 |
| IWG-2 | |||
| No prodromal Alzheimer’s disease | 22% | Reference | |
| Prodromal Alzheimer’s disease | 61% | 4.0 (3.0–5.2) | <0.0001 |
| NIA-AA | |||
| Low Alzheimer’s disease likelihood group | 5% | Reference | |
| High Alzheimer’s disease likelihood group | 59% | 14.4 (5.9–35.2) | <0.0001 |
| Conflicting IAP group | 22% | 4.6 (1.6–13.2) | 0.0050 |
| Conflicting SNAP group | 24% | 4.7 (1.8–11.9) | 0.0011 |
| Intermediate Alzheimer’s disease likelihood group | 49% | 10.2 (4.1–25.2) | <0.0001 |
| Uninformative/inconclusive group | 21% | 3.5 (1.4–8.8) | 0.0079 |
*Estimated 3-year progression (cumulative incidence) rate to Alzheimer’s disease-type dementia, **Hazard ratios (95% CI) for progression to Alzheimer’s disease-type dementia calculated using Cox regression analyses and corrected for baseline age, gender, education and centre.
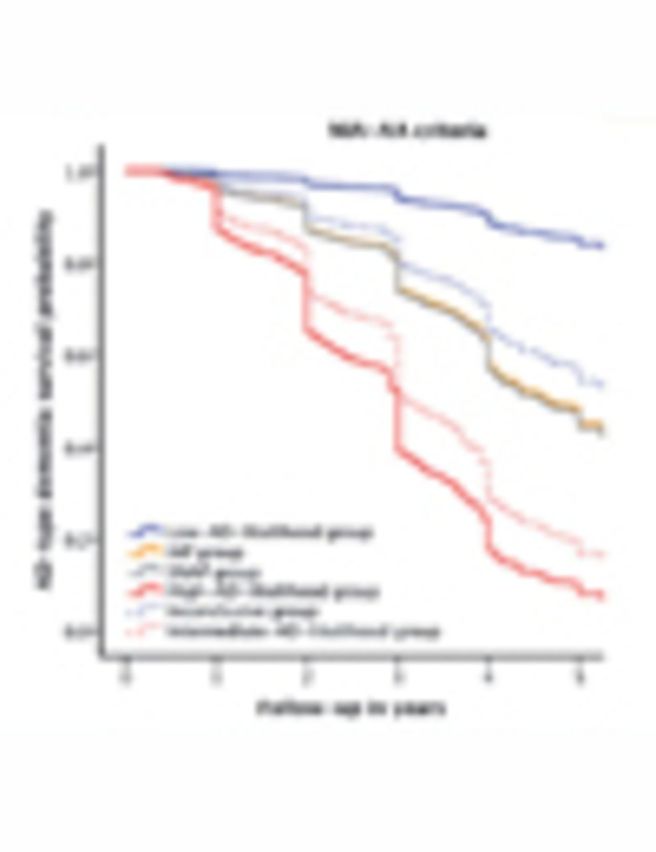
Figure 1.

Alzheimer’s disease-type dementia survival probability by the IWG-1, IWG-2 and NIA-AA criteria. The graphs represent the Alzheimer’s disease-type dementia survival probability according to the IWG-1 (left), IWG-2 (middle), and NIA-AA (right) criteria, adjusted for age, gender, education and centre. IWG-1: The group without prodromal Alzheimer’s disease represents subjects without memory impairment and/or abnormal biomarker(s). The prodromal Alzheimer’s disease group represents subjects with memory impairment and at least one abnormal biomarker. IWG-2: The group without prodromal Alzheimer’s disease represents subjects with normal CSF amyloid-β1-42 and/or tau. The prodromal Alzheimer’s disease group represents subjects with abnormal CSF amyloid-β1-42 and tau. NIA-AA: The low Alzheimer’s disease likelihood group represents subjects with normal amyloid and neuronal injury markers, the high Alzheimer’s disease likelihood group represents subjects with both abnormal amyloid and neuronal injury markers, the IAP group is a conflicting biomarker group with an abnormal amyloid marker and normal neuronal injury marker, the SNAP group is a conflicting biomarker group with an abnormal neuronal injury marker and normal amyloid marker, the intermediate Alzheimer’s disease likelihood group represents subjects with an abnormal neuronal injury marker without information on amyloid pathology, the inconclusive group represents subjects with a normal neuronal injury marker without information on amyloid pathology. AD = Alzheimer’s disease.
According to the NIA-AA criteria, of the subjects with amyloid and injury markers available, 353 (46%) subjects were classified in the high Alzheimer’s disease likelihood group, 49 (6%) in the IAP group, 220 (29%) in the SNAP group, and 144 (19%) in the low Alzheimer’s disease likelihood group (Table 2). Of the subjects with only a neuronal injury marker available, 459 (55%) were classified in the intermediate Alzheimer’s disease likelihood group and 382 (45%) in the inconclusive group. Subjects in the high Alzheimer’s disease likelihood group were more likely to progress to Alzheimer’s disease-type dementia than subjects in all other groups (Table 3 and Fig. 1). When the NIA-AA categories were dichotomized, subjects with high Alzheimer’s disease likelihood had a higher progression rate compared to subjects in the low Alzheimer’s disease likelihood and conflicting biomarker groups and subjects in the high Alzheimer’s disease likelihood and conflicting biomarker groups had a higher progression rate than subjects in the low Alzheimer’s disease likelihood group (Supplementary Table 5). The high and intermediate Alzheimer’s disease likelihood groups showed a larger decline on the Mini-Mental State Examination compared to all other groups (Supplementary Table 6 and Supplementary Fig. 1).
Head-to-head comparison of criteria
In the subgroup of subjects with both amyloid and injury markers (n = 766), the Cox regression prediction model showed a slightly better fit for the NIA-AA criteria than for the IWG-2 and IWG-1 criteria because the −2 log-likelihood or deviance (a measure for unexplained variance) was lowest for the NIA-AA criteria (2906 versus 2926 and 2982, respectively). Table 4 shows the overlap in classification between the criteria by outcome after 3 years. The requirement of memory impairment for IWG-1 prodromal Alzheimer’s disease and the requirement of abnormal CSF amyloid-β1-42 and tau markers for IWG-2 prodromal Alzheimer’s disease resulted in differences in classification compared to the NIA-AA criteria. Furthermore, the NIA-AA conflicting biomarker groups are considered prodromal Alzheimer’s disease according to the IWG-1 criteria but not according to the IWG-2 criteria. In subsequent analyses, we dichotomized the NIA-AA criteria in two ways: (i) high Alzheimer’s disease likelihood group versus conflicting and low Alzheimer’s disease likelihood groups; and (ii) high Alzheimer’s disease likelihood and conflicting groups versus low Alzheimer’s disease likelihood group. Table 5 shows that the specificity and positive predictive value were highest for IWG-2, whereas the sensitivity and negative predictive value were highest for NIA-AA (ii). NIA-AA (i) showed the highest Youden index.
Table 4.
Overlap in subject classification according to the IWG-1, IWG-2 and NIA-AA criteria by outcome after 3 years
| NIA-AA |
|||||||
|---|---|---|---|---|---|---|---|
| Amyloid and neuronal injury markers (n = 766) |
Only a neuronal injury marker (n = 841) |
||||||
| Low Alzheimer’s disease likelihood (n = 144) | High Alzheimer’s disease likelihood (n = 353) | Conflicting: IAP (n = 49) | Conflicting: SNAP (n = 220) | Intermediate Alzheimer’s disease likelihood (n = 459) | Uninformative/ Inconclusive (n = 382) | ||
| IWG-1 | No prodromal Alzheimer’s disease | 144 (2%) | 60 (45%) | 19 (11%) | 72 (11%) | 80 (19%) | 382 (12%) |
| Prodromal Alzheimer’s disease | - | 293 (49%) | 30 (23%) | 148 (20%) | 379 (39%) | - | |
| IWG-2 | No prodromal Alzheimer’s disease | 144 (2%) | 45 (42%) | 49 (18%) | 220 (17%) | NA | NA |
| Prodromal Alzheimer’s disease | - | 308 (49%) | - | - | NA | NA | |
Results are total number of subjects (% of subjects with Alzheimer’s disease-type dementia after 3 years of follow-up).
NA = not applicable
Table 5.
Predictive accuracy of the IWG-1, IWG-2 and NIA-AA criteria for Alzheimer’s disease-type dementia after 3 years
| Sample | Sensitivity | Specificity | Positive predictive value | Negative predictive value | Youden index |
|---|---|---|---|---|---|
| Amyloid and neuronal injury markers | |||||
| IWG-1 | 0.82 (0.77–0.87) | 0.47 (0.43–0.51) | 0.38 (0.34–0.43) | 0.86 (0.83–0.90) | 0.29 (0.22–0.35) |
| IWG-2 | 0.69 (0.63–0.75) | 0.71 (0.67–0.75) | 0.49 (0.43–0.55) | 0.85 (0.82–0.88) | 0.40 (0.33–0.47) |
| NIA-AA (i) high versus conflicting/low | 0.77 (0.72–0.83) | 0.66 (0.63–0.70) | 0.48 (0.43–0.53) | 0.88 (0.85–0.91) | 0.44 (0.37–0.51) |
| NIA-AA (ii) conflicting/high versus low | 0.99 (0.97–1.00) | 0.26 (0.22–0.29) | 0.35 (0.31–0.39) | 0.98 (0.96–1.00) | 0.24 (0.20–0.28) |
| Only a neuronal injury marker | |||||
| IWG-1 | 0.71 (0.64–0.77) | 0.63 (0.60–0.67) | 0.39 (0.34–0.44) | 0.87 (0.83–0.90) | 0.34 (0.27–0.41) |
| NIA-AA inconclusive versus intermediate | 0.78 (0.72–0.83) | 0.53 (0.49–0.57) | 0.36 (0.31–0.40) | 0.88 (0.84–0.91) | 0.31 (0.24–0.38) |
Results are predictive accuracy for Alzheimer’s disease-type dementia after 3-year follow-up according to the criteria for the subgroup with amyloid and neuronal injury markers (n = 766) and for the subgroup with only a neuronal injury marker (n = 841). For the IWG-1 and IWG-2 criteria, groups are defined as no prodromal Alzheimer’s disease versus prodromal Alzheimer’s disease.
Youden index = sensitivity + specificity−1.
In the subgroup of subjects with only a neuronal injury marker (n = 841), the Cox regression model fit was slightly better for IWG-1 (−2 log-likelihood 3000) than for NIA-AA (−2 log-likelihood 3012). The specificity was higher for IWG-1 than NIA-AA (Table 5).
Typical versus atypical Alzheimer’s disease
Of the subjects without IWG-1 prodromal Alzheimer’s disease, subjects with non-amnestic MCI and abnormal biomarkers (atypical prodromal Alzheimer’s disease according to the IWG-1 update, n = 231) were more likely to progress to Alzheimer’s disease-type dementia (3-year progression rate 31%) than subjects with amnestic or non-amnestic MCI with normal biomarkers (n = 526, 3-year progression 17%, hazard ratio = 1.9, 95% CI 1.3–2.7, P < 0.0001; Supplementary Fig. 2). Subjects with IWG-2 atypical prodromal Alzheimer’s disease (n = 49) had a similar progression rate as subjects with IWG-2 typical prodromal Alzheimer’s disease (n = 259; 3-year progression rate 63 versus 61%, P = 0.78; Supplementary Fig. 2).
Progression to non-Alzheimer’s disease dementia
Using the IWG-2 criteria, progression to non-Alzheimer’s disease dementia was higher for subjects without prodromal Alzheimer’s disease than for subjects with prodromal Alzheimer’s disease (Table 2; 3-year progression rate 13% versus 3%; hazard ratio = 3.4, 1.3–8.8, P = 0.011). Using the NIA-AA classification, progression to non-Alzheimer’s disease dementia was higher in the low Alzheimer’s disease likelihood (3-year progression rate 14%) and SNAP (3-year progression 13%) groups compared to the high Alzheimer’s disease likelihood and inconclusive groups (3-year progression both 4%; Table 2; low: hazard ratio = 3.0, 1.3–6.9, P = 0.011 compared to high, hazard ratio = 2.8, 1.2–6.5, P = 0.016 compared to inconclusive; SNAP: hazard ratio = 2.6, 1.2–5.6, P = 0.013 compared to high, hazard ratio = 2.5, 1.1–5.3, P = 0.021 compared to inconclusive). Using the IWG-1 criteria, no difference in progression to non-Alzheimer’s disease dementia was found between subjects without and with prodromal Alzheimer’s disease (Table 2; 3-year progression rate 8% versus 7%; hazard ratio = 1.2, 0.8–1.9, P = 0.35).
Effect of neuronal injury marker
Subject classification based on an amyloid marker in combination with CSF tau or with medial temporal lobe was generally the same (Table 6). Of the subjects with an abnormal amyloid marker and two neuronal injury markers, 29% had only one injury marker abnormal, with tau being more often abnormal than the medial temporal lobe (Table 7). Both these neuronal injury groups had a similar outcome. Subjects with abnormal CSF amyloid-β1-42 and both abnormal CSF tau and medial temporal lobe atrophy had a higher progression rate to Alzheimer’s disease-type dementia than those with only one abnormal neuronal injury marker (68% versus 36–41%, P < 0 .0001). Similar findings were obtained in subjects with a normal amyloid marker (Table 7).
Table 6.
Classification based on amyloid marker and CSF tau or medial temporal lobe neuronal injury marker
| IWG-1 criteria |
NIA-AA criteria |
|||||
|---|---|---|---|---|---|---|
| Normal group | Amnestic mild cognitive impairment and at least one marker + | Amyloid − Injury − | Amyloid + Injury + | Amyloid + Injury − | Amyloid − Injury + | |
| CSF amyloid-β1-42 and tau, n = 766 | ||||||
| Prevalence | 327 (43%) | 439 (57%) | 198 (26%) | 308 (40%) | 94 (12%) | 166 (22%) |
| Progression to Alzheimer’s disease-type dementia at last follow-up | 55 (17%) | 215 (49%) | 12 (6%) | 186 (60%) | 32 (34%) | 40 (24%) |
| CSF amyloid-β1-42 and MTL, n = 544 | ||||||
| Prevalence | 240 (44%) | 304 (56%) | 156 (29%) | 191 (35%) | 102 (19%) | 95 (18%) |
| Progression to Alzheimer’s disease-type dementia at last follow-up | 42 (18%) | 158 (52%) | 14 (9%) | 122 (64%) | 28 (28%) | 36 (38%) |
Results are prevalence and progression rate for subject classifications based on CSF amyloid-β1-42 and tau versus CSF amyloid-β1-42 and medial temporal lobe.
MTL = medial temporal lobe
Table 7.
Classification based on amyloid marker and two neuronal injury markers
| Amyloid marker | Amyloid + | (n = 286) | Amyloid − | (n = 258) | ||||
|---|---|---|---|---|---|---|---|---|
| Neuronal injury markers | Tau − MTL − | Tau + MTL − | Tau − MTL + | Tau+ MTL + | Tau − MTL − | Tau + MTL − | Tau − MTL + | Tau+ MTL + |
| Prevalence within amyloid subgroup | 37 (13%) | 58 (20%) | 25 (9%) | 168 (58%) | 91 (35%) | 65 (25%) | 39 (15%) | 63 (24%) |
| Prevalence in total group | 37 (7%) | 58 (11%) | 25 (5%) | 166 (31%) | 91 (17%) | 65 (12%) | 39 (7%) | 63 (12%) |
| Progression to Alzheimer’s disease-type dementia at last follow-up | 12 (32%) | 24 (41%) | 9 (36%) | 113 (68%) | 4 (4%) | 10 (15%) | 5 (13%) | 23 (37%) |
Results are prevalence and progression rate for subject classifications based on CSF amyloid-β1-42, tau and medial temporal lobe.
MTL=medial temporal lobe.
SNAP characterization
Because the SNAP group showed a relatively high progression rate to Alzheimer’s disease-type dementia, we investigated CSF amyloid-β1-42 levels between subjects with and without progression by comparing how much amyloid-β1-42 levels were above the cut-off. Analyses were restricted to subjects for whom biomarkers were analysed by ELISA (n = 185), as the number of subjects with suspected non-Alzheimer pathophysiology for whom biomarkers were analysed by xMAP was relatively small (n = 35). Subjects with SNAP who progressed to Alzheimer’s disease-type dementia had amyloid-β1-42 levels closer to the cut-off than subjects who did not progress and subjects who progressed to non-Alzheimer’s disease dementia [158 (SD 142) above the cut-off versus 336 (SD 257) and 381 (SD 259) pg/ml above the cut-off, P < 0.0001; Fig. 2].
Figure 2.

CSF amyloid-β1-42 levels above the cut-off in the SNAP group by outcome. Results are CSF amyloid-β1-42 levels above the cut-off of subjects with SNAP who had Alzheimer’s disease-type dementia, no dementia or non-Alzheimer’s disease dementia at follow-up. As amyloid-β1-42 cut-offs were different for different studies, we compared the amyloid-β1-42 levels above the cut-off (deviation from the cut-off) and not overall amyloid-β1-42 levels. The bold line represents the mean CSF amyloid-β1-42 levels above the cut-off. AD = Alzheimer’s disease, Aß = amyloid-β.
Discussion
This is the first large-scale multicentre study to compare the IWG-1, IWG-2 and NIA-AA criteria for prodromal Alzheimer’s disease in subjects with MCI. We noted marked differences between the criteria in Alzheimer’s disease prevalence and predictive accuracy for Alzheimer’s disease-type dementia.
The IWG criteria were designed to identify individuals with a high probability of having Alzheimer’s disease for research purposes. Indeed, we found relatively high progression rates for Alzheimer’s disease-type dementia in subjects with prodromal Alzheimer’s disease but we found also that a substantial part of the subjects not meeting prodromal Alzheimer’s disease criteria progressed to Alzheimer’s disease-type dementia. For the IWG-1 criteria, we demonstrated that the high progression rate in subjects without prodromal Alzheimer’s disease is likely due to the presence of subjects with non-amnestic MCI with abnormal biomarkers. For the IWG-2 criteria, we demonstrated that this is likely due to the inclusion of subjects with IAP and SNAP in this group. A remarkable finding was the similar predictive accuracy of IWG-2 typical and atypical prodromal Alzheimer’s disease. This corroborates a previous study (Vos et al., 2013b) and supports the use of non-amnestic MCI as Alzheimer’s disease clinical phenotype.
The NIA-AA criteria were designed both for research and clinical purposes. The prognosis of the low, high and intermediate Alzheimer’s disease likelihood subgroups nicely fitted with the proposed terminology.
In the subsample with both amyloid and neuronal injury markers available, differences in sensitivity, specificity, positive predictive value, and negative predictive value between the criteria can be explained by whether one or two biomarkers needed to be abnormal. If both were required to be abnormal (as was the case for IWG-2 and NIA-AA high Alzheimer’s disease likelihood versus low Alzheimer’s disease likelihood and conflicting biomarker groups), positive predictive value and specificity were high and sensitivity and negative predictive value low, consistent with previous findings (van Rossum et al., 2012). If one biomarker was required abnormal (as was the case for IWG-1, NIA-AA high Alzheimer’s disease-likelihood and conflicting biomarker groups versus low-Alzheimer’s disease-likelihood group), positive predictive value and specificity were low and sensitivity and negative predictive value high.
In the subsample with only a neuronal injury marker available, the higher specificity for IWG-1 compared to NIA-AA (intermediate Alzheimer’s disease likelihood group versus inconclusive group) likely reflects the requirement of memory impairment for IWG-1 prodromal Alzheimer’s disease. The progression rate to Alzheimer’s disease-type dementia in the NIA-AA intermediate Alzheimer’s disease likelihood group was similar to that of the high Alzheimer’s disease likelihood group and suggests that many subjects also had abnormal amyloid markers
The relatively high progression rate (∼20%) for subjects with SNAP is intriguing, as the biomarker profile suggests that non-Alzheimer’s disease pathology is likely (Petersen et al., 2013). We found that subjects with SNAP who progressed to Alzheimer’s disease-type dementia had CSF amyloid-β1-42 levels just above the cut-off. This indicates that the amyloid-β1-42 cut-offs may have been too conservative, although using a more lenient cut-off would also lead to more false positives. Alternatively, it could be that these subjects have comorbidities so that less amyloid pathology is needed to progress to Alzheimer’s disease-type dementia. SNAP could also be an atypical form of Alzheimer’s disease with less pronounced amyloid pathology. It is also possible that these subjects have non-Alzheimer’s disease pathology with minimal amyloid deposits and are misclassified as Alzheimer’s disease-type dementia at follow-up.
Only a small group of subjects was classified in the IAP group, likely because most subjects with Alzheimer’s disease already have neuronal injury at the MCI stage. Approximately 20% of the subjects with IAP progressed to Alzheimer’s disease-type dementia. A previous MCI study did not find any converters with IAP, although this could be due to their relatively short follow-up (1 year; Petersen et al., 2013). Studies with longer follow-up are needed to see whether all subjects with IAP will eventually progress to Alzheimer’s disease-type dementia or have some amyloid pathology unrelated to Alzheimer’s disease.
Availability of only one biomarker is a common clinical situation. As amyloid assessment is relatively invasive and expensive, often only neuronal injury markers will be measured. In subjects with only injury markers, the prognostic accuracy of the NIA-AA intermediate Alzheimer’s disease likelihood and inconclusive groups was very similar to that of the IWG-1 groups.
A higher progression rate to non-Alzheimer’s disease dementia was found in subjects without IWG-2 prodromal Alzheimer’s disease compared to those with prodromal Alzheimer’s disease and in subjects in the NIA-AA low Alzheimer’s disease likelihood and SNAP groups compared to the high Alzheimer’s disease likelihood group. This is in-line with what is expected based on the biomarker profiles. In general, the progression rate to non-Alzheimer’s disease dementia at follow-up was rather low, which could be because the cohorts were designed to study Alzheimer’s disease.
We found that 29% of the subjects with abnormal CSF amyloid-β1-42 and two neuronal injury markers (CSF tau and MTL) had only one of the abnormal injury markers. This is likely because the neuronal injury biomarkers measure different pathophysiologies, and abnormality in one does not always mean that the other is abnormal as well, at least at the MCI stage. Subjects with both abnormal injury markers had higher Alzheimer’s disease progression rates compared to those with only one abnormal injury marker in combination with amyloid pathology. This is in-line with previous studies (Scott et al., 2010; van Rossum et al., 2012) and suggests that the former group is further in the disease process or has a more aggressive form of Alzheimer’s disease.
The lack of standardized biomarker cut-offs is a known drawback in the field. We applied centre-specific biomarker cut-offs to correct for possible differences in lab procedures. Use of the same CSF ELISA cut-off for all centres would have led to essentially the same results (Supplementary Table 7). Although the use of predefined cut-offs likely resulted in somewhat lower sensitivities and specificities compared to other studies that used cut-offs defined within the sample, our study may better reflect the real diagnostic accuracy of biomarkers/the criteria.
This study has several limitations. Because the findings were based on memory clinic or research populations, they may not be generalizable to other settings. For some subjects a MRI assessment was not performed or data were not provided to us, although this is normally part of clinical routine. No autopsy data were available, which might have led to misclassification of Alzheimer’s disease. Furthermore, we used retrospective data so centres used different cognitive tests and biomarker protocols. Although this reflects current clinical practice, it could have introduced variability. Analyses for the largest cohorts separately showed some variability in prevalence and outcome of Alzheimer’s disease in subjects with MCI (Supplementary Tables 8 and 9). However, as this variability is typically random, pooling data from all centres is likely to balance out on average. Furthermore, as our main aim was to compare the sets of criteria, variability in operationalization will affect each of the criteria similarly. Standardization of cognitive tests and biomarkers will be an important goal to achieve in the future and many initiatives have started working on this. But even after standardization the criteria may still perform differently in specific settings. Because we used retrospective data, access to tests that measure non-memory domains was limited. Our operationalization of atypical prodromal Alzheimer’s disease may therefore not entirely reflect the clinical variants described in the IWG-2 criteria and may be less sensitive to detect atypical cognitive profiles. While the IWG-1 criteria recommended a cued recall test to define memory impairment, such tests were not available for most studies and we used non-cued memory tests as well. New prospective studies should include a wider range of cognitive tests to improve operationalization of the criteria. We used CSF amyloid-β1-42 as amyloid marker while use of amyloid-PET could have led to different results and would be interesting in light of the IWG-2 criteria. The major strengths of our study include the large sample size of well-characterized subjects and relatively long follow-up.
Our findings have several implications. Although the IWG-1, IWG-2 and NIA-AA criteria for prodromal Alzheimer’s disease can all be used to select subjects for therapeutic trials or clinical follow-up, as they all predict cognitive decline with reasonable accuracy, a certain set of criteria may be preferred for specific purposes. In clinical trials, a high conversion rate is needed. If both amyloid and neuronal injury markers are available, one could best select subjects according to the IWG-2 prodromal Alzheimer’s disease group or NIA-AA high Alzheimer’s disease likelihood group. This means that subjects with any MCI can be included. If only neuronal injury markers are available, the IWG-1 criteria should be considered rather than the NIA-AA criteria because of the higher specificity due to requirement of amnestic MCI for prodromal Alzheimer’s disease. In clinical settings, a refined prognosis is needed and exclusion of the disease is important to reassure patients. The NIA-AA criteria will then offer the most accurate prognosis. As Alzheimer’s disease at the MCI stage can manifest as non-memory impairment, a broad definition of MCI should be applied.
IAP and SNAP are heterogeneous conditions with subgroups progressing to Alzheimer’s disease-type dementia and further studies are needed to characterize these subjects’ prognosis and underlying pathophysiology.
Funding
This study resulted from a collaboration between centers of the European Alzheimer's Disease Consortium (EADC). The research leading to these results has received support from the Innovative Medicines Initiative Joint Undertaking under EMIF grant agreement n° 115372, resources of which are composed of financial contribution from the European Union's Seventh Framework Programme (FP7/2007-2013) and EFPIA companies’ in kind contribution.
This research was performed within the framework of CTMM, The Centre for Translational Molecular Medicine (www.ctmm.nl), project LeARN (grant 02N-101).
The DESCRIPA study was funded by the European Commission within the 5th framework program (QLRT-2001- 2455).
The AddNeuroMed study was funded by InnoMed (Innovative Medicines in Europe), an Integrated Project funded by the European Union of the Sixth Framework program priority FP6-2004-LIFESCIHEALTH-5, Life Sciences, Genomics and Biotechnology for Health.
The Coimbra Centre was funded by Project PIC/IC/ 83206/2007 da Fundação para a Ciência e Tecnologia – Portugal.
Research of the VUmc Alzheimer centre is part of the neurodegeneration research program of the Neuroscience Campus Amsterdam. The VUmc Alzheimer Centre is supported by Alzheimer Nederland and Stichting VUmc fonds. The clinical database structure was developed with funding from Stichting Dioraphte.
The Alzheimer's Disease Neuroimaging Initiative (ADNI; National Institutes of Health Grant U01 AG024904 and DOD ADNI Department of Defense award number W81XWH-12-2-0012) was funded by the National Institute on Aging, the National Institute of Biomedical Imaging and Bioengineering, and through generous contributions from the following: Alzheimer’s Association; Alzheimer’s Drug Discovery Foundation; BioClinica, Inc.; Biogen Idec Inc.; Bristol-Myers Squibb Company; Eisai Inc.; Elan Pharmaceuticals, Inc.; Eli Lilly and Company; F. Hoffmann-La Roche Ltd and its affiliated company Genentech, Inc.; GE Healthcare; Innogenetics, N.V.; IXICO Ltd.; Janssen Alzheimer Immunotherapy Research & Development, LLC.; Johnson & Johnson Pharmaceutical Research & Development LLC.; Medpace, Inc.; Merck & Co., Inc.; Meso Scale Diagnostics, LLC.; NeuroRx Research; Novartis Pharmaceuticals Corporation; Pfizer Inc.; Piramal Imaging; Servier; Synarc Inc.; and Takeda Pharmaceutical Company. The Canadian Institutes of Health Research is providing funds to Rev December 5, 2013 support ADNI clinical sites in Canada. Private sector contributions are facilitated by the Foundation for the National Institutes of Health (www.fnih.org). The grantee organization is the Northern California Institute for Research and Education, and the study is coordinated by the Alzheimer's Disease Cooperative Study at the University of California, San Diego. ADNI data are disseminated by the Laboratory for Neuro Imaging at the University of Southern California.
Supplementary material
Supplementary material is available at Brain online.
Glossary
Abbreviations
- FDG
18F-fluorodeoxyglucose
- IAP
isolated amyloid pathology
- IWG-1
International Working Group-1
- IWG-2
International Working Group-2
- MCI
mild cognitive impairment
- NIA-AA
National Institute of Ageing-Alzheimer Association
- SNAP
suspected non-Alzheimer pathophysiology
References
- Albert MS, DeKosky ST, Dickson D, Dubois B, Feldman HH, Fox NC, et al. The diagnosis of mild cognitive impairment due to Alzheimer's disease: recommendations from the National Institute on Aging and Alzheimer's Association workgroup. Alzheimers Dement. 2011;7:270–79. doi: 10.1016/j.jalz.2011.03.008. [DOI] [PMC free article] [PubMed] [Google Scholar]
- American Psychiatric Association. Washington, DC: American Psychiatric Association; 1994. Diagnostic and Statistical Manual of Mental Disorders: DSM-IV. [Google Scholar]
- Baldeiras I, Santana I, Proença MT, Garrucho MH, Pascoal R, Rodrigues A, et al. Peripheral oxidative damage in mild cognitive impairment and mild Alzheimer’s disease. J Alzheimers Dis. 2008;15:117–28. doi: 10.3233/jad-2008-15110. [DOI] [PubMed] [Google Scholar]
- Bastin C, Kerrouche N, Lekeu F, Adam S, Guillaume B, Lemaire C, et al. Controlled memory processes in questionable Alzheimer's disease: a view from neuroimaging research. J Alzheimers Dis. 2010;20:547–60. doi: 10.3233/JAD-2010-1393. [DOI] [PubMed] [Google Scholar]
- Bouwman FH, Verwey NA, Klein M, Kok A, Blankenstein MA, Sluimer JD, et al. New research criteria for the diagnosis of Alzheimer’s disease applied in a memory clinic population. Dement Geriatr Cogn Disord. 2010;30:1–7. doi: 10.1159/000315542. [DOI] [PubMed] [Google Scholar]
- Dubois B, Feldman HH, Jacova C, DeKosky ST, Barberger-Gateau P, Cummings J, et al. Research criteria for the diagnosis of Alzheimer's disease: revising the NINCDS-ADRDA criteria. Lancet Neurol. 2007;6:734–46. doi: 10.1016/S1474-4422(07)70178-3. [DOI] [PubMed] [Google Scholar]
- Dubois B, Feldman HH, Jacova C, Cummings J, DeKosky ST, Barberger-Gateau P, et al. Revising the definition of Alzheimer's disease: a new lexicon. Lancet Neurol. 2010;9:1118–27. doi: 10.1016/S1474-4422(10)70223-4. [DOI] [PubMed] [Google Scholar]
- Dubois B, Feldman HH, Jacova C, Hampel H, Molinuevo JL, Blennow K, et al. Advancing research diagnositic criteria for Alzheimer’s disease: the IWG-2 criteria. Lancet Neurol. 2014;13:614–29. doi: 10.1016/S1474-4422(14)70090-0. [DOI] [PubMed] [Google Scholar]
- Eckerström C, Andreasson U, Olsson E, Rolstad S, Blennow K, Zetterberg H, et al. Combination of hippocampal volume and cerebrospinal fluid biomarkers improves predictive value in mild cognitive impairment. Dement Geriatr Cogn Disord. 2010;29:294–300. doi: 10.1159/000289814. [DOI] [PubMed] [Google Scholar]
- Frisoni GB, Prestia A, Zanetti O, Galluzzi S, Romano M, Cotelli M, et al. Markers of Alzheimer's disease in a population attending a memory clinic. Alzheimers Dement. 2009;5:307–17. doi: 10.1016/j.jalz.2009.04.1235. [DOI] [PubMed] [Google Scholar]
- Jack CR, Jr, Knopman DS, Weigand SD, Wiste HJ, Vemuri P, Lowe V, et al. An operational approach to National Institute on Aging-Alzheimer's association criteria for preclinical Alzheimer disease. Ann Neurol. 2012;71:765–75. doi: 10.1002/ana.22628. [DOI] [PMC free article] [PubMed] [Google Scholar]
- Kornhuber J, Schmidtke K, Froelich L, Perneczky R, Wolf S, Hampel H, et al. Early and differential diagnosis of dementia and mild cognitive impairment. Design and cohort baseline characteristics of the German Dementia Competence Network. Dement Geriatr Cogn Disord. 2009;27:404–17. doi: 10.1159/000210388. [DOI] [PubMed] [Google Scholar]
- Lovestone S, Francis P, Kloszewska I, Meccoci P, Simmons A, Soininen H, et al. AddNeuroMed - the European collaboration for the discovery of novel biomarkers for Alzheimer's disease. Ann NY Acad Sci. 2009;1180:36–46. doi: 10.1111/j.1749-6632.2009.05064.x. [DOI] [PubMed] [Google Scholar]
- Maroco J, Silva D, Rodrigues A, Guerreiro M, Santana I, de Mendonça A. Data mining methods in the prediction of Dementia: a real-data comparison of the accuracy, sensitivity and specificity of Linear Discriminant Analysis, Logistic Regression, Neural Networks, Support Vector Machines, Classification Trees and Random Forests. BMC Res Notes. 2011;4:299. doi: 10.1186/1756-0500-4-299. [DOI] [PMC free article] [PubMed] [Google Scholar]
- McKhann G, Drachman D, Folstein M, Katzman R, Price D, Stadlan EM. Clinical diagnosis of Alzheimer's disease: report of the NINCDS-ADRDA Work Group under the auspices of Department of Health and Human Services Task Force on Alzheimer's Disease. Neurology. 1984;34:939–44. doi: 10.1212/wnl.34.7.939. [DOI] [PubMed] [Google Scholar]
- Morbelli S, Drzezga A, Perneczky R, Frisoni GB, Caroli A, van Berckel BN, et al. Resting metabolic connectivity in prodromal Alzheimer's disease. A European Alzheimer Disease Consortium (EADC) project. Neurobiol Aging. 2012;33:2533–50. doi: 10.1016/j.neurobiolaging.2012.01.005. [DOI] [PubMed] [Google Scholar]
- Mueller SG, Weiner MW, Thal LJ, Petersen RC, Jack CR, Jagust W, et al. Ways toward an early diagnosis in Alzheimer's disease: the Alzheimer's Disease Neuroimaging Initiative (ADNI) Alzheimers Dement. 2005;1:55–66. doi: 10.1016/j.jalz.2005.06.003. [DOI] [PMC free article] [PubMed] [Google Scholar]
- Oksengard AR, Cavallin L, Axelsson R, Andersson C, Nägga K, Winblad B, et al. Lack of accuracy for the proposed ‘Dubois criteria' in Alzheimer's disease: a validation study from the Swedish brain power initiative. Dement Geriatr Cogn Disord. 2010;30:374–80. doi: 10.1159/000321121. [DOI] [PubMed] [Google Scholar]
- Petersen RC. Mild cognitive impairment as a diagnostic entity. J Intern Med. 2004;256:183–94. doi: 10.1111/j.1365-2796.2004.01388.x. [DOI] [PubMed] [Google Scholar]
- Petersen RC, Aisen P, Boeve BF, Geda YE, Ivnik RJ, Knopman DS, et al. Criteria for mild cognitive impairment due to alzheimer's disease in the community. Ann Neurol. 2013;47:199–208. doi: 10.1002/ana.23931. [DOI] [PMC free article] [PubMed] [Google Scholar]
- Prestia A, Caroli A, van der Flier WM, Ossenkoppele R, Van Berckel B, Barkhof F, et al. Prediction of dementia in mild cognitive impairment patients based on core diagnostic markers for Alzheimer disease. Neurology. 2013;80:1048–56. doi: 10.1212/WNL.0b013e3182872830. [DOI] [PubMed] [Google Scholar]
- Scott JM, Bartlett JW, Fox NC, Barnes J. Increased brain atrophy rates in cognitively normal older adults with low cerebrospinal fluid Abeta1-42. Ann Neurol. 2010;68:825–34. doi: 10.1002/ana.22315. [DOI] [PubMed] [Google Scholar]
- Seppälä TT, Koivisto AM, Hartikainen P, Helisalmi S, Soininen H, Herukka SK. Longitudinal changes of CSF biomarkers in Alzheimer's disease. J Alzheimers Dis. 2011;25:583–94. doi: 10.3233/JAD-2011-101911. [DOI] [PubMed] [Google Scholar]
- van der Flier WM, Pijnenburg YA, Prins N, Lemstra AW, Bouwman FH, Teunissen CE, et al. Optimizing Patient Care and Research: the Amsterdam Dementia Cohort. J Alzheimers Dis. 2014;41:313–27. doi: 10.3233/JAD-132306. [DOI] [PubMed] [Google Scholar]
- Van der Mussele S, Mariën P, Saerens J, Somers N, Goeman J, De Deyn PP, et al. Behavioral syndromes in mild cognitive impairment and Alzheimer's disease. J Alzheimers Dis. 2014;38:319–29. doi: 10.3233/JAD-130596. [DOI] [PubMed] [Google Scholar]
- van Rossum IA, Vos SJ, Burns MP, Knol DL, Scheltens P, Soininen H, et al. Injury markers predict cognitive decline in subjects with mild cognitive impairment and amyloid pathology. Neurology. 2012;79:1809–16. doi: 10.1212/WNL.0b013e3182704056. [DOI] [PMC free article] [PubMed] [Google Scholar]
- Visser PJ, Verhey FR, Boada M, Bullock R, De Deyn PP, Frisoni GB, et al. Development of screening guidelines and clinical criteria for predementia Alzheimer's disease. The DESCRIPA Study. Neuroepidemiology. 2008;30:254–65. doi: 10.1159/000135644. [DOI] [PMC free article] [PubMed] [Google Scholar]
- Visser PJ, Vos SJB, van Rossum I, Scheltens P. Comparison of international working Group criteria and national institute on Aging-Alzheimer’s association criteria for Alzheimer’s disease. Alzheimers Dement. 2012;8:560–3. doi: 10.1016/j.jalz.2011.10.008. [DOI] [PubMed] [Google Scholar]
- Vos SJ, Chengjie X, Visser PJ, Jasielec MS, Hassenstab J, Grant EA, et al. Preclinical Alzheimer’s disease and its outcome: a longitudinal cohort study. Lancet Neurol. 2013;12:957–65. doi: 10.1016/S1474-4422(13)70194-7. [DOI] [PMC free article] [PubMed] [Google Scholar]
- Vos SJ, van Rossum IA, Verhey F, Knol DL, Soininen H, Wahlund LO, et al. Prediction of Alzheimer disease in subjects with amnestic and nonamnestic mild cognitive impairment. Neurology. 2013;80:1124–32. doi: 10.1212/WNL.0b013e318288690c. [DOI] [PubMed] [Google Scholar]
Associated Data
This section collects any data citations, data availability statements, or supplementary materials included in this article.