Several prognostic scoring systems have been developed to risk stratify patients with myelodysplastic syndromes (MDS) in order to serve as clinical decision tools. Such models include: the International Prognostic Scoring System (IPSS),1 the World Health Organization (WHO) classification-based Prognostic Scoring System (WPSS),2 the MD Anderson Prognostic Scoring System (MDASS),3 and the revised IPSS (IPSS-R).4 While several advantages and disadvantages have been recognized when applying these models to various clinical scenarios, not one of them has yet been validated at the time of hypomethylating agent (HMA) failure.
Epigenetic therapy with HMAs such as azacitidine (AZA) and decitabine (DAC) has become the standard of care for patients with higher-risk MDS. Though treatment with AZA and DAC may improve overall survival (OS),5–7 patients who fail HMAs have poor outcomes, with an OS of 4.3–5.6 months.8,9 Furthermore, higher-risk MDS patients who are relapsed or refractory to HMAs are a newly-defined patient population being enrolled in trials of novel drugs, with regulatory implications. Eligibility for these trials is being determined using traditional prognostic scoring system criteria despite the fact that these models lack validation in this setting. We therefore assessed the utility of existing models in these MDS patients and, after demonstrating their inadequacy, developed a more reliable model for prognostication that could be used to determine clinical trial eligibility.
This is a retrospective analysis of data from consecutive patients treated at MDS Clinical Research Consortium Institutions. Patients were diagnosed with MDS (bone marrow blasts <29%) in accordance with French-American-British or World Health Organization criteria10,11 and treated with a hypomethylating agent at the respective institutions between 6–2001 and 9–2013. Patients were ≥18 years with intermediate-2/ high risk MDS according to IPSS at the time of diagnosis and subsequently received an HMA (AZA or DAC) to which they were refractory or subsequently relapsed. All patients were treated with either AZA or DAC at the US Food and Drug Administration (FDA) approved doses for 5–7 days of 28-day cycles. The study was approved by the Institutional Review Boards at each institution and the study was conducted in accordance with the Declaration of Helsinki. The data collected from all the institutions were stored and secured in an IRB- approved database located at Cleveland Clinic. Scoring systems were calculated at the time of diagnosis and at HMA failure as previously described.1–4 HMA failure was defined as no response to AZA or DAC after 4–6 cycles of treatment (stable disease or progressive disease while on therapy), loss of established response, or disease progression or transformation to acute myeloid leukemia (AML) while on treatment. Responses to treatment and relapses were defined in accordance with the International Working Group (IWG) 2006 criteria.12 Median OS was estimated using the Kaplan-Meier method. Survival was modeled using Cox proportional hazards models and differences among subgroups were assessed using Wald tests. Akaike Information Criteria with correction for finite sample sizes (AICc) was used to compare model fits (lower number indicating better fit). Missing data were multiply imputed using the chained equation approach and fraction of missing variables (FMI) as summarized in Online Supplementary Table S4. All analyses were two-tailed and performed using an alpha significance threshold of 0.05. All analyses were done using R programming language. More details regarding statistical analyses is included in Online Supplementary Materials.
Of the 850 consecutive patients included in the database, 450 had higher-risk disease and met our inclusion criteria; 310 (69.0%) were treated with AZA and 140 (31.0%) with DAC. Patient clinical characteristics at diagnosis are summarized in Online Supplementary Table S1. The median age at diagnosis was 70 years (range, 35–91). Best responses (BR) to HMA included: 96 (21.1%) with complete remission (CR), 44 (9.7%) with partial remission (PR), 46 (10.1%) with hematologic improvement (HI), 178 (39.6%) with stable disease (SD) and 86 (19.1%) with progressive disease (PD). The median number of cycles received during treatment was 5.9 (range, 1–55: 6 (1–55) for patients who received AZA and 4.4 (1–41) for DAC) and was included in the final analysis. All patients who received <4 cycles of therapy had progressive disease. Median time from start of treatment to BR was 4.3 months (95% CI 3.9–4.8). The median time from start of treatment to HMA failure among responders was 9.2 months (95% CI 7.6–11.3). A total of 253 patients (55.6%) progressed to AML, and median time to progression from start of treatment was 8.5 months (95% CI 7.8–10.5).
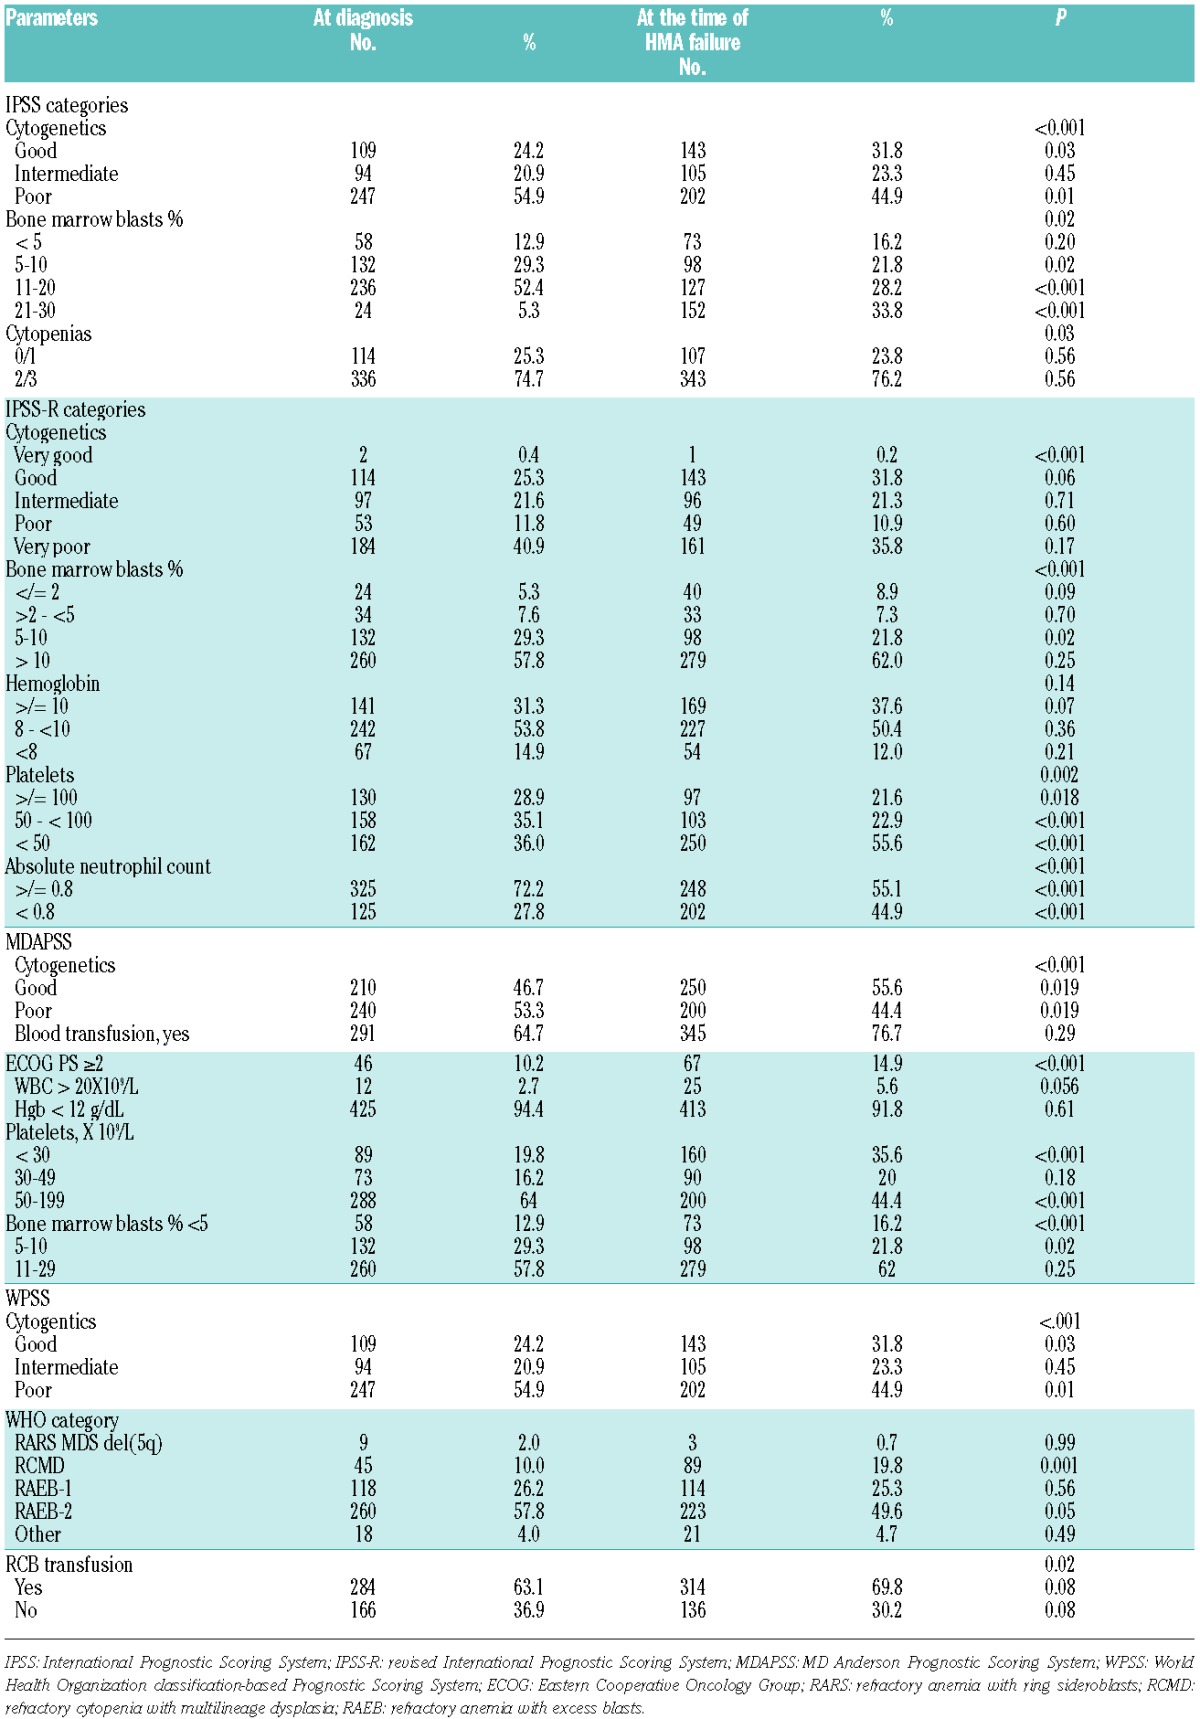
The distribution of patients by each prognostic scoring system at diagnosis is summarized in Online Supplementary Figure S1. Of these intermediate-2 and high risk IPSS patients at diagnosis, 11%, 1.1%, and 0.2% were reclassified as intermediate, low and very low by the IPSS-R, 8.8%, and 1.5% were reclassified as intermediate-1 and low by the MDASS, and 3.1%, 0.9%, and 0.3% were reclassified as intermediate, low and very low by the WPSS, respectively (Figure 1 in Online Supplementary Table 1). Comparing the scoring systems at diagnosis and at the time of HMA failure, differences in risk categories at each time point were observed in each scoring system (Online Supplementary Figure S1). These shifts occurred in large part due to differences in the clinical characteristics of patients at each time point (Table 1).
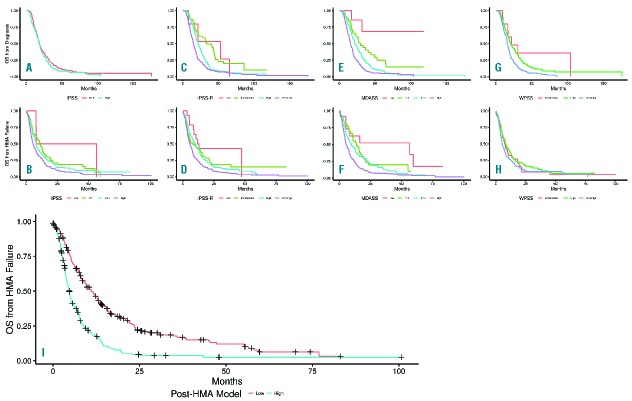
Figure 1.
Overall survival by scoring systems at diagnosis and at the time of HMA failure. Kaplan-Meier representation of each scoring systems at diagnosis and at the time of HMA failure, (A) International Prognostic Scoring System (IPSS) risk groups at diagnosis, (B) IPSS risk groups at HMA failure, (C) the revised IPSS (IPSS-R) risk groups at diagnosis, (D) IPSS-R risk groups at HMA failure, (E) MD Anderson Prognostic Scoring System (MDASS) risk groups at diagnosis, (F) MDASS risk groups at HMA failure, (G) World Health Organization classification-based Prognostic Scoring System (WPSS) risk groups at diagnosis, (H) WPSS risk groups at HMA failure. (I) Post hypomethylating agent model.
Table 1.
Prognostic Models’ clinical characteristics at diagnosis and at hypomethylating agent failure.

With a median follow up of 17.4 months (range, 0.3–161.3, 95% CI 16.1–18.8), the median OS from diagnosis for the entire group was 18.5 months (95% CI 17.2–19.8). Median OS from diagnosis was similar (P=0.17) in patients treated with AZA (18.0 months, 95% CI 16.6–19.6) and DAC (19.9 months, 95% CI 17.0–23.4). With a median follow up of 6.8 months after HMA failure, the median OS after hypomethylating agent failure (OSHF) was 7.3 months, 95% CI 6.3–8.4. There were no differences in OSHF in patients treated with azacitidine vs. decitabine. Survival plots for each prognostic scoring system at diagnosis and at the time of HMA failure are shown in Figure 1A. Comparing the predictive power of these scoring systems at the time of HMA failure, the AICc for the MDASS, IPSS-R, IPSS, and WPSS were 2890.7, 2901.5, 2911.2 and 2915.1, respectively (a lower AICc indicates better model fit). At the time of diagnosis, the AICs were: 2843.4, 2859.2, 2892.0 and 2878.3, respectively.
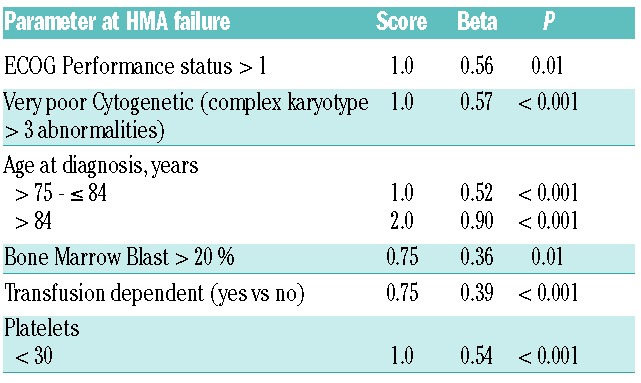
We explored 23 variables including demographic, clinical and treatment data at the time of HMA failure (Online Supplementary Table S2) to develop a new prognostic model to predict OS at the time of HMA failure. Using the multi-variable fractional polynomial modeling approach, we identified 6 factors predictive of OS at the time of HMA failure with a P-value of <.05 that were included in the final Cox multivariate model (Table 2). The new model (the post-HMA model) identified two risk groups: Low: score ≤ 2.25 and median OS of 11.0 months (95% CI 8.8–13.6); high: score > 2.25 and median OS of 4.5 months (95% CI 3.9–5.3) (Figure 1B). Using the internal model validation assessment, the estimated AICc for the new model was 2869.6, which is lower than all other models. Furthermore, the AICc for the proposed model remained the lowest even when the risk groups were combined (lower vs. higher) in all other models (Online Supplementary Table S3).
Table 2.
Prognostic factors at the time of hypomethylating agent failure.

In this study, we investigated the predictive power of the most widely used MDS prognostic models at the time of HMA failure. We first observed differences in the risk estimation of each model at the time of MDS diagnosis in HMA-treated patients with higher-risk (in accordance with IPSS) disease. As has previously been observed, patients identified by some prognostic systems as having higher-risk disease were categorized as having intermediate- or lower-risk disease by others. In some cases, risk stratification of patients also changed when assessed at diagnosis compared to at HMA failure time points. These changes were largely related to differences in clinical variables at the time of HMA failure compared to diagnosis; for example, blasts percentages worsen and some of the cytogenetic subgroups improved at the time of HMA failure compared to diagnosis (Table 2). Furthermore, neither disease status (relapsed or primary refractory to HMA), nor duration of response to HMA had an impact on OS.
Established scoring systems had a higher AICc score at the time of HMA failure, suggesting that their predictive power in this setting is less reliable. This has two implications: firstly, the prognosis in the setting of limited subsequent treatment availability may be communicated inaccurately to patients; secondly, clinical trials designed for patients following HMA failure, the majority of which use IPSS or IPSS-R classification as a criterion for trial eligibility, are systematically inappropriately including or excluding patients up to 15–20% of the time. An example being the first randomized study conducted specifically in the HMA failure population, which compared the kinase inhibitor rigosertib to either low-dose cytarabine or supportive care alone. In this study, the IPSS/IPSS-R risk groups did not reliably correlate with survival.13 This new prognostic system would be more useful in such trials of drugs that are of marginal benefit, less so for therapies with substantial benefit. Although the number of patients in this study with a blast percentage of 20–29% is relatively small, the proposed model’s AICc was lower (indicating better fit) than that of the other models when analysis focused mainly on this patient subgroup, and did not change for patients with <20% blasts.
Aware of the limitations of the current prognostic models at the time of HMA failure, we developed and validated a new post-HMA model, based on routine clinical and pathologic parameters, that can divide patients (often thought to be a homogenously poor risk group) into two populations, the median survival of which differs by 6.5 months. As with any retrospective analysis, there is a potential for selection bias. To minimize such bias, the subjects included in this study were entered into our database prior to knowledge of the research question. Overlapping with findings of a previous study, the clinical variables included in the post-HMA model are associated with OS, with differences explained by inclusion in our cohort of non-specific HMA therapy, and comprehensiveness of clinical features and follow-up.9
In conclusion, established MDS prognostic scoring systems are suboptimal when it comes to the risk stratification of patients with MDS at the time of HMA failure. While a number of MDS prognostic systems already exist, it is evermore apparent that, just as treatment is starting to embrace the concept of “one size does not fit all” due to advances in understanding disease biology, we must also recognize that one prognostic system probably “does not fit all” either. A novel and validated model was developed to specifically predict outcome in this setting, and for use in clinical trials. Validation of the proposed model in an independent cohort is underway. Although the new model can be used for patients with secondary MDS, validation in this particular patient population, and in that of CMML patients, is also needed. The incorporation of molecular data at the time of HMA failure may be needed to further enhance the predictability of the developed model.
Footnotes
Funding: MAS, GGM, GJR, DPS, AED, CZ, SL, JPM, and RSK all are grateful to receive research support from the Edward P. Evans Foundation.
Information on authorship, contributions, and financial & other disclosures was provided by the authors and is available with the online version of this article at www.haematologica.org.
References
- 1.Greenberg P, Cox C, LeBeau MM, et al. International scoring system for evaluating prognosis in myelodysplastic syndromes. Blood. 1997;89(6):2079–2088. [PubMed] [Google Scholar]
- 2.Malcovati L, Germing U, Kuendgen A, et al. Time-dependent prognostic scoring system for predicting survival and leukemic evolution in myelodysplastic syndromes. J Clin Oncol. 2007;25(23):3503–3510. [DOI] [PubMed] [Google Scholar]
- 3.Kantarjian H, O’Brien S, Ravandi F, et al. Proposal for a new risk model in myelodysplastic syndrome that accounts for events not considered in the original International Prognostic Scoring System. Cancer. 2008;113(6):1351–1361. [DOI] [PMC free article] [PubMed] [Google Scholar]
- 4.Greenberg PL, Tuechler H, Schanz J, et al. Revised international prognostic scoring system for myelodysplastic syndromes. Blood. 2012;120(12):2454–2465. [DOI] [PMC free article] [PubMed] [Google Scholar]
- 5.Silverman LR, Demakos EP, Peterson BL, et al. Randomized controlled trial of azacitidine in patients with the myelodysplastic syndrome: a study of the cancer and leukemia group B. J Clin Oncol. 2002;20(10):2429–2440. [DOI] [PubMed] [Google Scholar]
- 6.Fenaux P, Mufti GJ, Hellstrom-Lindberg E, et al. Azacitidine prolongs overall survival and reduces infections and hospitalizations in patients with WHO-defined acute myeloid leukaemia compared with conventional care regimens: an update. Ecancermedicalscience. 2008;2:121. [DOI] [PMC free article] [PubMed] [Google Scholar]
- 7.Kantarjian H, Issa JP, Rosenfeld CS, et al. Decitabine improves patient outcomes in myelodysplastic syndromes: results of a phase III randomized study. Cancer. 2006;106(8):1794–1803. [DOI] [PubMed] [Google Scholar]
- 8.Jabbour E, Garcia-Manero G, Batty N, et al. Outcome of patients with myelodysplastic syndrome after failure of decitabine therapy. Cancer. 2010;116(16):3830–3834. [DOI] [PMC free article] [PubMed] [Google Scholar]
- 9.Prebet T, Gore SD, Esterni B, et al. Outcome of high-risk myelodys-plastic syndrome after azacitidine treatment failure. J Clin Oncol. 2011;29(24):3322–3327. [DOI] [PMC free article] [PubMed] [Google Scholar]
- 10.Vardiman JW, Thiele J, Arber DA, et al. The 2008 revision of the World Health Organization (WHO) classification of myeloid neoplasms and acute leukemia: rationale and important changes. Blood. 2009;114(5):937–951. [DOI] [PubMed] [Google Scholar]
- 11.Bennett JM, Catovsky D, Daniel MT, et al. Proposals for the classification of the myelodysplastic syndromes. Br J Haematol. 1982;51(2):189–199. [PubMed] [Google Scholar]
- 12.Cheson BD, Greenberg PL, Bennett JM, et al. Clinical application and proposal for modification of the International Working Group (IWG) response criteria in myelodysplasia. Blood. 2006;108(2):419–425. [DOI] [PubMed] [Google Scholar]
- 13.Garcia-Manero G, Fenaux P, Al-Kali A, et al. Overall Survival and Subgroup Analysis from a Randomized Phase III Study of Intravenous Rigosertib Versus Best Supportive Care (BSC) in Patients (pts) with Higher-Risk Myelodysplastic Syndrome (HR-MDS) after Failure of Hypomethylating Agents (HMAs). Blood. 2014; 124(21):163.25013162 [Google Scholar]


