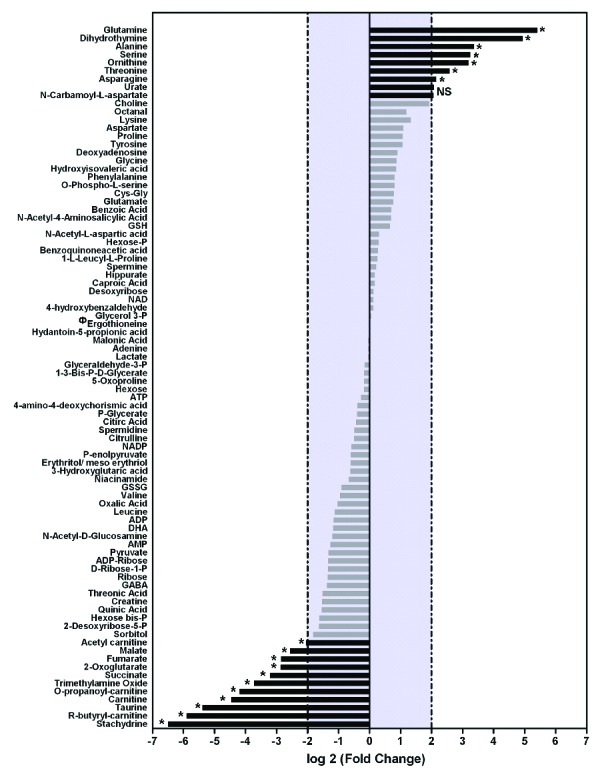
Figure 1.

Metabolic signatures of cRets and nRets are similar. Metabolomes of cRets from blood from 4 independent umbilical cords and nRets from 5 independent umbilical cords were analyzed by LC/MS followed by identification in the metabolite database.5 A diagram of high- and low-expressed metabolites is shown. cRets data are expressed as log2 fold relative to the average expression level in nRets for each metabolite. Metabolites expression was considered significantly different between cRets and nRets when log2R was above +2 or below −2 (black bars) and was considered identical when log2R was between +2 and −2 (gray bars). Statistical significance was assessed with a Mann-Whitney test: ns: not significant; *P≤ 0.05. ФThis value has been arbitrarily set at 0 (−∞ as a log20) for ease of display.
