Abstract
GATA-2 deficiency was recently described as common cause of overlapping syndromes of immunodeficiency, lymphedema, familiar myelodysplastic syndrome or acute myeloid leukemia. The aim of our study was to analyze bone marrow and peripheral blood samples of children with myelodysplastic syndrome or aplastic anemia to define prevalence of the GATA2 mutation and to assess whether mutations in GATA-2 transcription factor exhibit specific immunophenotypic features. The prevalence of a GATA2 mutation in a consecutively diagnosed cohort of children was 14% in advanced forms of myelodysplastic syndrome (refractory anemia with excess blasts, refractory anemia with excess blasts in transformation, and myelodysplasia-related acute myeloid leukemia), 17% in refractory cytopenia of childhood, and 0% in aplastic anemia. In GATA-2-deficient cases, we found the most profound B-cell lymphopenia, including its progenitors in blood and bone marrow, which correlated with significantly diminished intronRSS-Kde recombination excision circles in comparison to other myelodysplastic syndrome/aplastic anemia cases. The other typical features of GATA-2 deficiency (monocytopenia and natural killer cell lymphopenia) were less discriminative. In conclusion, we suggest screening for GATA2 mutations in pediatric myelodysplastic syndrome, preferentially in patients with impaired B-cell homeostasis in bone marrow and peripheral blood (low number of progenitors, intronRSS-Kde recombination excision circles and naïve cells).
Introduction
Myelodysplastic syndrome (MDS) is a rare disease of childhood with an approximate frequency of 0.8 to 1.8 per million children.1 The most common subtype of MDS is refractory cytopenia of childhood (RCC), which represents a distinct category that was introduced as a provisional entity in the 2008 WHO classification.2 Aplastic anemia (AA) shares several clinical and laboratory features with RCC, and nowadays histopathological assessment is a key method to distinguish between the two diseases.3 Advanced MDS in children can be separated into three categories: 1) refractory anemia with excess blasts (RAEB); 2) RAEB in transformation (RAEB-t); or 3) myelodysplasia-related acute myeloid leukemia (MDR-AML).4 In some children, MDS or hypoplastic bone marrow failure is associated with an underlying genetic predisposition (e.g. Fanconi anemia, dyskeratosis congenita or Shwachman-Diamond syndrome).5
A mutation in the GATA2 gene, which encodes the transcription factor GATA-2, was recently found by whole genome sequencing6,7 or by candidate approaches8,9 as a common cause of several overlapping syndromes: familial MDS/acute myeloid leukemia (AML), dendritic cell, monocyte, B- and NK-lymphoid (DCML) deficiency, mycobacterial infections and monocytopenia (MonoMAC), and hereditary lymphedema (Emberger syndrome).6,7 Several abnormalities, identifiable by flow cytometry (FC) in peripheral blood (PB), are known to be present in patients with GATA2 mutations: a decreased number of B cells, NK cells, monocytes and dendritic cells;10,11 plasma cells with an aberrant immunophenotype in bone marrow (BM); clonal T-large granular lymphocyte (LGL) proliferation; and aberrant maturation patterns of granulocytic lineage.10,12 MDS manifests in GATA-2-deficient patients earlier than in the general population.11 A GATA2 mutation in pediatric non-familial MDS patients was found in 16% of patients with aberrant karyotype (monosomy 7).13
Flow cytometry is recognized to be an important diagnostic method especially in adult forms of MDS.14–16 In children, the amount of FC abnormalities in comparison to adults is often limited, especially in RCC.17 The myeloid compartment is severely reduced in both RCC and AA in comparison to healthy controls, but in AA the reduction is more pronounced.18 All Czech patients with suspected MDS and AA have undergone trephine biopsy analysis by one of 2 expert pathologists since 2005, and BM aspirates are always analyzed in parallel using FC when material is available. We also analyzed the level of intronRSS-Kde recombination excision circles (KRECs) in PB and BM to assess B-cell production in children with MDS and AA.
The aims of our study were 2-fold. Our first aim was to define prevalence of GATA2 mutation in a nation-wide pediatric cohort of MDS/AA patients. Our second aim was to identify FC profile characteristics for GATA-2-deficient patients.
Methods
Patients
Patients entered the study after their parents or guardians signed informed consent and the institutional ethics committee approved the study. Patients with RCC and AA were analyzed between 2005 and 2014, and all samples underwent histopathological analysis. Non-RCC (RAEB n=12, RAEB-t n=5, MDR-AML n=3) patients were analyzed in the period 1998–2014. Only those patients with available material for screening of the GATA2 mutation entered the study (3 additional AA patients were analyzed using FC during the study period. No material was available for GATA2 mutation screening, neither FC nor GATA2 screening was performed in one RCC patient, and no material for GATA2 mutation screening was available in 3 non-RCC patients).
The prevalence of GATA2 mutation was analyzed among Czech pediatric primary MDS/AA patients: RCC n=30, AA n=38, non-RCC n=22. The flow chart describing the patient cohort is available in the Online Supplementary Appendix.
We used residual material from grafts for stem cell transplantation and samples taken for infiltration assessments of non-hematopoietic tumors as control BM samples (n=35). All control samples were obtained from individuals under 20 years of age (median 4.6 years, range 0.01–19.3). Only control samples with no tumor cell infiltration as assessed by morphology entered the study.
Diagnostic criteria
Diagnosis was established according to WHO classification (2008).2 The distinction between RCC and AA was based on histopathological criteria and cytogenetic findings (both summarized in the Online Supplementary Appendix). Patients with cytogenetic aberration before start of the treatment were classified as RCC regardless of the histopathological picture. Two patients were classified as RCC without histopathological dysplasia: one RCC GATA2 wild-type patient with familiar history of MDS had simultaneous monosomy 7 and trisomy 8, and one GATA-2-deficient patient had monosomy 7.
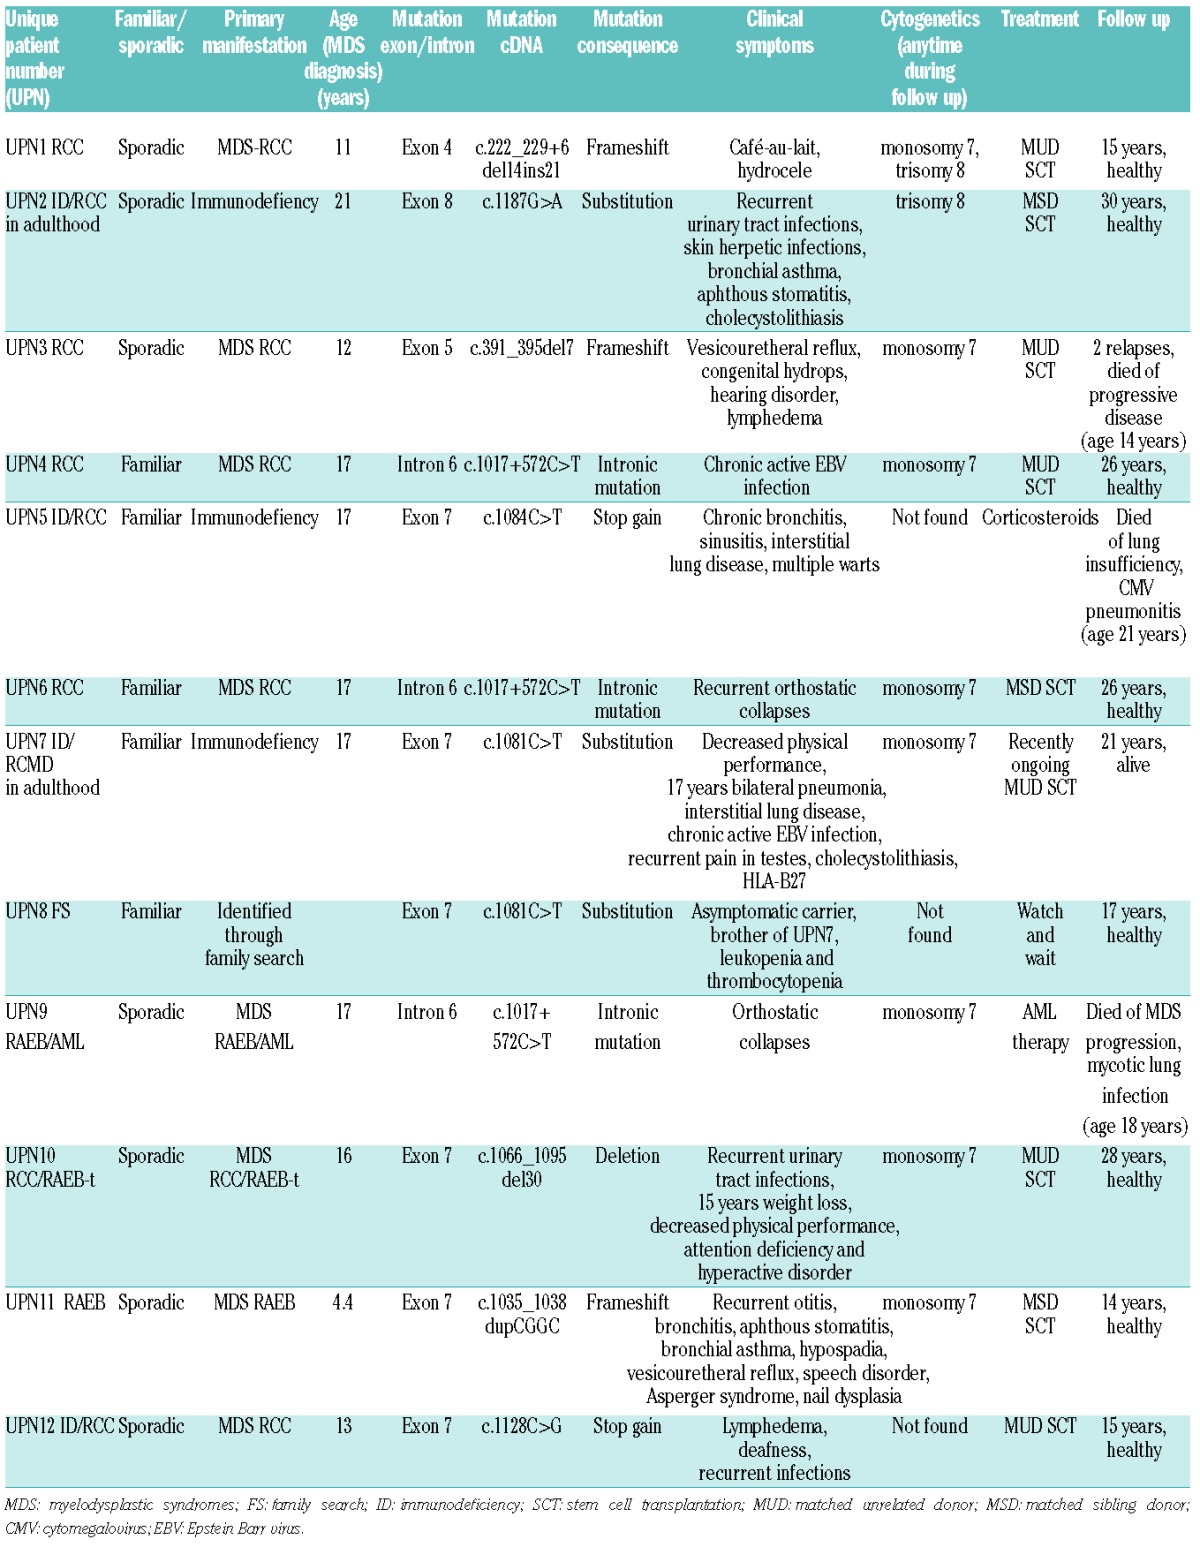
Table 1.
Disease group characteristics. Monosomy 7 or trisomy 8 was categorized as positive if present at any time point during follow up.

Further details on diagnostics including flow cytometry, cytogenetics and DNA isolation may be found in the Online Supplementary Appendix.
GATA2 sequencing
GATA2 mutation status was investigated in all MDS/AA patients with available material. Genomic DNA was extracted from BM or PB samples. The entire coding region of GATA2 and an intronic enhancer region 3′ to exon 6 were amplified using genomic PCR. Further details may be found in the Online Supplementary Appendix.
KREC/TREC detection
Albumin gene level was quantitatively detected in isolated samples using qPCR, and a standard dilution series was derived from human genomic DNA with a known starting concentration (Roche, Basel, Switzerland). The levels of T-cell receptor excision circle (TREC) and KREC signal joints were assessed separately using serial dilutions of cloned plasmid standards, as previously described.19–21 The results were subsequently recalculated to albumin gene levels and expressed as the number of TREC (KREC) copies per 1 μg of DNA. Thus, the final KREC (TREC) levels in unsorted populations serve as a surrogate marker of developing B (T) lymphocytes, irrespective of their proliferation history.22 The detection limit was 25 copies/μg DNA. The controls for KREC and TREC analyses in PB consisted of 87 samples (median age 8 years; range 0–18 years) and 5 samples from BM (median age 10.1 years; range 5.2–14.2 years). The control groups for PB and dried blood spot had been included in a previous study.21
Statistical analysis
Details may be found in the Online Supplementary Appendix.
Results
Prevalence of GATA-2 deficiency in pediatric MDS/AA
We investigated the prevalence of GATA-2 deficiency in samples taken from Czech pediatric patients under 18 years of age who developed MDS or AA. Eight of 90 pediatric MDS/AA patients had a GATA2 mutation. Three of these patients were diagnosed with non-RCC and 5 patients were diagnosed with RCC (Online Supplementary Figure S1). The prevalence of a GATA2 mutation was 17%, 14% and 0% within RCC, non-RCC, and AA groups, respectively. The prevalence of a GATA2 mutation in patients with cytogenetic aberrations was 41% and 17% in patients with monosomy 7 and trisomy 8, respectively.
Bone marrow histology of GATA-2-deficient patients
Histopathology analysis showed no difference between GATA-2-deficient RCC patients and other RCC patients; similarly, no difference was observed between GATA2 mutated patients with advanced MDS and other advanced patients. In our study, all BM samples from RCC patients, including GATA-2-deficient patients, were hypocellular. There was only one patient (UPN3 with Emberger syndrome) in the GATA-2-deficient group with a higher degree of fibrosis (MF-2).
B-cell compartment composition and production of B cells exhibit distinct features, especially in GATA-2-deficient patients
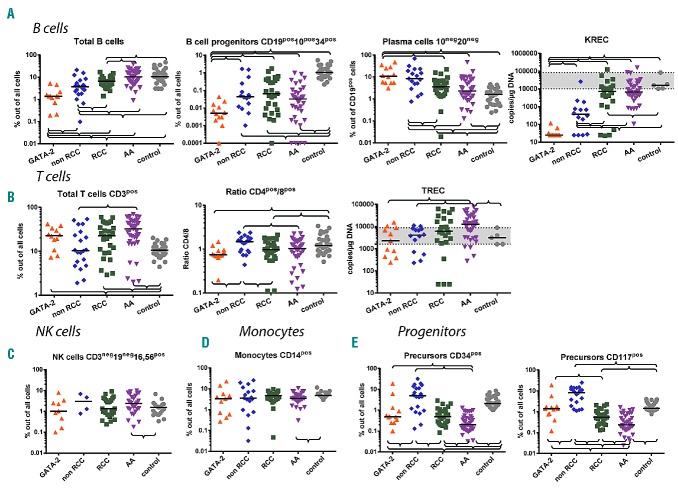
The proportion of B cells in BM in our control group was inversely correlated with age (Online Supplementary Figure S2), which is in line with previously published data.23,24 The lowest proportion of B cells was present in GATA-2-deficient patients (Table 3 and Figure 1). The highest proportion of B cells was present in the AA group, which may be explained by a severe reduction in the myeloid compartment and relative lymphocytosis. The B-cell compartment in AA is composed primarily of mature B cells. B-cell progenitors (defined as CD19pos10pos34pos) out of all cells were significantly lower in all disease groups compared with controls, and the proportion was lowest in GATA-2-deficient patients (Table 3 and Figure 1). There was no significant difference between AA and RCC in the percentage of B-cell progenitors out of all cells. The highest proportion of plasma cells (CD19pos10neg20neg) in B cells was observed in GATA-2-deficient patients (Table 3 and Figure 1).
Table 3.
Summary of the analyzed bone marrow (BM) parameters. The values are defined as medians with range in brackets.
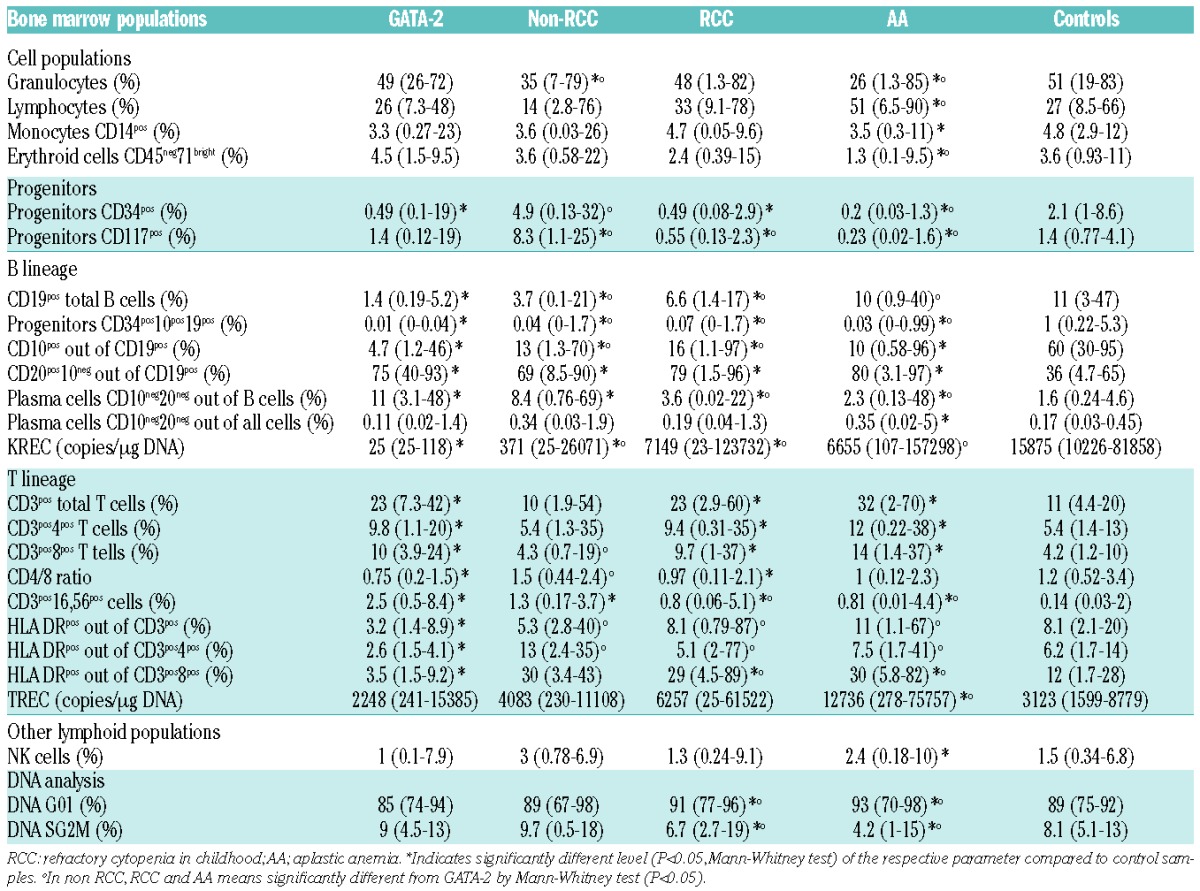
Figure 1.
Cell populations in bone marrow (BM). (A) B-cell subpopulations and kappa-deleting recombination excision circles (KRECs). (B) T-cell subpopulations and T-cell receptor excision circles (TRECs). (C) Natural killer cells. (D) Monocytes. (E) Progenitors. Braces indicate significant difference between the parameters using the non-parametric Mann-Whitney test (P<0.05). Black lines represent medians. A gray area indicates the range of control samples.
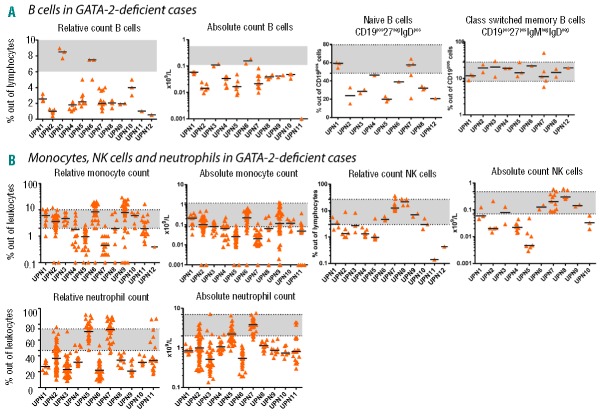
B-cell subsets were analyzed in PB using the lineage-defining marker CD19 in combination with CD27, IgM and IgD. A decrease in naïve B cells was observed in 7 of 9 patients with GATA2 mutations (range 15%–64%; median 32%; normal range 47.3%–82.5% for age >5 years25) (Figure 3A). A decreased percentage of PB B cells was present in 10 of 12 patients (Figure 3A). A normal percentage of B cells was observed in one RCC patient (UPN3), and one value out of three was below the normal range in another RCC patient (UPN6) (Figure 3A).
Figure 3.
Follow-up peripheral blood (PB) samples of GATA-2-deficient patients. Each column represents one patient. Black lines represent medians. A gray area indicates a normal range for the age category of most of the patients [either 12–18 years for B cells, natural killer (NK) cells; >15 years for monocytes and neutrophils; or >16 years for class switched memory B cells and naïve B cells]. (A) B cells and B-cell subpopulations. (B) Monocytes, NK cells, neutrophils.
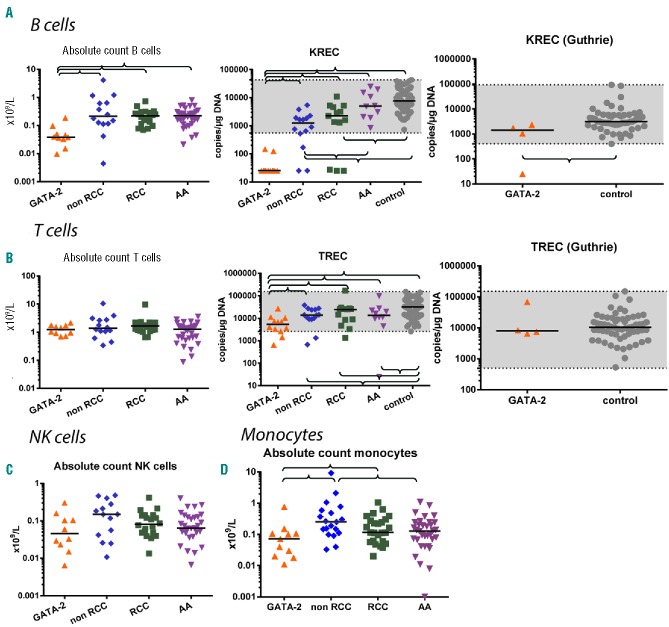
The level of KREC signal joints, which correlates with de novo production of B cells, was examined in BM and PB.22 The lowest KREC levels were observed in GATA-2-deficient patients in BM and PB (range BM 25–118; median 25; range PB 25–146, median 25) (Table 3 and Figures 1 and 2). Very low levels of KRECs, together with a decrease in B-cell progenitors and a proportional increase in plasma cells in BM, indicate a defect in B-cell production in GATA-2-deficient patients. We identified 3 RCC patients with almost no KRECs in BM and PB and no GATA2 mutation (Figures 1 and 2). Notably, one of these patients had a family history of MDS; her mother had undergone SCT for MDS RAEB. We also analyzed available newborn blood spots (Guthrie cards) from 4 GATA-2-deficient patients, which were used for the neonatal screening of metabolic disorders. We observed normal KREC levels at birth in 3 patients (UPN1, UPN6, UPN8), but there were no KRECs at birth in another patient (UPN11) who exhibited the earliest MDS RAEB manifestation in our GATA-2-deficient cohort (Table 2 and Figure 2).
Figure 2.
Cell populations in peripheral blood (PB). (A) B cells and kappa-deleting recombination excision circles (KRECs). (B) T cells and T-cell receptor excision circles (TRECs). (C) Natural killer cells. (D) Monocytes. Braces indicate significant differences between parameters using the non-parametric Mann-Whitney test (P<0.05). A gray area indicates the range of control samples. Absolute counts are shown. In relative counts, similar results were found except for relative T cells, which were increased in GATA-2-deficient patients compared to controls.
Table 2.
Overview of clinical and laboratory findings in GATA-2-deficient patients. Exons of GATA-2 are numbered according to their 5′ to 3′ order within the GATA-2 gene (NCBI RefSeqGene NG_029334.1).
Patient UPN9 with a GATA2 intronic mutation progressed rapidly to AML within three months after initial MDS RAEB diagnosis. AML blasts were immunophenotypically characterized by the co-expression of progenitor markers CD34 and CD117 and myeloid marker CD33. Simultaneously, a subpopulation of CD34pos blasts demonstrated clear B-cell differentiation by CD19, CD10 and CD20 markers (Online Supplementary Figure S3). This uncommon simultaneous presence of AML and B-cell precursor acute lymphoblastic leukemia blasts has not yet been reported in GATA-2-deficient patients.
T cells in GATA-2-deficient patients are proportionally increased in bone marrow and peripheral blood
There was no correlation between the percentage of CD3pos T cells in BM and age (Online Supplementary Figure S2). We found a significantly higher percentage of CD3pos, CD4pos and CD8pos T cells in BM of GATA-2-deficient patients compared with healthy controls (Table 3). Activation of T cells measured by HLA DR expression was significantly lower in GATA-2-deficient patients compared to healthy controls. All disease groups, including GATA-2-deficient patients, exhibited significantly higher amounts of CD3pos16,56pos cells compared with healthy controls (Table 3).
We observed an increased percentage of T cells also in PB in GATA-2-deficient patients.
The progenitor compartment is severely reduced in AA
The percentage of CD34pos, CD117pos and CD34pos19pos10pos progenitors in healthy pediatric controls was inversely correlated with age (P<0.05) (Online Supplementary Figure S2), as previously published.23,24 As expected, AA presented with a lower total progenitor frequency (assessed as CD34pos or CD117pos) than RCC or GATA-2 deficiency. In contrast, immature B-cell progenitors CD34pos19pos10pos were lower in GATA-2 deficiency compared to AA or RCC subsets. All progenitors (assessed as CD34pos, CD117pos or CD34pos19pos10pos cells) were decreased in all three conditions (AA, RCC and GATA-2 deficiency) compared with controls. However, neither CD34 nor CD117 alone can be used for diagnostic purposes to discriminate between RCC and AA because of the substantial overlap.
Myeloid populations and NK cells in GATA-2 deficiency
Unexpectedly, the analysis of BM monocytes revealed that the only group that differed from controls was AA presenting with BM monocytopenia (Table 3 and Figure 1). In PB, monocytopenia is often regarded as one of the hallmarks of GATA-2 deficiency.10 Although we did observe absolute monocytopenia at least in some specimens of 10 of 11 GATA-2-deficient patients, the majority of the patients show monocytopenia only in less than half of the investigated periods (Online Supplementary Figure S4). A stable decrease in the percentage and absolute count of monocytes was present in only 2 patients, who both suffered from severe lung disease (Figure 3 and Online Supplementary Figure S4). One patient (UPN7) was recently described as exhibiting diffuse parenchymal lung disease as the first manifestation of GATA-2 deficiency.26
The granulocytic compartment in BM generally contains neutrophils; eosinophils and basophils are only minor subpopulations in normal BM. We focused on the evaluation of the total percentage of granulocytes in BM. There was no difference in percentage of granulocytes between GATA-2-deficient patients and controls (Table 3), but we frequently found aberrancies in maturation as detected by CD16 and CD13 expression in this group. We observed a complete absence of CD16 on all forms of granulocytes in one of 6 patients with GATA-2 deficiency analyzed. We observed a disturbed maturation profile with an accumulation of CD16neg13neg granulocytes (43%) and a reduction of the mature forms CD16pos13pos (16%) in one patient. This result is consistent with an earlier report.10 Non-RCC and AA patients presented with fewer granulocytes than the remaining cohorts, including controls (Table 3). In PB, neutropenia was frequently present in GATA-2-deficient patients (Figure 3B), and at least some of the absolute neutrophil count (ANC) values were below 1×10⁹/L in all but one patient (UPN7). NK lymphopenia was present in half of the GATA-2-deficient cases (Figure 3B).
B lymphopenia is a more specific and sensitive parameter for discriminating pediatric patients with GATA-2 deficiency
To determine which parameters best identify GATA-2-deficient patients among patients with MDS and AA, we performed receiver operating characteristic (ROC) curves analysis comparing peripheral blood monocytes, B cells and NK cells (absolute and relative counts). Higher sensitivity and specificity can be reached using either relative or absolute counts of B cells compared to both monocytes and NK cells (Figure 4). Lower-than-physiological counts of B cells were found in 10 of 12 GATA-2-deficient patients (Figure 3A), and decreased KREC levels were found in all GATA-2-deficient patients (Figures 1A and 2A).
Figure 4.
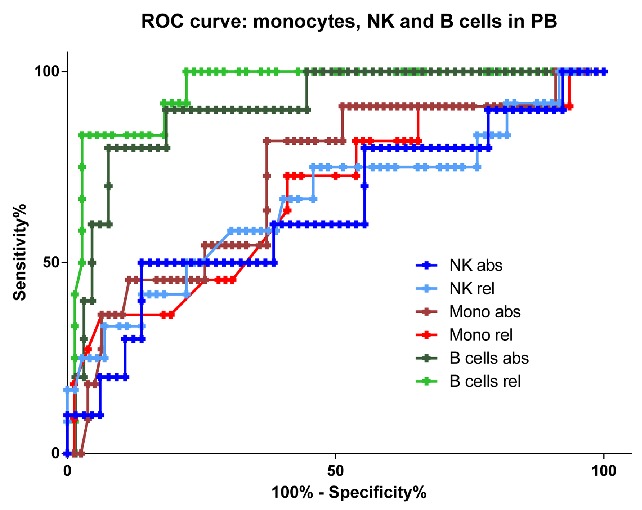
Receiver operating characteristic curves for peripheral blood monocytes, B cells and natural killer (NK) cells in GATA-2-deficient patients in comparison with all other patients with aplastic anemia and myelodysplastic syndromes. Light green: relative B-cell count; dark green: absolute B-cell count; light red: relative monocyte count; dark red: absolute monocyte count; light blue: relative NK-cell count; dark blue: absolute NK-cell count.
Discussion
Mutations in the transcription factor GATA-2 leading to haploinsufficiency is a frequent germline genetic aberration found in pediatric MDS. We compared flow cytometry results, KREC and TREC levels in pediatric patients with MDS and AA to pediatric control samples with a focus on GATA2 mutation. The most typical feature in GATA-2-deficient patients is the profound reduction of B cells and their progenitors in BM and PB. A decreased production of B cells was also documented by the low levels of KRECs in BM and PB. KREC levels on Guthrie cards taken for the neonatal screening of inherited disorders of metabolism revealed normal levels in some of the patients, which indicates the normal production of immature B cells prenatally. Three RCC patients without GATA2 mutation and mostly absent KRECs were highly suspected of having an unknown underlying genetic aberration that was responsible for MDS development, but we could not identify any common genetic aberration. Nevertheless, significant decrease of KRECs among GATA-2-deficient patients in BM and in PB (Figures 1A and 2A) indicates that KREC is useful in the diagnostic workup, possibly as a genetic pre-screening procedure. Peripheral B-cell subpopulations in GATA-2-deficient patients shift towards mature memory subsets. The production of B cells was defective in GATA-2-deficient patients, but immunoglobulin levels were largely normal in most of our patients (data not shown). Immunoglobulin substitution is rarely required in GATA-2-deficient patients.27 B-cell progenitors defined as CD19pos10pos34pos were also significantly reduced in all other disease groups (RCC, non-RCC and AA without GATA2 mutations) compared with controls, but the reduction of these cells in GATA-2 deficiency was even more profound (P<0.05).
In our cohort, the other features known to be associated with GATA-2 deficiency (monocytopenia and NK lymphopenia) were less discriminative. The most profound BM monocytopenia in the AA group is in contrast to a recently published study by Ganapathi et al.10 who found the lowest amount of monocytes in GATA-2-deficient MDS patients, with levels lower than AA. In our GATA-2-deficient cohort, the most profound monocytopenia in BM and PB was found in 2 patients with immunodeficiency and severe lung problems. Two patients with advanced form of MDS presented with monocytosis in BM. This result is consistent with previous observations that GATA-2-deficient patients whose disease progresses into advanced MDS may exhibit monocytosis.28 A recently published study by Wlodarski et al. also reported a tendency towards higher monocytes in pediatric MDS cases with GATA2 mutation (the patients partially overlap with our study). The difference in results between our cohort and those published by Ganapathi et al. might be explained by a lower incidence of advanced MDS cases (RAEB/RAEB-t) (3 of 52 vs. 3 of 12 in our study; χ2 P=0.04) and by lower incidence of monosomy 7 (4 of 48 vs. 4 of 12; χ2 P=0.01). A study by Pasqet et al. found significant monocytopenia and analyzed blood counts before the MDS/AML phase. A study by Spinner et al. also identified significant monocytopenia in GATA-2-deficient patients and included predominantly immunodeficient cases (this study overlaps with the study by Ganapathi et al., which selected patients with MDS/AML). The median age of our study was lower in comparison to Ganapathi et al. In our pediatric cohort, both PB relative and absolute B-cell lymphopenia were more specific and sensitive parameters in comparison with absolute and relative monocytopenia (Figure 4). Neutropenia is a frequent finding in GATA-2-deficient patients, and it contributes to their immunodeficiency symptoms.29,30 A study by Pasquet et al. identified GATA-2-deficient patients in the cohort based on neutropenia.30 Nearly normal ANC values were present only in UPN5 and UPN7, which was likely related to long-term use of corticosteroids due to lung disease. Relative T-cell counts were increased in GATA-2-deficient patients in PB and BM. Low levels of TRECs in GATA-2 may be explained by the decreased production and/or by expansion of mature T cells during infections. In contrast to previously published GATA-2-deficient cohorts, we did not observe an expansion of T-cell large granular lymphocytes in any of our patients. T-cell deficiency, namely CD4 lymphopenia, contributes to immunodeficiency in GATA2-mutated patients.28 We observed CD4 lymphopenia below 0.4×10⁹/L in 3 patients; 2 of them were followed for severe lung disease. We assessed the prevalence of GATA-2 deficiency in Czech children with MDS or AA. A GATA2 mutation was exclusively identified in patients with RCC (17%) or advanced MDS (non-RCC; 14%).
Aplastic anemia and RCC generally exhibit similar clinical and laboratory features. Some of the differences in flow cytometry between RCC and AA that we had observed in the past had been driven by the GATA-2-deficient group (namely B-cell lymphopenia).31,32 Differences between the overlapping categories RCC and AA are a frequent subject of discussion, especially in patients with hypocellular BM and without adverse cytogenetics. The separation of patients into two categories seems to be less relevant because immunosuppressive therapy is indicated for both disease groups,33–35 and there is no difference in prognosis nor in the probability of progression into advanced MDS.35 We observed significant differences between RCC and AA in a limited number of parameters in BM (decreased in AA: CD34pos, CD117pos, granulocytes and erythroid precursors, increased in AA: CD19pos and lymphocytes).
In summary, we found that the disturbances in the B-cell compartment were the strongest distinguishing biological feature of GATA-2 deficiency in childhood MDS, in contrast to other recently published factors, such as monocytopenia, which were less common and unspecific in our study. The finding of decreased B-cell numbers in BM and PB, and most specifically, low levels of B-cell progenitors in BM, together with very low or absent KRECs in BM and PB, can identify appropriate candidates for GATA2 mutation testing in pediatric MDS patients. Information on mutational status in the family is of importance not only when matched family donor is considered for the transplantation. GATA-2 deficiency does not only predispose to cancer, but also to an immunodeficient condition in which close immunological monitoring with careful treatment of infections might prevent organ damage, as we observed in patient UPN7.
Acknowledgments
The authors would like to thank Iveta Janotova for data management, Pavel Semerak, Pavla Luknarova and Daniel Thurner for processing flow cytometry samples, Jan Stuchly for consulting statistics and the Czech Pediatric Hematology Group for their collaboration (Doctors Sterba, Timr, Mihal, Prochazkova, Blazek and Hak).
Footnotes
Check the online version for the most updated information on this article, online supplements, and information on authorship & disclosures: www.haematologica.org/content/101/6/707
Funding
This work was a main result of grant NT14534-3. Z.Z. was supported by RVO-VFN64165/2012, JT was supported by P302/12/G101, EM was supported by Ministry of Health of the Czech Republic grant nr. 15-28525A, MN was supported by GAUK 802214 and UNCE 204012. This work was also supported by the project for conceptual development of research organization 00064203 (University Hospital Motol, Prague, Czech Republic) and Ministry of Education, Youth and Sports NPU I nr. LO1604, infrastructure was supported by EU-Prague project CZ.2.16/3.1.00/24505.
References
- 1.Hasle H, Wadsworth LD, Massing BG, McBride M, Schultz KR. A population-based study of childhood myelodysplastic syndrome in British Columbia, Canada. Br J Haematol. 1999;106(4):1027–1032. [DOI] [PubMed] [Google Scholar]
- 2.Baumann I, Niemeyer CM, Bennett JM, Shannon K. WHO Classification of Tumours of Haematopoietic and Lymphoid Tissues. In: Swerdlow SH, Campo E, Harris NL, Jaffe ES, Pileri SA, Stein H, et al., eds. WHO Classification of Tumours of Haematopoietic and Lymphoid Tissues. Lyon: International Agency of Research on Cancer (IARC); 2008. p 104–107. [Google Scholar]
- 3.Baumann I, Führer M, Behrendt S, et al. Morphological differentiation of severe aplastic anaemia from hypocellular refractory cytopenia of childhood: reproducibility of histopathological diagnostic criteria. Histopathology. 2012;61(1):10–17. [DOI] [PubMed] [Google Scholar]
- 4.Strahm B, Nöllke P, Zecca M, et al. Hematopoietic stem cell transplantation for advanced myelodysplastic syndrome in children: results of the EWOG-MDS 98 study. Leukemia. 2011;25(3):455–462. [DOI] [PubMed] [Google Scholar]
- 5.Shimamura A, Alter BP. Pathophysiology and management of inherited bone marrow failure syndromes. Blood Rev. 2010; 24(3):101–122. [DOI] [PMC free article] [PubMed] [Google Scholar]
- 6.Ostergaard P, Simpson MA, Connell FC, et al. Mutations in GATA2 cause primary lymphedema associated with a predisposition to acute myeloid leukemia (Emberger syndrome). Nat Genet. 2011;43(10):929–931. [DOI] [PubMed] [Google Scholar]
- 7.Dickinson RE, Griffin H, Bigley V, et al. Exome sequencing identifies GATA-2 mutation as the cause of dendritic cell, monocyte, B and NK lymphoid deficiency. Blood. 2011;118(10):2656–2658. [DOI] [PMC free article] [PubMed] [Google Scholar]
- 8.Hahn CN, Chong C-E, Carmichael CL, et al. Heritable GATA2 mutations associated with familial myelodysplastic syndrome and acute myeloid leukemia. Nat Genet. 2011;43(10):1012–1017. [DOI] [PMC free article] [PubMed] [Google Scholar]
- 9.Hsu AP, Johnson KD, Falcone EL, et al. GATA2 haploinsufficiency caused by mutations in a conserved intronic element leads to MonoMAC syndrome. Blood. 2013;121(19):3830–3837, S1–S7. [DOI] [PMC free article] [PubMed] [Google Scholar]
- 10.Ganapathi KA, Townsley DM, Hsu AP, et al. GATA2 deficiency-associated bone marrow disorder differs from idiopathic aplastic anemia. Blood. 2015;125(1):56–70. [DOI] [PMC free article] [PubMed] [Google Scholar]
- 11.Dickinson RE, Milne P, Jardine L, et al. The evolution of cellular deficiency in GATA2 mutation. Blood. 2014;123(6):863–874. [DOI] [PMC free article] [PubMed] [Google Scholar]
- 12.Calvo KR, Vinh DC, Maric I, et al. Myelodysplasia in autosomal dominant and sporadic monocytopenia immunodeficiency syndrome: diagnostic features and clinical implications. Haematologica. 2011; 96(8):1221–1225. [DOI] [PMC free article] [PubMed] [Google Scholar]
- 13.Hirabayashi S, Strahm B, Urbaniak S, et al. Unexpected High Frequency of GATA2 Mutations in Children with Non-Familial MDS and Monosomy 7. ASH Annual Meeting Abstracts. 2012;120(21):1699. [Google Scholar]
- 14.Westers TM, Ireland R, Kern W, et al. Standardization of flow cytometry in myelodysplastic syndromes: a report from an international consortium and the European LeukemiaNet Working Group. Leukemia. 2012;26(7):1730–1741. [DOI] [PubMed] [Google Scholar]
- 15.Della Porta MG, Picone C, Pascutto C, et al. Multicenter validation of a reproducible flow cytometric score for the diagnosis of low-grade myelodysplastic syndromes: results of a European LeukemiaNET study. Haematologica. 2012;97(8):1209–1217. [DOI] [PMC free article] [PubMed] [Google Scholar]
- 16.van de Loosdrecht AA, Westers TM, Westra AH, et al. Identification of distinct prognostic subgroups in low- and intermediate-1-risk myelodysplastic syndromes by flow cytometry. Blood. 2008;111(3):1067–1077. [DOI] [PubMed] [Google Scholar]
- 17.Aalbers AM, van den Heuvel-Eibrink MM, de Haas V, et al. Applicability of a reproducible flow cytometry scoring system in the diagnosis of refractory cytopenia of childhood. Leukemia. 2013;27(9):1923–1925. [DOI] [PubMed] [Google Scholar]
- 18.Aalbers AM, van den Heuvel-Eibrink MM, Baumann I, et al. Bone marrow immunophenotyping by flow cytometry in refractory cytopenia of childhood. Haematologica. 2015;100(3):315–323. [DOI] [PMC free article] [PubMed] [Google Scholar]
- 19.van Zelm MC, Szczepanski T, van der Burg M, van Dongen JJM. Replication history of B lymphocytes reveals homeostatic proliferation and extensive antigen-induced B cell expansion. J Exp Med. 2007;204(3):645–655. [DOI] [PMC free article] [PubMed] [Google Scholar]
- 20.Weinberg K, Blazar BR, Wagner JE, et al. Factors affecting thymic function after allogeneic hematopoietic stem cell transplantation. Blood. 2001;97(5):1458–1466. [DOI] [PubMed] [Google Scholar]
- 21.Fronková E, Klocperk A, Svatoñ M, et al. The TREC/KREC assay for the diagnosis and monitoring of patients with DiGeorge syndrome. PLoS One. 2014;9(12):e114514. [DOI] [PMC free article] [PubMed] [Google Scholar]
- 22.Fronkova E, Muzikova K, Mejstrikova E, et al. B-cell reconstitution after allogeneic SCT impairs minimal residual disease monitoring in children with ALL. Bone Marrow Transplant. 2008;42(3):187–196. [DOI] [PubMed] [Google Scholar]
- 23.Veltroni M, Sainati L, Zecca M, et al. Advanced pediatric myelodysplastic syndromes: can immunophenotypic characterization of blast cells be a diagnostic and prognostic tool? Pediatr Blood Cancer. 2009;52(3):357–363. [DOI] [PubMed] [Google Scholar]
- 24.Bras AE, van den Heuvel-Eibrink MM, van der Sluijs-Gelling AJ, et al. No significant prognostic value of normal precursor B-cell regeneration in paediatric acute myeloid leukaemia after induction treatment. Br J Haematol. 2013;161(6):861–864. [DOI] [PubMed] [Google Scholar]
- 25.Piatosa B, Wolska-Kušnierz B, Pac M, et al. B cell subsets in healthy children: reference values for evaluation of B cell maturation process in peripheral blood. Cytometry B Clin Cytom. 2010;78(6):372–381. [DOI] [PubMed] [Google Scholar]
- 26.Svobodova T, Mejstrikova E, Salzer U, et al. Diffuse parenchymal lung disease as first clinical manifestation of GATA-2 deficiency in childhood. BMC Pulm Med. 2015;15:8. [DOI] [PMC free article] [PubMed] [Google Scholar]
- 27.Chou J, Lutskiy M, Tsitsikov E, et al. Presence of hypogammaglobulinemia and abnormal antibody responses in GATA2 deficiency. J Allergy Clin Immunol. 2014; 134(1):223–226. [DOI] [PMC free article] [PubMed] [Google Scholar]
- 28.Spinner MA, Sanchez LA, Hsu AP, et al. GATA2 deficiency: a protean disorder of hematopoiesis, lymphatics, and immunity. Blood. 2014;123(6):809–821. [DOI] [PMC free article] [PubMed] [Google Scholar]
- 29.Dotta L, Badolato R. Primary immunodeficiencies appearing as combined lymphopenia, neutropenia, and monocytopenia. Immunol Lett. 2014;161(2):222–225. [DOI] [PubMed] [Google Scholar]
- 30.Pasquet M, Bellanné-Chantelot C, Tavitian S, et al. High frequency of GATA2 mutations in patients with mild chronic neutropenia evolving to MonoMac syndrome, myelodysplasia, and acute myeloid leukemia. Blood. 2013;121(5):822–829. [DOI] [PMC free article] [PubMed] [Google Scholar]
- 31.Mejstrikova E, Pelkova V, Reiterova M, et al. Composition of Cellular Subsets by Flow Cytometry Identifies Differences Between MDS Subtypes and Aplastic Anemia but No Differences Are Identified Between Cases with and without Monosomy 7. ASH Annual Meeting Abstracts. 2009;114(22):3802. [Google Scholar]
- 32.Reiterova M, Kramarzova K, Sukova M, et al. Changes Identified by Flow Cytometry and WT1 Expression in Consecutive Bone Marrow Samples in Refractory Cytopenia of Childhood and Aplastic Anemia Before Start of the Therapy. ASH Annual Meeting Abstracts. 2011;118(21):1342. [Google Scholar]
- 33.Yoshimi A, van den Heuvel-Eibrink MM, Baumann I, et al. Comparison of horse and rabbit antithymocyte globulin in immunosuppressive therapy for refractory cytopenia of childhood. Haematologica. 2014; 99(4):656–663. [DOI] [PMC free article] [PubMed] [Google Scholar]
- 34.Führer M, Rampf U, Baumann I, et al. Immunosuppressive therapy for aplastic anemia in children: a more severe disease predicts better survival. Blood. 2005; 106(6):2102–2104. [DOI] [PubMed] [Google Scholar]
- 35.Forester C, Sartain S, Guo D, et al. Pediatric aplastic anemia and refractory cytopenia: A retrospective analysis assessing outcomes and histomorphologic predictors. Am J Hematol. 2015;90(4):320–326. [DOI] [PMC free article] [PubMed] [Google Scholar]


