Abstract
Increased fetal hemoglobin levels lessen the severity of symptoms and increase the lifespan of patients with sickle cell disease. Hydroxyurea, the only drug currently approved for the treatment of sickle cell disease, is not effective in a large proportion of patients and therefore new pharmacological agents that increase fetal hemoglobin levels have long been sought. Recent studies identifying LSD-1 as a repressor of γ-globin expression led to experiments demonstrating that the LSD-1 inhibitor RN-1 increased γ-globin expression in the sickle cell mouse model. Because the arrangement and developmental stage-specific expression pattern of the β-like globin genes is highly conserved between man and baboon, the baboon model remains the best predictor of activity of fetal hemoglobin-inducing agents in man. In this report, we demonstrate that RN-1 increases γ-globin synthesis, fetal hemoglobin, and F cells to high levels in both anemic and non-anemic baboons with activity comparable to decitabine, the most potent fetal hemoglobin-inducing agent known. RN-1 not only restores high levels of fetal hemoglobin but causes the individual 5′ Iγ- and 3′ Vγ-globin chains to be synthesized in the ratio characteristic of fetal development. Increased fetal hemoglobin was associated with increased levels of acetylated Histone H3, H3K4Me2, H3K4Me3, and RNA polymerase II at the γ-globin gene, and diminished γ-globin promoter DNA methylation. RN-1 is likely to induce clinically relevant levels of fetal hemoglobin in patients with sickle cell disease, although careful titration of the dose may be required to minimize myelotoxicity.
Introduction
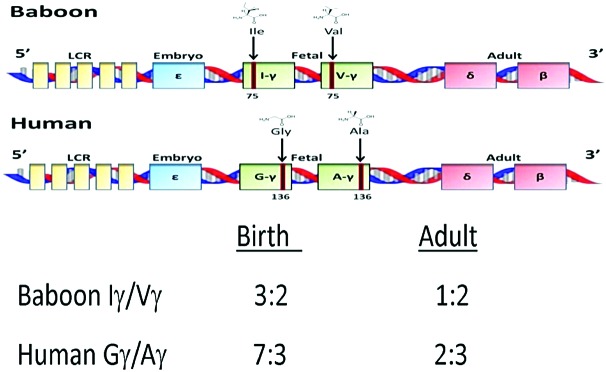
The term “haemoglobin switching” describes the sequential, highly regulated pattern of expression of the α- and β-like globin genes during development.1 In humans, the e-globin gene is expressed during the first eight weeks of gestation, followed by high level expression of the duplicated γ-globin genes during the fetal period. The γ-globin genes are expressed at very low levels (<1%) in the adult stage when expression of the β-globin gene predominates. A secondary level of developmental regulation characterizes expression of the γ-globin genes. The duplicated γ-globin genes can be distinguished by an amino acid difference at aa136 where the 5′ Gγ-globin gene contains glycine while the 3′ Aγ-globin gene contains alanine (Figure 1). During the fetal period the Gγ- and Aγ genes are expressed in a ratio of 7:3, but in adult life this ratio is 2:3. The baboon (P. anubis) is an important animal model for studies of fetal hemoglobin regulation because the structure and developmental regulation of the β-globin gene complex is nearly identical to man.2,3 In the baboon the duplicated γ-globin genes are designated Iγ and Vγ because their amino acid sequence differs by the presence of an Ile or Val at aa75.4 The ratio of Iγ/Vγ-globin expression is more than 9:5 in early gestational age (50–60dpc) fetuses, 3:2 at birth and 1:2 in the adult.4,5 Therefore, the developmental pattern of expression of the baboon Iγ- and Vγ-globin genes is very similar to the human Gγ- and Aγ-globin genes (Figure 1).
Figure 1.
Amino acid substitutions in the baboon and human duplicated γ-globin genes and the difference in their expression at birth and in adults.
In sickle cell disease (SCD), the substitution of glutamic acid for valine at the sixth amino acid of the β-globin protein leads to the formation of abnormal hemoglobin S (HbS).6 Following deoxygenation in red blood cells (RBCs), HbS forms polymers causing the RBCs to become deformed and adherent leading to painful vaso-occlusive events and organ injury. In vitro studies have shown that both fetal hemoglobin (HbF) (α2γ2) tetramers and (α2βSγ) tetramers inhibit HbS polymerization.7 Because increased levels of HbF lessen the severity of symptoms and increase the life expectancy of patients with SCD, therapeutic approaches to increase HbF levels would be highly desirable.8,9 While many drugs increase HbF in cultured erythroid cells, only a few have been shown to increase HbF in vivo. Studies in simian primate animal models that exhibit conservation of developmental globin gene regulation,10 such as baboons, are considered one of the best tests of the activity of HbF-inducing drugs for therapies in patients designed to alleviate the symptoms of SCD and β-thalassemia.11
Early studies in anemic baboons showed that treatment with the DNA methyltransferase inhibitor 5-azacytidine increased HbF to levels predicted to be therapeutic in patients.12 Later studies confirmed that 5-azacytidine and its closely related analog decitabine did indeed increase HbF to therapeutic levels in patients with SCD and β-thalassemia.13–18 Based on experiments conducted in baboons, a phase I trial is currently in progress to test the safety and HbF-inducing activity of oral administration of decitabine in combination with the cytidine deaminase inhibitor tetrahydrouridine in SCD patients.19 Hydroxurea (HU), the first drug approved for the treatment of SCD, was initially shown to increase HbF levels in monkeys20 and subsequent clinical trials also confirmed that HU increased HbF levels in patients with SCD.21 Because a large percentage of patients do not respond to HU, developing new drugs that increase HbF levels remains a priority.
The TR2/TR4 heterodimer and Bcl11A have been identified as γ-globin gene repressors that act by recruiting co-repressor complexes that establish repressive epigenetic modifications at specific sites to inactivate gene expression.22 Recognition of the role of Direct Repeat (DR) elements in the ε- and γ-globin gene promoters in repression of these respective genes led to the identification of the TR2 and TR4 non-steroidal nuclear receptor proteins that specifically bind these elements and subsequently recruit a multi-protein co-repressor complex that includes DNA methyltransferase 1 (DNMT1), lysine specific demethylase 1 (LSD1), and histone deacetylases (HDACs) to repress gene expression.23–25 Both DNMT1 and LSD1 have also been identified as components of co-repressor complexes also recruited by Bcl11a.26,27 LSD1, the first histone demethylase identified, demethylates lysine 4 (H3K4) and lysine 9 (H3K9) residues of histone H3 and represses gene expression during hematopoietic differentiation.28–30 Tranylcypromine (TCP), an LSD-1 inhibitor, induced HbF production in cultured human hematopoietic erythroid progenitors and transgenic mice containing the entire human β-globin gene complex in the context of a yeast artificial chromosome (β-YAC mice).31 Two recent studies have shown that RN-1, a more potent and specific LSD-1 inhibitor than TCP, induced γ-globin expression in human and baboon erythroid progenitors and a sickle cell mouse model.32,33 In this study we have tested the effect of RN-1 in baboons and confirm that it is a highly potent in vivo inducer of HbF synthesis.
Methods
Baboons
Baboons were housed at the University of Illinois at Chicago Biologic Resources Laboratory (UIC BRL) under conditions that meet the Association for Assessment and Accreditation of Laboratory Animal Care (AAALAC) standards. Bone marrow aspirations were performed from the hips of animals under ketamine/xylazine anesthesia (10 mg/kg; 1 mg/kg). Prior to bone marrow sampling, Buprenex (0.01 mg/kg IM) was given and later in the afternoon a second dose of Buprenex (0.01 mg/kg IM) was administered to alleviate potential pain and suffering.
The effect of RN-1 was tested in both anemic and non-anemic baboons. Anemia was induced by repeated phlebotomies during a 2-week period prior to administration of drug to attain a hematocrit (HCT) of 20 and animals were maintained at this HCT during the course of the experiment by periodic phlebotomies. Baboons were subjected to ketamine/midazolam (10 mg/kg; 3–5 mg/kg) anesthesia to allow removal of sufficient volumes of blood (15% of body weight) to induce and maintain anemia. RN-1 was dissolved in phosphate-buffered saline and passed through a 0.45 micron filter prior to administration by subcutaneous injection. All procedures were approved by the Animal Care Committee of the University of Illinois at Chicago.
F cells and F reticulocytes
Levels of F cells and F reticulocytes were analyzed by flow cytometry using a Cytomics FC500 (Beckman Coulter) after staining with thiazole orange and PE-conjugated anti-HbF (BD Bioscience).
HbF and globin chain synthesis
HbF levels in peripheral blood were determined by alkali denaturation.34 Measurement of globin chain synthesis in peripheral blood reticulocytes was performed by biosynthetic radiolabeling of globin chains in the presence of [3H] leucine.35 For non-anemic animals, a fraction enriched in reticulocytes was obtained by centrifugation of 7 mL whole blood on Percoll step gradients as previously described.36 Globin chain separation was achieved by high-performance liquid chromatography (HPLC) as previously described (Online Supplementary Methods).37
RNA analysis
Real-time PCR assays were performed as previously described38 to determine levels of globin transcripts (Online Supplementary Methods).
Bisulfite sequence analysis
For bisulfite sequence analysis, DNA was purified from washed cell pellets using QIAmp Blood DNA Minikits. Bisulfite modification was performed using Epitect Bisulfite kits (Qiagen #59104) according to the manufactuer’s instructions. Amplification of bisulfite modified DNA was performed as previously described (Online Supplementary Methods).35
Chromatin immunoprecipitation analysis
Chromatin immunoprecipitation analysis was performed as previously described39 with modifications (Online Supplementary Appendix).
Statistics analysis
Student’s t-test was used for all the statistical analyses. Error bars represent standard deviation.
Results
Effect of RN-1 in anemic baboons
A series of dose-response experiments were conducted in anemic baboons to investigate the effect of RN-1 on HbF levels, F cells, and F reticulocytes. Anemic baboons were treated with five different doses (0.125, 0.20, 0.25, 0.50, and 2.5 mg/kg/d) of RN-1 administered subcutaneously for 4–5d (Online Supplementary Table S2, Exp. 1–5). The highest dose of RN-1 (2.5 mg/kg) increased HbF from 5.8% on the first day of drug treatment to 27.3% 7d after the last injection (Figure 2 and Online Supplementary Table S2, Exp. 1). Peak γ-globin chain synthesis (0.78 γ/γ+β) was observed 3d following the last day of drug administration demonstrating a near-complete reversion to fetal-stage synthesis (Figure 3). At this time the ratio of chain synthesis of the 5′ Iγ gene and the 3′ Vγ gene (Iγ/Vγ ratio) was more than 2, characteristic of the fetal stage. F reticulocytes increased from 34.6% to 92.3% while F cells increased from 28.5% to 59.2% (Figure 4 and Online Supplementary Table S2). Neutropenia was observed with an absolute neutrophil count (ANC) nadir of 29×10/9L 10d after the last RN-1 dose (Figure 5 and Online Supplementary Table S2). A second animal (PA8549) was treated with a reduced dose of RN-1 (0.5 mg/kg/d). The HbF level increased from 2.4% on the first day of drug treatment to 29.4% 6d after the last injection (Figure 2 and Online Supplementary Table S2, Exp. 2). Peak γ-globin chain synthesis (0.68 γ/γ+β) was attained three days after the last RN-1 treatment (Figure 3). The Iγ/Vγ synthesis ratio at this time was more than 2, characteristic of fetal-stage synthesis. F cells increased from 19.1% to 60.8% (Figure 4 and Online Supplementary Table S2) and F reticulocytes from 33.9% to 97.5% (Figure 4 and Online Supplementary Table S2). Neutropenia was observed with an ANC nadir of 0.57×10/9L 10d after the last RN-1 dose (Figure 5 and Online Supplementary Table S2). A third animal (PA8000) was treated with a reduced RN-1 dose (0.25 mg/kg/d). The HbF increased from 4.1% on the first day of treatment to 20.6% 6d after the last injection (Figure 2 and Online Supplementary Table S2, Exp. 3). Peak γ-globin chain synthesis (0.68 γ/γ+β) was 0.49 and the Iγ/Vγ chain ratio was 1.18 (Figure 3). F cells increased from 20.3% to 47.0% and F reticulocytes from 45.7% to 80.7% (Figure 4 and Online Supplementary Table S2). The decrease in ANC (nadir=0.87×10/9L) was less severe than at the higher doses (Figure 4 and Online Supplementary Table S2). No changes in total hemoglobin production (α/γ+β=1.06+0.02) were observed in these 3 animals treated with the highest doses of RN-1. In a fourth experiment, PA8548 was re-treated with a reduced RN-1 dose (0.2 mg/kg/d). HbF increased from 3.7% on the first day of treatment to 20.5% six days post treatment (Figure 2 and Online Supplementary Table S2, Exp. 4). F-cells increased from 36.9% to 54.8% and F reticulocytes from 36.9% to 89.2% (Figure 4 and Online Supplementary Table S2). Peak γ-globin chain synthesis (γ/γ+β) was 0.52 (Online Supplementary Table S2). Neutropenia (ANC nadir=0.8×10/9L) was observed (Figure 5 and Online Supplementary Table S2). Another animal (PA8001) was treated with a reduced RN-1 dose (0.125 mg/kg/d) for 5d. HbF increased from 1.7% pre treatment to 4.8% post treatment, F-cells increased from 13.5% to 21.8% and F reticulocytes from 22.9% to 31.7% (Figure 4 and Online Supplementary Table S2). Neutropenia was not observed in this animal (Figure 4 and Online Supplementary Table S2).
Figure 2.
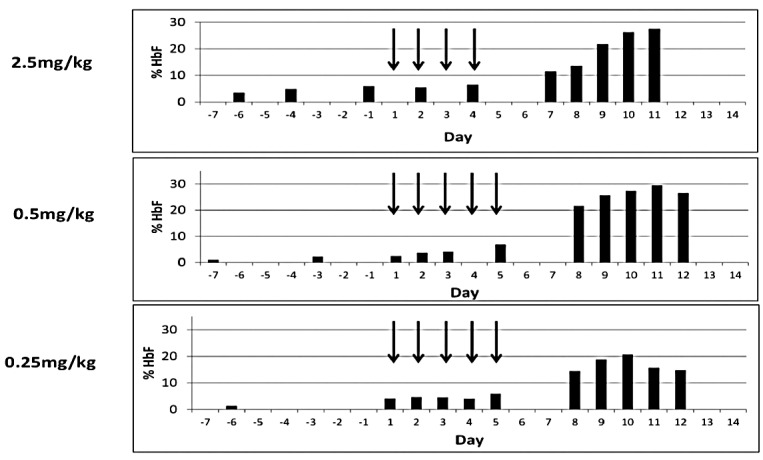
Effect of RN-1 on hemoglobin F in anemic baboons. Three individual anemic baboons were treated with varying doses of RN-1 as indicated by subcutaneous injection (arrows correspond to treatment days). HbF levels were determined by alkali denaturation on the indicated days.
Figure 3.
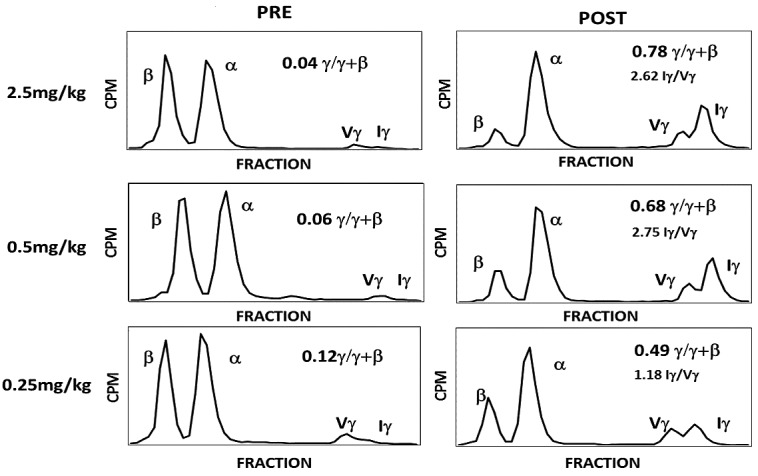
Effect of RN-1 on globin chain synthesis in anemic baboons. Globin chain synthesis in reticulocytes of 3 baboons pre and post treatment with varying doses of RN-1 was measured by biosynthetic radiolabeling with [3H] leucine followed by HPLC separation of globin chains.
Figure 4.
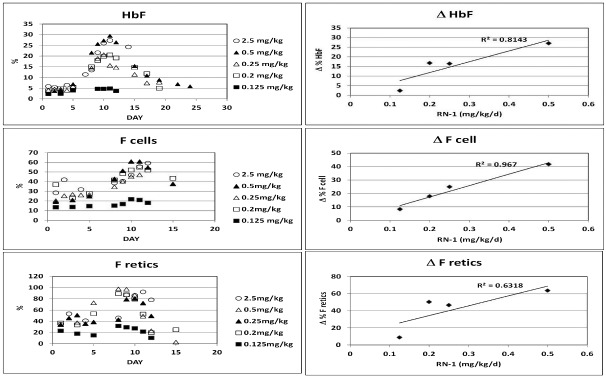
Effect of RN-1 on HbF, F cells, and F reticulocytes. Five baboons were treated with varying doses of RN-1 (0.125–2.5 mg/kg/d) for five days (days 1–5). (Left) Changes in HbF, F cells, and F reticulocytes in treated baboons. (Right) Relationship between the change in HbF, F cells, and F reticulocytes and RN-1 dose (maximal value post-treatment - pre-treatment value).
Figure 5.
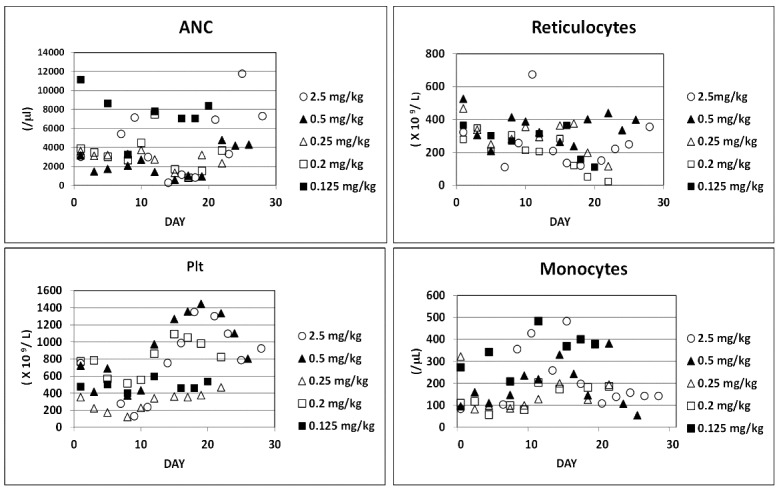
Effect of RN-1 on hematologic parameters. Five baboons were treated with varying doses of RN-1 (0.125–2.5 mg/kg/d) for five days (days 1–5). Changes in neutrophils (ANC), monocytes, platelets (Plt), and reticulocytes are shown.
These experiments defined a linear dose relationship between HbF, F cells, and F reticulocytes and RN-1 dose within the 0.125 to 0.5 mg/kg range (Figure 4). Dose-related decreases in ANC were also observed (Figure 5 and Online Supplementary Figure S1). Dose-dependent decreases in platelets 8–9d following the initial RN-1 treatment were followed by thrombocytosis peaking 15–20d after the initial dose (Figure 5 and Online Supplementary Figure S1). In addition, dose-dependent increases in monocytes were observed that peaked 15–17d following the initial drug dose (Figure 5 and Online Supplementary Figure S1). Increases in mean corpuscular volume (MCV) were observed at the higher RN-1 doses coinciding with the day of maximal HbF levels (Online Supplementary Figure S2A) and mean corpuscular hemoglobin concentration (MCHC) levels were decreased at all doses (Online Supplementary Figure S2B). Significant increases in HbF were observed at lower doses of RN-1 that were not associated with large increases in MCV (Online Supplementary Figure S2C).
In an effort to achieve significant increases in HbF in the absence of neutropenia, PA8549 was re-treated with a dose of 0.125 mg/kg for 10d (Online Supplementary Table S2, Exp. 6). The HbF increased from 3.6% on the first day of treatment to 16% 5d after the last injection. F cells increased from 17.6% to 42.7% and observed, however, F reticulocytes from 21% to 70%. Peak γ-globin chain synthesis (γ/γ+β) was 0.22. Decreases in ANC were still observed however, with an ANC nadir of 0.87×10/9L. Two other experiments were performed to test the effects of a 2d per week dose schedule. When PA8000 was treated with 0.25 mg/kg (Online Supplementary Table S2, Exp. 7), HbF increased from 4.7% to 10.4%, F cells from 18.2% to 28.1%, and F reticulocytes from 29.2 to 52.2% associated with an ANC nadir of 2.36×10/9L, indicating that significant increases in HbF could be attained with this schedule and dose in the absence of neutrophil toxicity. When the dose was increased to 0.5 mg/kg at the 2d per week dose schedule in another animal (PA8549) HbF increased from 6.2% to 22.1%, F cells from 22.2% to 53.6%, and F reticulocytes from 24.1 to 86.4%, however an ANC nadir of 0.57×10/9L was observed (Online Supplementary Table S2, Exp. 8).
The effect of RN-1 on globin mRNAs was determined in pre-and post-treatment peripheral blood samples in 3 animals treated with different doses (Online Supplementary Table S3). RN-1 treatment increased the level of γ-globin mRNA nearly 5-fold (P<0.05) in post-treatment samples (0.39+0.12 γ/ε+γ+β) compared to pre-treatment samples (0.08+0.01 γ/ε+γ+β), while levels of ε-globin mRNA remained low.
Effect of RN-1 on histone modifications
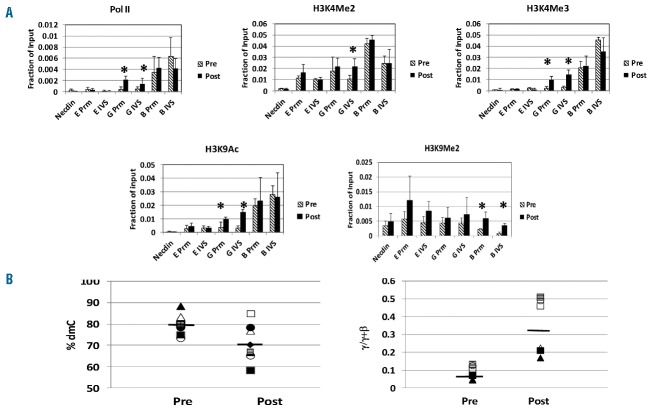
To investigate the mechanism of action of RN-1, chromatin immunoprecipitation (ChIP) assays were performed to determine the effect of the drug on histone acetylation and methylation associated with the e-, γ-, and β-globin genes. For these experiments, anemic baboons (n=4) were treated for 2d with RN-1 (0.5 or 0.25 mg/kg/d). Bone marrow (BM) erythroid cells were purified by immunomagnetic column selection of bone marrow samples obtained pre-treatment from bled baboons and post-treatment 48–72 h after the last dose of drug. Levels of pol II, histone H3K4Me2, H3K4Me3, H3K9Ac, and H3K9Me2 associated with the e-, γ-, and β-globin promoter and IVS II regions were measured by real-time PCR in DNA samples obtained from formaldehyde fixed, immunoprecipitated chromatin of purified BM erythroid cells (Figure 6A). Increased levels of pol II associated with the γ-globin promoter (4.7-fold; P<0.02) and γ-globin IVS II region (3.2-fold; P<0.05) were observed. Levels of H3K9Ac were also increased at the γ-globin promoter (6.2-fold; P<0.01) and γ-globin IVS II regions (4.2-fold; P<0.02). Histone H3K4Me2 levels were increased at the γ-globin IVS II (2.1-fold; P<0.05) but not at the γ-globin promoter while H3K4Me3 levels were increased at both the γ-globin promoter (4.7-fold; P<0.02) and at the γ-globin IVS II region (4.6-fold; P<0.02). No significant differences in the levels of these modifications at the e- and β-globin promoter and IVS regions were observed between pre- and post-treatment samples. Levels of Histone H3K9Me2 were increased at the β-globin promoter (2.8-fold; P<0.02) and IVS II region (5.3-fold; P<0.01) in post-treatment samples.
Figure 6.
Effect of RN-1 on histone modifications and γ-globin promoter DNA methylation. (A) ChIP analysis of levels of pol II, Histone H3K4Me2, H3K4Me3, H3K9Ac, and H3K9Me2 associated with the ε-, γ-, and β-globin promoters and IVS regions in purified bone marrow (BM) erythroid cells from RN-1 treated baboon pre and post treatment. Anemic baboons were treated with 0.5 mg/kg/d RN-1 for 2d and BM aspirates were obtained 48 h following the last RN-1 treatment. Asterisks (*) designate significant differences (P<0.05) between pre- and post-treatment samples. (B) (Left) Levels of cytosine methylation at three non-polymorphic CPG residues in the 5′ γ-globin promoter region in purified BM erythroid cells from RN-1 treated baboons pre and post treatment. Paired pre and post treatment samples from individual baboons are shown. The horizontal bar shows the mean % dmC value of all samples. Anemic baboons were treated with either 0.5 mg/kg/d (filled triangles, filled squares, filled circles, filled diamonds, lined squares) or 0.25 mg/kg/d (open triangles, open circles). (Right) Changes in γ-globin synthesis in peripheral blood reticulocytes of baboons pre and post treatment. Paired pre and post treatment samples from each individual are shown. The horizontal bar shows the mean level of γ-globin synthesis (γ/γ+β) of all samples.
Effect of RN-1 on DNA methylation
Bisulfite sequence analysis of the baboon 5′ γ-globin promoter region in DNA isolated from erythroid precursors purified from BM aspirates obtained pre- and post-treatment from 7 baboons treated with varying doses of RN-1 (0.125–0.5 mg/kg/d) was performed to investigate whether increased γ-globin expression in RN-1 treated baboons was associated with loss of DNA methylation. The level of DNA methylation of five CpG residues within this region located at −54, −51, +5, +16 and +48 with respect to the transcription start site in purified erythroid precursors of post-treatment BM samples (0.80+0.05% dmC) was reduced compared to pre-treatment samples (0.73+0.09% dmC; P=0.053). CpG residues at −51 and +16 are polymorphic in the baboon with G to A transitions eliminating the CpG site. Further analysis of only the 3 non-polymorphic CpG sites within the 5′ γ-globin promoter region at −54, +5, and −48 confirmed a small but significant (P<0.05) decrease in the level of DNA methylation in post-treatment (0.79+0.05% dmC) compared to pretreatment samples (0.71+0.09% dmC; P<0.05); (Figure 6B). Measurement of globin chain synthesis in peripheral blood reticulocytes in 6 of these baboons showed increased γ-globin synthesis in post-treatment (0.032+0.15 γ/γ+β) compared to pre-treatment samples (0.09+0.04 γ/γ+β; P<0.01); (Figure 6B).
Effect of RN-1 in non-anemic baboons
To investigate whether the effect of RN-1 on γ-globin expression required erythroid expansion, additional experiments were conducted in normal, non-anemic baboons. In the first experiment, treatment of PA8549 with RN-1 (0.5 mg/kg/d; 5d) increased HbF synthesis in peripheral blood reticulocytes from 0.03 γ/γ+β pre treatment to 0.71 post treatment (Figure 7 and Online Supplementary Table S4, Exp. 9). Neutropenia was not observed. In the second experiment a reduced dose of RN-1 (0.25 mg/kg/d; 5d) administered to PA8549 increased γ-globin synthesis in peripheral blood reticulocytes from 0.015 γ/γ+β pre-treatment to 0.26 post-treatment (Figure 7 and Online Supplementary Table S4, Exp. 10) while again neutropenia was not observed. In the third experiment this same RN-1 dose (0.25 mg/kg/d; 5d/wk) given for two weeks to PA8698 increased γ-globin synthesis to 0.24 γ/γ+β (Figure 7 and Online Supplementary Table S4, Exp. 11). F cells increased more than 4-fold from 2.0% pre treatment to 9.2% post treatment. A transient decrease in ANC to less than 1.5×10⁹/L (1.21) was observed. To investigate the effect of a longer term treatment schedule, PA8696 was treated with RN-1 (0.2–0.25 mg/kg/d) for a period of ten weeks (Online Supplementary Table S4, Exp. 12) while 2 other animals (PA8695 and P8698, Online Supplementary Table S4, Exp. 13 and 14) were treated with 0.25 mg/kg/d RN-1 for six weeks. Increased F cells were observed in all animals and ranged from 5- to 8-fold (Figure 8 and Online Supplementary Table S4). HbF levels increased 3–4-fold in all animals (Figure 8 and Online Supplementary Table S4). Within the F-cell populations of the 3 baboons, the HbF levels rose more than 3-fold (Online Supplementary Figure S3). Importantly, these increases in HbF levels and F cells were associated with minimal neutropenia that resolved quickly (Online Supplementary Table S4 and Figure S4). In all 3 non-anemic animals treated for either ten or six weeks, increases in monocytes and decreases in platelets were also observed (Online Supplementary Figure S4). Treatment of these non-anemic animals was not associated with changes in MCV or in MCHC (Online Supplementary Figure S5).
Figure 7.
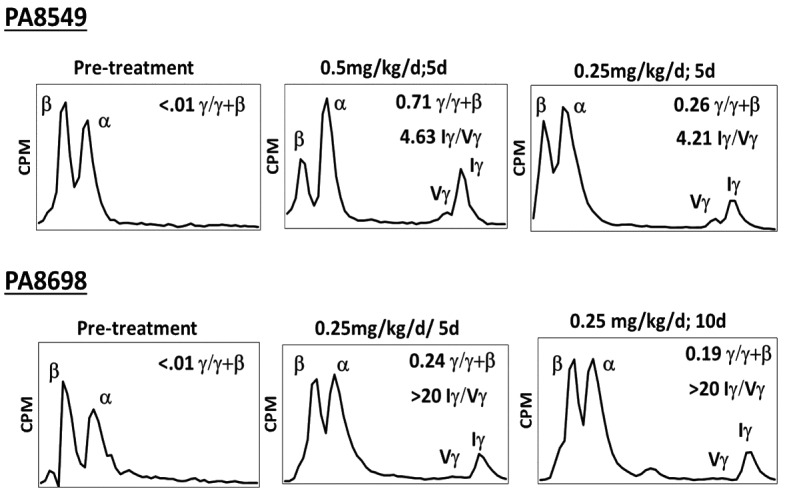
Effect of RN-1 on globin chain synthesis in non-anemic baboons. HPLC analysis of globin chain synthesis in peripheral blood reticulocytes of normal, non-anemic baboons treated with varying doses of RN-1 pre treatment and post treatment. (Top) Effect of RN-1 on globin chain synthesis in peripheral blood reticulocytes of PA8549. This baboon was treated in two separate experiments for five days with RN-1 (0.5 mg/kg/d or 0.25 mg/kg/d). Pre-treatment and post-treatment values at each dose are shown. (Bottom) Effect of RN-1 on globin chain synthesis of peripheral blood reticulocytes of PA8698. The baboon was treated with RN-1 (0.25 mg/kg/d; 10d). Analysis of chain synthesis pre treatment and following five days and ten days of treatment are shown.
Figure 8.
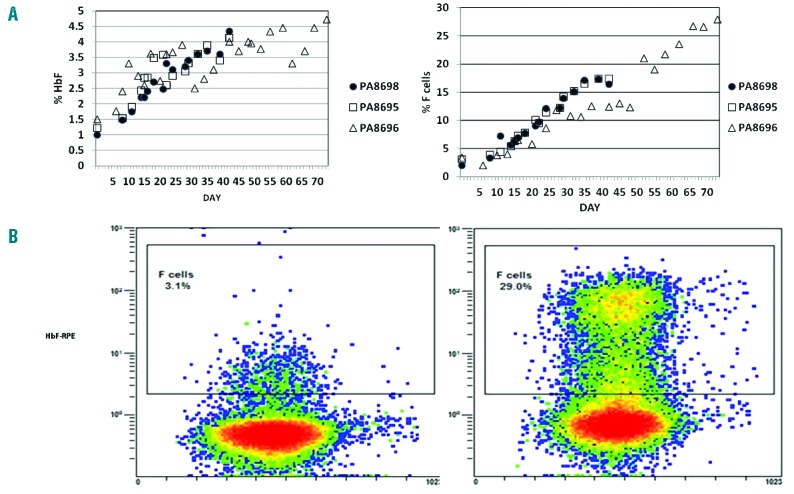
Effect of RN-1 on HbF and F cells in non-anemic baboons treated with RN-1. (A) Effect of RN-1 on HbF (left) and F cells (right) in 3 non-anemic baboons. PA8696 was treated for ten weeks (0.2–0.25 mg/kg/d; 5d/wk; sc). PA8698 and PA8695 were treated for six weeks (0.25 mg/kg/d; 5d/week/sc). (B) Flow cytometric analysis of F cells and F reticulocytes on d1 and d70 following RN-1 treatment in a non-anemic baboon (PA8696).
Discussion
Treatment of baboons with the LSD-1 inhibitor RN-1 substantially increased HbF, F cells and γ-globin synthesis in peripheral blood reticulocytes. The results confirm and extend our previous studies in the sickle cell mouse model showing that RN-1 increased F cells, F reticulocytes, and γ-globin mRNA to levels similar to decitabine, the most potent HbF-inducer known.32,33 However, both these drugs elicit only small increases of γ-globin expression in the SCD mouse model compared to the magnitude observed in baboons, emphasizing the importance of using nonhuman primate, such as baboons, to test the effect of HbF-inducing drugs.
Comparison of the level of γ-globin synthesis in RN-1-treated baboons with previous results from our laboratory of baboons treated with DNMT inhibitors3–5,12,38,40–42 shows that the HbF-inducing activity of RN-1 in the baboon model is comparable to DNMT inhibitors. In addition, RN-1 treatment of baboons resulted in the complete reversion of the pattern of synthesis of the individual 5′ Iγ - and 3′ Vγ-globin genes (Iγ/Vγ ratio) to that characteristic of fetal development in anemic baboons, an effect only partially achieved by DNMT1 inhibitors.4 The preferential effect of RN-1 on expression of the 5′ Iγ-globin gene was even greater in the non-anemic animals.
This effect has not been previously observed and appears to be a property unique to RN-1. The induction of HbF in the absence of changes in total β-like globin production (α/β ratio) and MCV in the treated animals suggests that increased γ-globin expression results from a direct effect of the drug on the repressive chromatin environment of the γ-globin gene, consistent with previous mechanistic studies, demonstrating a critical role for LSD-1 in mediating γ-globin repression,31 although effects elicited through alteration of erythroid differentiation kinetics cannot be excluded. Further experiments will be required to determine the mechanism of action of RN-1 in vivo. ChIP experiments showing RN-1 increased levels of H3K4Me2, H3K4Me3 and H3K9ac associated with the γ-globin but not the e-globin gene suggest a specific effect of the drug on γ-globin expression and are consistent with previous studies in AML cell lines showing that LSD1 inhibition did not induce genome-wide changes in H3K4Me2 but rather acted only at a specific subset of genes.43 The lack of effect of RN-1 on e-globin expression in the baboon contrasts with increases in Ey and βh1 observed in the SCD mouse model. It is possible that this difference is dose-related and that the ε-globin gene is less sensitive to de-repression by RN-1 because the ε-globin promoter contains two DR elements that bind DRED with higher affinity than the single DR1 element in the γ-globin promoter.22–24 LSD1 demethylates other proteins including DNMT1. Demethylation of DNMT1 by LSD1 increases DNMT1 stability while targeted deletion of LSD1 results in loss of DNMT1 and DNA demethylation in ES cells.44 In this regard, we observed small effects on γ-globin promoter DNA methylation in BM erythroid cells from RN-1-treated baboons that were significantly less than changes previously observed in decitabine-treated baboons. DNA methylation changes are, therefore, not likely to be the major mechanism responsible for increased HbF levels in RN-1 treated baboons, although these small changes in DNA methylation could have contributed, in part, to the magnitude of the HbF response.
Because RN-1 is not covalently incorporated into DNA (as are decitabine and 5-azacytidine), it is potentially a less genotoxic and safer drug. The clinical usefulness of RN-1 will likely depend on the design of a dose and schedule that limit its undesirable effects on other hematopoietic lineages. The anemic baboon was initially developed and has been traditionally used to model the anemia and reticulocytosis observed in SCD.12 In this model, anemia produced by repeated phlebotomies results in a near-complete replacement of the erythrocyte population within a 2-week period, removal of all formed elements, and alterations in levels of multiple cytokines in addition to erythropoietin.45 To complement studies in anemic baboons, experiments were also performed in non-anemic animals where base-line hematopoiesis was not perturbed. The neutropenia observed in phlebotomized baboons was lessened in non-anemic animals where ANC over 1.5×10⁹/L were generally maintained. The greater decreases in ANC in anemic animals may be due to depletion of neutrophils by repeated phlebotomies or the effect of these phlebotomies on growth factor levels. Decreased platelets and increased monocyte counts were observed in both the anemic and non-anemic animals, and are likely due to effects of the drug on hematopoietic differentiation. In an LSD1 conditional knockdown mouse model, expansion of granulocytic, erythroid, and megakaryocytic progenitors was observed, while granulopoiesis, erythropoiesis, and platelet production was inhibited, suggesting that the similar effects observed in RN-1-treated baboons are due to inhibition of LSD1 activity.30 RN-1 has been reported to affect long-term memory in mice and, therefore, this may be an additional possible adverse effect of the drug.46
Our results show that the LSD1 inhibitor RN-1 induces high levels of HbF in baboons and are consistent with previous studies showing that LSD1 plays a critical role in γ-globin silencing as a component of the DRED complex.25,31 However, the possibility of a role for perturbation of erythroid differentiation in the mechanism of HbF reactivation cannot be excluded, and the in vivo mechanism of action will be investigated in future studies. The level of the HbF response varies between different baboon species,47 and, therefore, the HbF response in man and baboons may differ somewhat due to differences between species and/or physiological differences between the experimental animal model and patients with hemoglobinopathies. However, results in P. anubis are generally predictive of HbF-inducing effects in man and have been successfully translated in clinical studies in SCD and β-thalassemia patients.13–18 Therefore, we suggest that RN-1 and/or other LSD1 inhibitors are excellent candidates for clinical evaluation as therapeutic agents in β-thalassemia and sickle cell disease.
Footnotes
Check the online version for the most updated information on this article, online supplements, and information on authorship & disclosures: www.haematologica.org/content/101/6/688
Funding
This work was supported by NIH U01 HL117658 and NIH R01 HL114561.
References
- 1.Stamatoyannopoulos G. Molecular and cellular basis of hemoglobin switching. In: Steinberg MH, Forget BG, Higgs DR, Nagel RL, eds. Disorders of Hemoglobin: Genetics, Pathophysiology, and Clinical Management. Cambridge: Cambridge University Press; 2001, p. 131–145. [Google Scholar]
- 2.Barrie PA, Jeffreys AJ, Scott AF. Evolution of the beta-globin gene cluster in man and primates. J Mol Biol. 1981;149(3):319–336. [DOI] [PubMed] [Google Scholar]
- 3.DeSimone J, Mueller AL. Fetal hemoglobin synthesis in baboons. (Papio cynocephalus). J Lab Clin Med. 1979;91(6):862–871. [PubMed] [Google Scholar]
- 4.Schroeder WA, DeSimone J, Shelton JB, et al. Changes in the gamma chain heterogeneity of hemoglobin F of the baboon (Papio cynocephalus) postnatally and after partial switching to hemoglobin F production by various stimuli. J Biol Chem. 1983; 258(5):3121–3125. [PubMed] [Google Scholar]
- 5.Chin J, Singh M, Banzon V, et al. Transcriptional activation of the gamma-globin gene in baboons treated with decitabine and in cultured erythroid progenitor cells involves different mechanisms. Exp Hematol. 2009;37(10):1131–1142. [DOI] [PMC free article] [PubMed] [Google Scholar]
- 6.Ingram VM. Gene mutations in human hemoglobin: the chemical difference between normal and sickle hemoglobin. Nature. 1957;275(4581):238–240. [DOI] [PubMed] [Google Scholar]
- 7.Sunshine HR, Hofrichter J, Eaton WA. Requirement for therapeutic inhibition of sickle haemoglobin gelation. Nature. 1978;275(5677):238–240. [DOI] [PubMed] [Google Scholar]
- 8.Platt OS, Thorington BD, Brambilla DJ, et al. Pain in sickle cell disease. Rates and risk factors. N Engl J Med. 1991;325(1):11–16. [DOI] [PubMed] [Google Scholar]
- 9.Platt OS, Brambilla DJ, Rosse WF, et al. Mortality in sickle cell disease. Life expectancy and risk factors for early death. N Engl J Med. 1984;330(23):1639–1644. [DOI] [PubMed] [Google Scholar]
- 10.Tagle DA, Koop BF, Goodman M, et al. Embryonic epsilon and gamma globin genes of a prosimian primate (Galago crassicaudatus) Nucleotide and amino acid sequences, developmental regulation and phylogenetic footprints. J Mol Biol. 203(2):439–455. [DOI] [PubMed] [Google Scholar]
- 11.Schechter AN. Hemoglobin research and the origins of molecular biology. Blood. 2008;112(10):3927–3938. [DOI] [PMC free article] [PubMed] [Google Scholar]
- 12.DeSimone J, Heller PH, Hall L, Zwiers D. 5-azacytidine stimulates fetal hemoglobin synthesis in anemic baboons. Proc Natl Acad Sci USA. 1982;79(14):4428–4431. [DOI] [PMC free article] [PubMed] [Google Scholar]
- 13.Ley TJ, DeSimone J, Noguchi CT, et al. 5-azacytidine increases gamma-globin synthesis and reduces the proportion of dense cells in patients with sickle cell anemia. Blood. 1983;62(2):370–380. [PubMed] [Google Scholar]
- 14.Ley TJ, DeSimone J, Anagnou NP, et al. 5-azacytidine selectively increases synthesis in a patient with beta+ thalassemia. N Engl J Med. 1982;307(24):1469–1475. [DOI] [PubMed] [Google Scholar]
- 15.Lowrey CH, Nienhuis AW. Brief report; treatment with azacitidine of patients with end-stage beta-thalassemia. N Engl J Med. 1993;329(12):845–848. [DOI] [PubMed] [Google Scholar]
- 16.Koshy M, Dorn L, Bressler L, et al. 2-deoxy 5-azacytidine and fetal hemoglobin induction in sickle cell anemia. Blood. 2000;96(7):2379–2384. [PubMed] [Google Scholar]
- 17.DeSimone J, Koshy M, Dorn L, et al. Maintenance of elevated fetal hemoglobin levels by decitabine during dose interval treatment of sickle cell anemia. Blood. 2002;99(11):3905–3908. [DOI] [PubMed] [Google Scholar]
- 18.Saunthararajah Y, Hillery CA, Lavelle D, et al. Effects of 5-aza-2′-deoxycytidine on fetal hemoglobin levels, red cell adhesion, and hematopoietic differentiation. Blood. 2003;102(12):3865–3870. [DOI] [PubMed] [Google Scholar]
- 19.Lavelle D, Vaitkus K, Ling Y, et al. Effects of tetrahydrouridine on pharmacokinetics and pharmacodynamics of oral decitabine. Blood. 2012;119(5): 1240–1247. [DOI] [PMC free article] [PubMed] [Google Scholar]
- 20.Letvin NL, Linch DC, Beardsley GP, et al. Augmentation of fetal-hemoglobin production in anemic monkeys by hydroxyurea. N Engl J Med. 1984;310(14):869–873. [DOI] [PubMed] [Google Scholar]
- 21.Charache S, Terrin ML, Moore RD, et al. Effect of hydroxyurea on the frequency of painful crises in sickle cell anemia. Investigators of the Multicenter Study of Hydroxyurea in Sickle Cell Anemia. N Engl J Med. 1995;332(20):1317–1322. [DOI] [PubMed] [Google Scholar]
- 22.Suzuki M, Yamamoto M, Engel JD. Fetal globin gene repressors as drug targets for molecular therapies to treat the beta-globinopathies. Mol Cell Biol. 2014; 34(19):3560–3569. [DOI] [PMC free article] [PubMed] [Google Scholar]
- 23.Tanabe O, Katsuoka F, Campbell AD, et al. An embryonic/fetal beta-type globin gene repressor contains a nuclear receptor TR2/TR4 heterodimer. EMBO J. 2002; 21(13):3434–3442. [DOI] [PMC free article] [PubMed] [Google Scholar]
- 24.Tanabe O, McPhee D, Kobayashi S, et al. Embryonic and fetal beta-globin gene repression by the orphan nuclear receptors, TR2 and TR4. EMBO J. 2007;26(9):2295–2306. [DOI] [PMC free article] [PubMed] [Google Scholar]
- 25.Cui S, Kolodziej KE, Obara N, et al. Nuclear receptors TR2 and TR4 recruit multiple epigenetic transcriptional corepressors that associate specifically with the embryonic beta-type globin promoters in differentiated adult erythroid cells. Mol Cell Biol. 2011;31(16):3298–3311. [DOI] [PMC free article] [PubMed] [Google Scholar]
- 26.Sankaran VG, Menne TF, Xu J, et al. Human fetal hemoglobin expression is regulated by the developmental stage-specific repressor BCL11A. Science. 2008;322(5909):1839–1842. [DOI] [PubMed] [Google Scholar]
- 27.Xu J, Bauer DE, Kerenyi MA, et al. Corepressor-dependent silencing of fetal hemoglobin expression by BCL11A. Proc Natl Acad Sci USA. 2013;110(16):6518–6523. [DOI] [PMC free article] [PubMed] [Google Scholar]
- 28.Amente S, Lania L, Majello B. The histone LSD1 demethylase in stemness and cancer transcription programs. Biochim Biophys Acta. 2013;1829(10):981–986. [DOI] [PubMed] [Google Scholar]
- 29.Kereni MA, Shao Z, Hsu YJ, et al. Histone demethylase Lsd1 represses hematopoietic stem and progenitor cell signatures during blood cell maturation. Elife. 2013;2:e00633. [DOI] [PMC free article] [PubMed] [Google Scholar]
- 30.Sprussel A, Schulte JH, Weber S, et al. Lysine-specific demethylase 1 restricts hematopoietic stem and progenitor proliferation and is essential for terminal differentiation. Leukemia. 2012;26(9):2039–2051. [DOI] [PubMed] [Google Scholar]
- 31.Shi L, Cui S, Engel JD, Tanabe O. Lysine-specific demethylase 1 is a therapeutic target for fetal hemoglobin induction. Nat Med. 2013;19(3):291–304. [DOI] [PMC free article] [PubMed] [Google Scholar]
- 32.Rivers A, Vaitkus K, Ruiz MA, et al. RN-1, a potent and selective lysine-specific demethylase 1 inhibitor, increases -globin expression, F reticulocytes, and F cells in a sickle cell disease mouse model. Exp Hematol. 2015;43(7):546–553. [DOI] [PMC free article] [PubMed] [Google Scholar]
- 33.Cui S, Lim KC, Shi L, et al. The LSD1 inhibitor RN-1 induces fetal hemoglobin synthesis and reduces disease pathology in sickle cell mice. Blood. 2015;26(3):386–396. [DOI] [PMC free article] [PubMed] [Google Scholar]
- 34.Singer K, Chernoff AI, Singer L. Studies on abnormal hemoglobins. I. Their demonstration in sickle cell anemia and other hematologic disorders by means of alkali denaturation. Blood. 1951;6(5):413–428. [PubMed] [Google Scholar]
- 35.Banzon V, Ibanez V, Vaitkus K, et al. siDNMT1 increases gamma-globin expression in chemical inducer of dimerization (CID)-dependent mouse betaYAC bone marrow cells and in baboon erythroid progenitor cell cultures. Exp Hematol. 2011;39(1):26–36. [DOI] [PMC free article] [PubMed] [Google Scholar]
- 36.Alderman EM, Fudenberg HH, Lovins RE. Binding of immunoglobulin classes to subpopulations of human red blood cells separated by density-gradient centrifugation. Blood. 1980;55(5):817–822. [PubMed] [Google Scholar]
- 37.Leone L, Monteleone M, Gabiutti V, Amione C. Reversed-phase high-performance liquid chromatography of human haemoglobin chains. J Chromatogr. 1985; 321(2):407–419. [DOI] [PubMed] [Google Scholar]
- 38.Akpan I, Banzon V, Ibanez V, Vaitkus K, DeSimone J, Lavelle D. Decitabine increases fetal hemoglobin in Papio Anubis by increasing gamma-globin gene transcription. Exp Hematol. 2010;38(11):989–993. [DOI] [PMC free article] [PubMed] [Google Scholar]
- 39.Lavelle D, Vaitkus K, Hankewych M, Singh M, DeSimone J. Developmental changes in DNA methylation and covalent histone modifications of chromatin associated with the epsilon-, gamma-, and beta-globin promoters in Papio anubis. Blood Cells Mol Dis. 2006;36(2):269–278. [DOI] [PubMed] [Google Scholar]
- 40.Lavelle D, DeSimone J, Heller P, Zwiers D, Hall L. On the mechanism of HbF elevations in the baboon by erythropoietic stress and pharmacologic manipulation. Blood. 1986;67(4):1083–1089. [PubMed] [Google Scholar]
- 41.Lavelle D, Chin J, Vaitkus K, et al. Oral decitabine reactivates expression of the methylated gamma-globin gene in Papio anubis. Am J Hematol. 2007;82(11):981–985. [DOI] [PubMed] [Google Scholar]
- 42.Lavelle D, Saunthararajah Y, Vaitkus K, et al. S110, a novel decitabine dinucleotide, increases fetal hemoglobin levels in baboons (P. Anubis). J Transl Med. 2010; 8:92. [DOI] [PMC free article] [PubMed] [Google Scholar]
- 43.Schenk T, Chen WC, Gollner S, et al. Inhibition of the LSD1 (KDM1A) demethylase reactivates the all-trans-retinoic acid differentiation pathway in acute myeloid leukemia. Nat Med. 2012;18(4):605–611. [DOI] [PMC free article] [PubMed] [Google Scholar]
- 44.Wang J, Hevi S, Kurash JK, et al. The lysine demethylase LSD1 (KDM1) is required for maintenance of global DNA methylation. Nat Genet. 2009;41(1):125–129. [DOI] [PubMed] [Google Scholar]
- 45.Abraham E. Effects of stress on cytokine production. Methods Achiev Exp Pathol. 1991;14:45–62. [PubMed] [Google Scholar]
- 46.Neelamegam R, Ricq EL, Malvaez M, et al. Brain-penetrant LSD1 inhibitors can block memory consolidation. ACS Chem Neurosci. 2012;3(2):120–128. [DOI] [PMC free article] [PubMed] [Google Scholar]
- 47.DeSimone J, Schroeder WA, Shelton JB, et al. Speciation in the baboon and its relation to gamma-chain heterogeneity and to the response to induction of HbF by 5-azacytidine. Blood. 1984;63(5):1088–1095. [PubMed] [Google Scholar]


