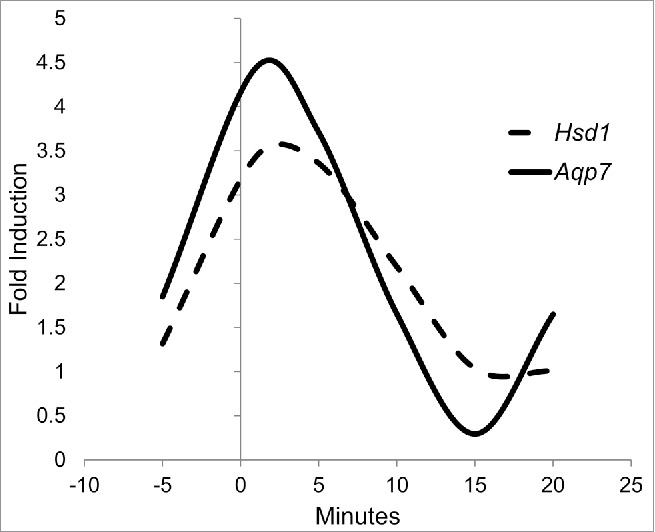
Figure 4.

3T3-L1 cell line precursors were differentiated and subsequently treated during 0, 5, 10, 15 and 20 min with different cortisone concentrations (0, 0.1, 1, and 10 µM). Because 1 µM exhibited the greatest impact on the relative expression of both genes, we provide a quadratic response curve for HSD1 expression (dashed line) and AQP7 (continuous line). Data represent mean P < 0.05 (n = 3).
