

Abstract
Several theories of phospholipid homeostasis have postulated that cells regulate the molecular composition of their bilayer membranes, such that a common biophysical membrane parameter is under homeostatic control. Two commonly cited theories are the intrinsic curvature hypothesis, which states that cells control membrane curvature elastic stress, and the theory of homeoviscous adaptation, which postulates cells control acyl chain packing order (membrane order). In this paper, we present evidence from data-driven modelling studies that these two theories correlate in vivo. We estimate the curvature elastic stress of mammalian cells to be 4–7 × 10⁻¹² N, a value high enough to suggest that in mammalian cells the preservation of membrane order arises through a mechanism where membrane curvature elastic stress is controlled. These results emerge from analysing the molecular contribution of individual phospholipids to both membrane order and curvature elastic stress in nearly 500 cellular compositionally diverse lipidomes. Our model suggests that the de novo synthesis of lipids is the dominant mechanism by which cells control curvature elastic stress and hence membrane order in vivo. These results also suggest that cells can increase membrane curvature elastic stress disproportionately to membrane order by incorporating polyunsaturated fatty acids into lipids.
Keywords: data-driven modelling, lipid spontaneous curvature, intrinsic curvature hypothesis, homeoviscous adaptation, membrane order, membrane curvature elastic stress
1. Introduction
Theories of phospholipid homeostasis have arisen to explain long-standing observations that the steady-state phospholipid, cholesterol and protein composition of biological membranes changes in response to environmental conditions. For example chemicals, such as crude oil [1], PCB-153 [2], hydrocarbons, alcohols and detergents [3], fatty acids [4] and phospholipids [5], all cause changes to the lipid composition of biological membranes. Furthermore, the effects of temperature on biomembrane lipid composition are well documented in large numbers of animal species such as in poikilotherms [6], Archaea [7], zooplankton [8], fish [9,10], mammals [11,12] and plants [13] as discussed [14,15]. As it is well established in model membranes that different component lipids cause the collective lipid membrane to have different physical properties, the question ‘Which physical property are cells conserving in their biological membranes?’ arises.
In answer to this question, several theories have emerged. The theory of homeoviscous adaptation (HVA) suggests [16] that cells regulate the membrane order of their biological membranes, often described as regulation of membrane fluidity or membrane viscosity. In membranes, order is quantified through an order parameter ranging from 0 (disorder) to 1 (order) and typically calculated using electron spin resonance or fluorescence anisotropy of probes such as diphenylhexatriene [9,16]. The origin of HVA theory stems principally from the observations of Sinensky [16] who observed that the order parameter of Escherichia coli lipid membranes, determined by electron spin resonance, was unchanged despite the membranes having different lipid compositions at different temperatures. Over time a large number of other studies have shown that HVA, while initially formulated as a temperature-dependent response in bacteria, has a broader evolutionary significance [9,11]. For example, evidence suggests that membrane order is preserved by biological membranes in response to hydrostatic and osmotic pressure [10,17], low magnetic field strength [18] and chemicals [2,19], as discussed [14,15,20]. It has also become clear that lipids like cholesterol [21] play a critical role in regulating membrane order—or fluidity as it is commonly referred to in mammalian systems [22].
By contrast, the intrinsic curvature hypothesis [23] states that the intrinsic (or spontaneous) curvature of biological membranes is tightly regulated through membrane compositional change, maintaining membrane curvature elastic energy [24,25] within tight boundaries. The origin of this theory stems from observations that cells appear to maintain their membrane composition away from a phase transition, so-called homeophasic adaptation [26]. However, the fundamental observation that cells contain a large number of lipids that prefer to adopt curved non-bilayer structures led Gruner to postulate [23,27] that cells maintain the stored elastic energy that arises from curvature frustration constant. These are not the only theories of phospholipid homeostasis [28,29]; for example it has been suggested that cells regulate the surface charge of their biological membranes by controlling the concentration of negatively charged lipids [30].
In a broader context, altered lipid compositions are associated with a number of diseases such as cancer [31], obesity [32], Alzheimer's disease [33], liver disease [34] and type 2 diabetes [35]. Therefore, quantitative system models of cellular phospholipid homeostasis are critical to understanding these pathologies.
1.1. Cellular mechanisms of phospholipid homeostasis
The mechanism through which the lipid biosynthetic network detects membrane biophysical properties, and adjusts biomembrane composition accordingly, is not well elucidated. Data suggest some of the enzymes involved in lipid biosynthesis, such as CTP : phosphocholine cytidylyltransferase (CCT) [36] and phospholipases [37,38], are regulated by membrane curvature elastic energy and could form part of a regulation pathway [39]. Membrane curvature elastic energy has also been implicated in the mechanism of action of some antineoplastic agents [40,41]. By contrast, studies using labelled spin probes for electron spin resonance [16] or membrane fluorescence depolarization probes [9,11] have shown that membrane order in many biological membranes is preserved although membrane composition has changed [14,15,26]. There is evidence of the mechanism through which bacteria might control membrane order [42] but the precise pathways that eukaryotic cells use have not yet been discovered. However, Rho signalling [43] and a group VIA Ca2+ independent-phospholipase-A2 have been identified as significant [44]. Both biochemical and transcriptional mechanisms play a role in phospholipid homeostasis; in bacteria, this is better understood than in eukaryotes [28]. The sterol regulatory element-binding proteins (SREBPs) are a critical part of the transcriptional mechanism of mammalian lipid homeostasis. SREBPs, in response to the levels of fatty acids in a membrane, proteolytically release fragments that enter the nucleus and activate some of the genes required for lipid homeostasis [45].
Previously we have identified two different ratio control mechanisms that operate in phospholipid homeostasis at the biochemical level. One of these was a ratio control mechanism for membrane disorder inspired by HVA [20] and the other was a ratio control mechanism derived from the intrinsic curvature hypothesis [46,47]. Both these studies used the lipidomes of HL60 and HeLa cells to construct a systems-level insight into the collective properties of cellular membranes through data-driven modelling, summarized in §1.2.
1.2. Background: data-driven modelling with control functions in lipidomic datasets
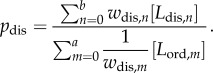
The central premise of the data-driven approach is to state that all the different lipid compositions that exist across a cell line represent different combinations of lipids with an identical value of the common biophysical parameter (membrane order or membrane curvature elastic stress in these studies). If this premise is true, then the individual lipid concentrations multiplied by a factor that corresponds to their individual, structure-specific, contribution (w) to the common biophysical parameter must give rise to a mathematical function where one set of w values gives the lowest variance, in the numerical solution to that function, across all the lipidomic datasets. Critically the magnitude of this variance, which we express as a statistical coefficient of variance (cv = 100% × (s.d./mean)), validates the hypothesis. As a rule of thumb, under conditions where there is no reason to expect the control function to vary across a set of cell populations (such as in the case of asynchronous cell populations), we consider that a cv of 10% or less suggests a control function is strongly evidenced. While cv values of between 10 and 20% demonstrate good evidence and cv values greater than 20% demonstrate no evidence. Mathematically, we formulate each of the two hypotheses as ratio control functions; equation (1.1) shows the ratio control function inspired by HVA, where pdis is in effect a proxy measure of membrane deviation from total order towards disorder:
 |
1.1 |
In formal terms equation (1.1) asks, given the set of all possible lipid species {L}, is there a universal pivot lipid species, Lpdis, that partitions L into subsets {Lord + Lpdis}, {Ldis} such that the mean value of pdis has the minimum variance across multiple cell populations?
In equation (1.1) [Ldis,n] denotes the concentration of lipid (typically moles per cell) that decreases membrane order, i.e. disordering lipids n and wdis,n is the weighting factor for disorder for lipid n. Similarly [Lord,m] is the concentration of lipid that increases order, i.e. ordering lipids m and wdis,m is the weighting factor for disorder for lipid m. The variables a and b are the total numbers of ordering and disordering lipids, respectively. We use a ratio control function because evidence has suggested that membrane order is regulated in vivo by the ratio of saturated to polyunsaturated fatty acids [11] present within the phospholipids constituting the cell membrane.
For the intrinsic curvature hypothesis, we use the same conventional ratio control function but replace Ldis and Lord with the terms LII and L0, where LII is the concentration of type II lipids, i.e. lipids that increase membrane stored elastic energy, and L0 is the concentration of type 0 lipids which decrease membrane stored elastic energy. We introduce the term pces as a proxy measure of membrane curvature elastic energy, calculated from equation (1.1) replacing wdis with wces, which is the individual lipid-weighting factor for curvature elastic stress. A ratio control function is used because it has been suggested that in vivo cells balance membrane stored elastic energy through controlling the ratio of type 0 to type II (or bilayer to non-bilayer forming lipids) [39].
1.3. Background: quantifying membrane stored elastic energy
Critical to understanding this work is the quantification of membrane stored elastic energy from the lipid radius of spontaneous curvature (R0), i.e. the unstressed radius of curvature of aggregated lipids. R0 is typically derived from inverse hexagonal lyotropic liquid crystal phases by small angle X-ray scattering [38] and related to the elastic free energy of bending (ΔGc) of a monolayer of surface area (A) by the Helfrich Hamiltonian [24]:
| 1.2 |
where, c1 (=1/R1) and c2 (=1/R2) are the principal curvatures at the interface (with the convention that a monolayer with negative curvature curves towards water), c0 (=1/R0) is the intrinsic (or spontaneous) curvature of the monolayer, κM is the mean curvature bending rigidity and κG is the Gaussian curvature modulus.
As it is not easy to obtain detailed information on the changing values of A, κM and κG for cells, we use curvature elastic stress (τ), equation (1.3), as a first order approximation of stored elastic energy:
| 1.3 |
Extensive details of how the control functions were parametrized and how the values of wces and wdis were obtained have been published previously [20,46], as summarized in §§2.1–2.3. Figure 1 provides an overview of control mechanisms in phospholipid homeostasis and the importance of developing quantitative models to understand the role of lipids in health and the environment.
Figure 1.

A schematic overview of how homeostatic control mechanisms might occur in phospholipid biosynthesis, showing the biophysical concepts of membrane order, spontaneous curvature and stored elastic energy. A simplified phospholipid biosynthetic pathway, where PC, PE, PI, PA, PS and DAG are phosphatidylcholine, phosphatidylethanolamine, phosphatidylinositol, phosphatidic acid, phosphatidylserine and diacylglycerol lipids, respectively, is also shown. Membrane bound proteins involved in lipid biosynthesis, which can sense and regulate the biophysical properties of the membrane, the environmental contributions to lipid composition and health implications of understanding lipid biosynthesis are also summarized.
1.4. Objectives
Our previous studies [20,46] gave two sets of coarse-grain parameters (wces and wdis) determined by data-driven modelling using the HL60 and HeLa cell lipidomes. These wces and wdis parameters can be substituted, with new lipidomic data, into equation (1.1) to give pdis and pces values for these new lipidomes. Our first objective is to determine if the control functions and parameters determined previously are valid in these new lipidomic datasets. Secondly, we evaluate the mechanisms by which both control functions might be maintained in vivo; a number of possibilities exist. There might, for example, be two separate control mechanisms, one for curvature elastic stress and one for membrane order. However, it is also possible that maintaining one of these membrane properties within tightly controlled boundaries automatically regulates the other membrane property, suggesting that membrane order and membrane curvature elastic stress are fundamentally entangled in vivo.
2. Material and methods
The lipidomes used in this study are derived from total cell extracts and have been published previously by various groups. Methodology through which control functions for membrane order [20] and the intrinsic curvature hypothesis [46] were parametrized is summarized in §§ 2.1–2.3.
We have published lipidomes of the HL60, HL60oleate (HL60 cells cultured in excess oleate), HeLa and HeLasync (synchronized HeLa) cells [20,46,47]. The LDLRmouse lipidome was obtained from thioglycolate-stimulated wild-type and low-density lipoprotein receptor knockout (LDLR(−/−)) mice maintained on normal and Western (high-fat, high cholesterol) diets [48]. Lipidomes of RAW 264.7 cells cultured with KDO lipid-A (RAW 264.7KDO), or compactin (RAW 264.7compactin) or BMDM cells treated with compactin or ATP (BMDMcompactin and BMDMATP, respectively) are freely available in the literature [48–50]. The lipidomes of MDCK cells [51] and human brain cells exhibiting Alzheimer's disease and control (NEUROAlz) [52] are also available.
2.1. Assumptions in the data-driven modelling
To construct these data-driven models a number of assumptions have to be made, as discussed previously [20,46], which fall into two groups. The first group comprises assumptions about the experimental (lipidomic) data and ultimately determine the identity and diversity of the set of lipid species {L}. The second group comprises assumptions about the biophysics of the control mechanisms and dictate the form of the control function and how the w terms are constructed.
Assumptions deriving from the experimental data are that:
A. The lipid species (PC, PE, PS, PA, PI, DAG) used in the control functions represent greater than 90% of the total phospholipid composition of whole cells.
B. Where isomeric or isobaric lipid species exist, all the lipids are assigned the dominant lipid identity.
C. The identity of lipid species can be assigned from the likely distribution of unsaturations, which is accomplished using the fatty acid species that predominate in mammalian cell lipidomes, i.e. the 14 : 0, 16 : 0, 16 : 1, 18 : 0, 18 : 1, 18 : 2, 18 : 3, 20 : 4, 20 : 5, 22 : 5, 22 : 6 fatty acids [53].
Assumption C is necessary because many of the lipidomes used in this study report at the lipid species level, e.g. PC34 : 2, which does not allow individual fatty acid chain lengths or the distribution of unsaturation to be assigned. In general, lipid identity assignments based upon the distribution of unsaturations are straightforward because, for example, PC 36 : 1 will contain one saturated chain and one monounsaturated chain (referred to as PC 0 : 1 in our models) and PC 36 : 2 will predominantly be PC 1 : 1 rather than PC 0 : 2 (due to the greater predominance of the 18 : 1 fatty acid).
Assumptions that dictate the form of the control functions and how the w terms are constructed are in part driven by the available lipidomic data but are also determined by current knowledge in membrane biophysics. These assumptions are that:
D. The chain length of the individual fatty acid chains has no effect on membrane order or spontaneous curvature, which arises directly from assumption C.
E. Control functions can be expressed as ratios where the individual lipids contribute to the collective numerator and denominator terms through ideal linear mixing.
F. Curvature elastic stress increases with the number of lipid unsaturations and with lipid headgroup such that PS < PC < PI < PE < PA < DAG (for identical chain lengths), based on individual lipid contributions to membrane curvature elastic stress estimated from values of each lipid's spontaneous curvature [46].
G. Membrane disorder increases with the number of lipid unsaturations and with lipid headgroup such that PA < PE < PS < PC < PI < DAG, ranked using in vitro trends in individual lipid Tm values, as discussed [20].
2.2. The origin of the terms wces, wdis and pivot species (Lp)
The parameters wces, wdis and pivot species (Lp) used to construct the control functions of the form shown in equation (1.1) were determined by a data-driven modelling approach using the HL60, HL60oleate and HeLa lipidomes. According to a set of rules that stem from assumptions F and G, values of w were constructed by random iteration and used to calculate pdis and pces. This approach was repeated using each lipid present in the HL60/HeLa lipidomes as the pivot lipid. The best sets of wces or wdis and pivot species were selected as those that gave the lowest variance in pdis or pces across all the cell populations [20,46] (reproduced in the electronic supplementary material, tables S1 and S2).
2.3. Determining the values of pdis and pces for new lipidomes
To calculate the values of pdis and pces for each lipidome in this study, the individual concentrations of each lipid species (L) for each population of cells (i.e. each experimental flask) were inputted into equation (1.1) along with the relevant value of wces or wdis for that lipid species and control function (from electronic supplementary material, tables S1 or S2). The mean average, standard deviation and coefficient of variance of pdis and pces were then determined for each lipidome.
3. Results and discussion
3.1. Control functions for membrane disorder and curvature elastic stress tested in new lipidomic datasets
The compositional abundance, statistical variance and origin of the lipidomes used in this study are shown in the electronic supplementary material, table S3, which shows very clearly that there is significant diversity across the lipidomes studied. This is important to note because without this diversity our results are not a significant development on our previous studies. Table 1 shows pdis and pces, their standard deviations and the cv for each lipidomic dataset. A brief discussion of the effects of lipid composition on pces and pdis is provided in the electronic supplementary material, section S1.1.
Table 1.
Mean values of pdis and pces and the resultant cv values for the different mammalian cell line lipidomes summarized in §§2.1–2.3.
| cell line |
n | mean | s.d. | cv (%) | mean (pdis/pces) | s.d. (pdis/pces) | |
|---|---|---|---|---|---|---|---|
| HL60oleate | pdis | 17 | 0.98 | 0.08 | 8.38 | 2.82 | 0.16 |
| pces | 0.35 | 0.03 | 9.89 | ||||
| HL60 | pdis | 16 | 0.71 | 0.07 | 10.46 | 2.42 | 0.25 |
| pces | 0.30 | 0.03 | 10.89 | ||||
| HeLa | pdis | 8 | 0.46 | 0.01 | 1.95 | 3.01 | 0.23 |
| pces | 0.15 | 0.01 | 9.49 | ||||
| LDLRmouse | pdis | 16 | 1.04 | 0.06 | 5.36 | 2.75 | 0.23 |
| pces | 0.38 | 0.04 | 9.65 | ||||
| BMDMATP | pdis | 87 | 0.82 | 0.14 | 17.46 | 2.92 | 0.26 |
| pces | 0.28 | 0.04 | 13.19 | ||||
| RAW 264.7compactin | pdis | 116 | 0.64 | 0.09 | 14.79 | 2.79 | 0.20 |
| pces | 0.23 | 0.04 | 17.26 | ||||
| BMDMcompactin | pdis | 87 | 0.92 | 0.18 | 19.40 | 2.92 | 0.19 |
| pces | 0.31 | 0.05 | 17.52 | ||||
| RAW 264.7KDO | pdis | 96 | 0.60 | 0.10 | 15.95 | 2.69 | 0.15 |
| pces | 0.23 | 0.04 | 17.99 | ||||
| HeLasynca | pdis | 18 | 0.44 | 0.07 | 16.30 | 3.01 | 0.39 |
| pces | 0.15 | 0.04 | 26.65 | ||||
| MDCKb | pdis | 0.69 | 0.15 | 21.24 | 3.45 | 0.22 | |
| pces | 0.20 | 0.04 | 18.59 | ||||
| NEUROAltzb | pdis | 0.75 | 0.05 | 6.92 | 3.35 | 0.13 | |
| pces | 0.23 | 0.02 | 10.20 | ||||
aThese cells are synchronized at the G1/S boundary.
bThe lipidome of these cells is reported as an average of three repeats.
In general, the magnitude of the cv of pces and pdis shown in table 1 suggests that there is good evidence (because the cv is generally below 20%) that the control functions, previously developed in the HL60 and HeLa cell lines, are in operation across these other mammalian lipidomes. Values of the mean pdis and pces in table 1 indicate that the trends we have previously reported [20,46] are also apparent in these wider datasets and that both properties are being regulated. For example, individual cell lines have similar values of pdis. Within error, the pdis of BMDMATP is 0.8 ± 0.2 and pdis of BMDMcompactin is 0.9 ± 0.2, the pdis of RAW 264.7compactin cells is 0.6 ± 0.1, while the pdis of RAW 264.7KDO cells is 0.6 ± 0.1. A similar trend is seen in the pces data as shown in table 1. However, the magnitudes of pdis and pces vary between cell lines indicating that the degree of membrane order and curvature elastic stress are likely to be different for each of the cell types.
This larger set of data also suggests that the ratio of pdis to pces for each cell line is around 3. This indicates a possible correlation between the two control functions across all the cell lines.
3.2. A strong correlation between pces and pdis across all lipidomes and evidence of data clustering
A plot of pdis versus pces for each individual population (ca 500) of cells was constructed and is shown in figure 2a. Figure 2a suggests that there is a strong correlation between pdis and pces in vivo (Pearson's correlation coefficient of +0.93). This suggests there is an equally strong correlation between membrane curvature elastic stress and membrane disorder in vivo, such that as thermal disorder increases in the bilayer, curvature elastic stress also increases. In qualitative terms, this makes sense because as the temperature increases, increases in thermal disorder of the acyl chains will lead to a larger hydrocarbon chain cross-sectional area. This is turn leads to a tighter radius of curvature and greater curvature elastic stress in the bilayer arrangement. However, it is well established that the spontaneous curvature preference of individual lipids does not correlate with increased membrane disorder [54], suggesting a more complex mechanism is behind the correlation in figure 2a and that this correlation is an emergent property of the mixture.
Figure 2.

(a) A plot of pdis versus pces for around 500 individual cell populations derived from the cell lines summarized in table 1. The Pearson correlation coefficient for the total data is 0.93 indicating that pdis and pces are positively correlated. Panel (b) shows pdis versus pces on a logarithmic scale calculated for a range of binary lipid mixtures (with increasing amounts of 10 mol% of the second lipid in the mixture) and the clustering of the pces and pdis values determined for the mammalian cells shown in (a). The inset in (b) shows the region where the mammalian cells cluster expanded and on a linear scale.
Another interesting observation is that for the cells analysed in figure 2a pces and pdis cluster over a range of 0.3–1.4 and 0.1–0.5, respectively. To get an idea of the range of values that pdis and pces can have we used equation (1.1) to calculate pdis and pces for binary lipid mixtures using the values of wces and wdis in the electronic supplementary material, tables S1 and S2. These data are shown in figure 2b indicating that the pdis and pces values for mammalian cells cluster when compared with the range of values possible.
Before exploring this relationship further, it is worthwhile ensuring that the correlation between pdis and pces is not artefactual. It is possible that the correlation might occur due to the underlying lipid concentration, in which case any two control functions for pdis and pces will show strong correlations because L, in equation (1.1), is significantly greater in magnitude than w. Therefore, as a control measure, a similar analysis to that shown in figure 2a was performed, where two, previously discarded w parameter sets (from our previous studies [20,46]) causing high variance (i.e. large cv values) in pdis and pces were plotted against each other. Electronic supplementary material, figure S1 shows for the cellular lipidomes and electronic supplementary material, figure S2 shows for the binary lipid mixtures that in this instance pdis and pces are poorly correlated.
3.3. Binary lipid studies of membrane order and curvature elastic stress explain the correlation between pces and pdis
To the best of our knowledge, only one literature study has proposed a quantitative model of the relationship between membrane order and lipid phase curvature [54]. Using binary lipid mixtures of 1-palmitoyl-2-oleoyl-sn-glycero-3-phosphocholine (POPC) and deuterated (d-31) 1-palmitoyl-2-oleoyl-sn-glycero-3-phosphoethanolamine (POPE), Lafleur et al. [54] determined the order parameter of both the inverse hexagonal (HII) and fluid lamellar (Lα) phases at different lipid compositions. They found that the temperature dependence of the membrane order parameter follows the same quantitative relationship in both phases but also that the membrane order parameter scales as a function of the curvature of the lipid mixture. This suggests that there are two components that drive membrane order, the first component is thermal energy and the second is stored elastic energy. Lafleur et al. [54] show that the average membrane order parameter of POPE:POPC 82 : 18 in the Lα phase (SLα) is ca 0.2 and in the HII phase (SHII) is ca 0.08 (both at 30°C). In fact, over the composition range studied, order in the Lα phase is 2–3 times greater than in the HII phase, at all temperatures. Thus, in the bilayer phase the effects of thermal disorder are attenuated by the frustration of lipid spontaneous curvature.
If we consider the case for mammalian cells (at constant temperature) then, because there is evidence to suggest curvature elastic stress is tightly regulated, the results of Lafleur et al. [54] imply that the attenuation of thermal order must also be constant. Furthermore, if the thermal contribution to membrane order is significantly bigger than the contribution from curvature elastic stress in vivo then controlling curvature elastic stress will have little effect on net membrane order. Therefore, membrane order would need to be independently regulated. Similarly, if the thermal contribution to membrane order in vivo is significantly lower than the contribution from curvature elastic stress then, to regulate membrane order, it is theoretically only necessary to regulate curvature elastic stress. To develop this analysis further it is necessary to estimate the curvature elastic stress of the cellular membranes in this study.
3.4. Estimating curvature elastic stress and the ratio SLα/SHII in vivo
There are no in vivo measurements of the spontaneous curvature, curvature elastic stress or stored elastic energy of biological membranes reported in the literature. Therefore, the best estimate of the magnitude of curvature elastic stress in vivo comes from calibrating pces against the calculated curvature elastic stress present in binary mixtures of lipids. If we compare this estimate of curvature elastic stress in a cell membrane to the curvature elastic stress in lipid mixtures with published values of the ratio SLα/SHII we can estimate the ratio SLα/SHII in vivo.
Figure 3a shows curvature elastic stress (τ), see equation (1.3), versus pces for two binary lipid mixtures of POPE (R0 = −28.5 Å [55]) and POPC (R0 = −454.5 Å [56]), and DOG (R0 = −11.5 Å [55]) and POPC (method is shown in the electronic supplementary material, section S1.2). The values of pces in table 1 range from 0.15 to 0.38. According to figure 3a, and assuming that this binary lipid model is valid for the lipidomes studied, then τ in these biological membranes is around 4–7 × 10⁻¹² N. Figure 3b shows the relationship between τ and SLα/SHII in model membranes, calculated from the data of Lafleur et al. [54]. From figure 3b it is clear that at this value of τ, SLα/SHII is around 2.6 and hence τ will have a dominating effect on membrane order in these cells.
Figure 3.

(a) The variance of pces with curvature elastic stress (τ) in binary POPC : POPE (black circles) or POPC : DOG (black triangles) lipid vesicles. (b) Curvature elastic stress versus SLα/SHII in binary POPC : POPE mixtures (black circles). Order parameter data taken from Lafleur et al. [54].
3.5. A mechanism for phospholipid homeostasis: curvature elastic stress drives membrane order in mammalian cells
A ratio of SLα/SHII = 2.6 is consistent with a mechanism where, at constant temperature, the regulation of membrane order in vivo could be accomplished by regulation of τ. However, Lafleur et al. [54] also present data to show that in the same POPE and POPC binary lipid systems, where SLα/SHII ranges from 2.6 to 3.11, the absolute magnitude of the orientational order parameter does not change significantly with lipid composition and hence τ. An explanation of this stems from figure 3b, where SLα/SHII appears to plateau at values of 3 over the range studied. In this regime, the effect of changes in τ on absolute order will be small, assuming constant temperature, possibly because the system is highly stressed. This in turn suggests that if mammalian cells maintain τ at around 2 × 10⁻¹¹ N or above, SLα/SHII will be about 3 and absolute membrane order will be constant. However, this does assume that the nonlinear curve fitted to figure 3b is appropriate. Assuming it is valid, then the lower value of SLα/SHII = 2.6, which is at the steepest point in the curve, suggests that the membrane order will be more sensitive to τ in this regime. It is however worth noting that the effect of protein is ignored in the calculation of τ. Theoretically, κM will increase with increasing protein content in the lipid bilayer as discussed [57]; therefore, it is likely that the estimated value of τ in vivo is at the lower extreme of the real value.
This mechanism explains why lipids such as cholesterol have an ordering effect on the other lipids present in biological membranes [58]. The radius of spontaneous curvature of cholesterol is tightly negative (R0 = −20 Å) [56] and hence in a bilayer arrangement, frustration of the spontaneous curvature of cholesterol is one mechanism through which membrane order might be controlled. This suggests that other lipids with negative spontaneous curvature will also increase membrane order when their curvature is frustrated, as a recent in vivo study that replaces cholesterol with PE indicates [59].
It is interesting to ask whether the same mechanism might operate to maintain membrane order in cells constant at different temperatures. As SLα/SHII is around 2.6–3 at all temperatures studied by Lafleur et al. [54] (from 20°C to 80°C), it is possible that by regulating τ in response to temperature change, membrane order will also be regulated. However, given that we have estimated τ in mammalian cells at constant temperature, further work will need to be carried out to assess this.
3.6. Mechanistic insights into the correlation between membrane curvature elastic stress and membrane order in vivo
To understand how the individual lipid species contribute to both pces and pdis, we looked at how hypothetical lipid compositional changes would simultaneously affect both terms. This was achieved by normalizing the difference in magnitude of w between each lipid and each pivot lipid species i.e. (wces Lp – wces L)/wces Lp or (wdis Lp – wdis L)/wdis Lp for the set of lipids {L}. Figure 4 shows the resultant plot restricted to the lipid species that have the greatest impact on the control functions (PC, PE, PS and PI headgroups) [20,46,47]. Compositional changes in the lipid species that fall on the dashed diagonal line in figure 4a–c will change the values of pdis and pces by equal amounts for a single cell population. Figure 4a–c show very clearly that a compositional change in any of the individual lipid species (lipid headgroup classes are shown in figure 4a, unsaturation combinations are shown in figure 4b) will not increase pdis more than pces, because none of the lipids appear above the diagonal line. Biologically, figure 4b shows that disorder, i.e. pdis, does not increase linearly with unsaturation. This is to be expected, because once a single unsaturation has been added, further unsaturations allow the chains to adopt some more ordered gauche conformations as well as less ordered conformations [14]. Furthermore, two groups of lipids can be defined as shown in figure 4c, Group 1 (subdivided into 1a and 1b) and Group 2.
— Group 1 lipids fall on the line of equality (or close to it) and thus compositional increases in these lipids decrease (Group 1a) or increase (Group 1b) the magnitude of pces and pdis more or less equally.
— Group 1a lipids are saturated lipids of all headgroups e.g. PC, PS, PE and PI (figure 4a,b).
— Group 1b lipids are comprised of mono-, di- and triunsaturates of PC, PS, PE and PI (figure 4a,b).
— Group 2 lipids are a significant distance from the line of equality and compositional increases in these lipids increase the magnitude of pces to a greater extent than pdis.
— Group 2 lipids are comprised of polyunsaturates, e.g. 20 : 4 and 22 : 6, containing lipids with PC, PS, PE and PI headgroups (figure 4a,b).
Figure 4.

Plots of (wces Lp − wces L)/wces Lp versus (wdis Lp − wdis L)/wdis Lp showing how changes in the lipid composition of a dataset will impact each control function relative to the pivot species. Lipid species that fall on the line of equality (or close to it) have roughly equal effects on the magnitude of pces and pdis. Panel (a) shows the lipids classified by headgroup identity. Panel (b) shows the lipids classified by the total number of unsaturations in both hydrocarbon chains. Panel (c) shows the lipids classified into three groups (Groups 1a, 1b and 2) as discussed in the text. Panel (d) shows the relative changes in pces and pdis about the cell cycle of the HeLa cell; pces data were normalized to the pces value at 3 h and pdis data were normalized to the pdis value at 3 h. G1, S, G2 and M are the Gap 1, Synthesis, Gap 2 and Mitosis phases respectively and x-axis is the number of hours after the release of cells from synchronization agent [47]. Increases in pces over pdis during G2/M are driven by compositional increases in polyunsaturated lipids.
This information allows us to understand, mathematically, how the correlation between the pdis and pces, figure 2a, is maintained in vivo, because the most compositionally abundant lipids in each lipidome (electronic supplementary material, table S3) are in Groups 1a and 1b.
3.7. Group 1 and Group 2 lipids have different biosynthetic pathways
Interestingly, figure 4b suggests that the polyunsaturated lipids in Group 2 might drive underlying variation in the ratio of pdis to pces. This is an interesting observation when the different biosynthetic routes for lipid production are considered. In vivo biosynthesis of lipids occurs through two pathways. Phospholipids are synthesized de novo through the Kennedy pathway [60], from free fatty acids via diacylglycerols, or by fatty acid remodelling through the Lands cycle [61]. The polyunsaturated fatty acids 20 : 4, 20 : 5 and 22 : 6 appear to be exclusively substituted into lipids through fatty acid remodelling [62]. What is striking about figure 4c is that the lipids in Groups 1a and 1b are exclusively synthesized by the de novo route and the lipids in Group 2 are all synthesized by the remodelling route. This suggests a cellular mechanism through which membrane curvature elastic stress could be varied disproportionately to membrane order in vivo. This process would occur via the Lands cycle, where lipids are switched between Group 1 and 2 by exchange of a 20 : 4, 20 : 5 or 22 : 6 fatty acid with one of the fatty acids on a Group 1 lipid.
3.8. Evidence that Group 2 lipids drive cell cycle variations in membrane order and curvature elastic stress
In other work [47], we concluded that for HeLa cells curvature elastic stress increases in the Gap 2/Mitosis (G2/M) phase of the cell cycle. We concluded that this is the result of increases in arachidonic acid containing lipids. In particular, we identified PC18 : 1/20 : 4, PE 18 : 0/20 : 4, PE 18 : 1/20 : 4, PE 18 : 0/20 : 4, PI 18 : 1/20 : 4, PI 18 : 0/20 : 4 and PS 18 : 0/20: 4, which are in Group 2 as identified in this work. Furthermore, we observed a fall in curvature elastic stress in S phase due to an increase in saturated and monounsaturated lipids with PC, PE, PS and PI headgroups, which are in Group 1. Figure 4d shows a reconstruction of the original plots of pdis and pces for the HeLa cell cycle normalized to their first time point. This analysis allows us to look at the relative magnitude of curvature elastic stress and membrane order as they vary about the cell cycle. Initially, pdis and pces drop in proportion with each other before there is a rise in pces that is greater than the rise in pdis at 12 h. What is now clear is that the difference in pces and pdis at 12 h (G2/M) is clearly due to the elevated Group 2 polyunsaturated lipids.
Using transcriptomic data in the NCBI GEO database for HeLa cells as they traverse the cell cycle [63], we looked for evidence to suggest that any of the acyltransferase enzymes [62] that perform polyunsaturated fatty acid substitutions, full list shown in electronic supplementary material, table S4, were expressed to a greater extent as cells move into the G2/M phase of the cell cycle. We could find no transcriptional correlation, suggesting a biochemical or post-translational mechanism that drives substitution with polyunsaturated fatty acids. Many of the acyltransferase enzymes that substitute polyunsaturated fatty acids are membrane spanning [62]; therefore, the likely regulatory mechanism is through membrane curvature elastic energy as demonstrated for several other intrinsic proteins [38]. However, it is also possible that membrane order might be being sensed, as is thought to occur in bacterial membranes through the so-termed ‘sunken-buoy’ motif [42] in some transmembrane proteins.
4. Conclusion
4.1. Limitations, assumptions and the development of better data-driven models
In this work, a number of assumptions are made as discussed in §2.1. It is useful to consider the impact of these assumptions on the conclusions of this study. The need for these assumptions partly stems from the current limitations of lipidomic analyses, as summarized in figure 5 and below.
(i) Lipidomic analyses are mass spectrometric and some lipid structural information such as fatty acid chain length, position and distribution of unsaturations (critical to efficient biophysical parametrization) is lost due to isomerism (assumptions A, B and C).
(ii) Lipidomic datasets are predominantly obtained from total lipid extracts and contain no information on cellular lipid spatial heterogeneity. In particular, subcellular lipid distribution, membrane protein composition, lipid microdomain composition and lipid leaflet compositional asymmetry are lost.
Figure 5.

A summary of assumptions used to generate data-driven models and the impact of new lipidomic and/or biophysical data on the conclusions of this paper.
The limitations presented in point (i) are likely to be overcome with new methodological developments in lipid mass spectrometry. This will enable a less coarse-grained approach to data-driven modelling to be performed by allowing a greater number of lipid species to be identified and included in the models. We know, however, from previous work [20] that the most compositionally abundant lipids (typically PC and PE lipids) dominate the control functions and because these are already included in the model the inclusion of less abundant lipids is unlikely to impact the conclusions of this paper.
The limitations presented in point (ii) will be overcome by new methods of lipid extraction and membrane fractionation. This will enable control functions to be determined for individual subcellular membranes. If all the membranes, domains and membrane leaflets in the cell have the same magnitudes of pces and pdis, then this will be of no consequence; however, there is no reason to expect this. Furthermore, quantitative details of the membrane proteome obtained under the same conditions as the lipidome will enable the set of total membrane proteins {PM} to be included in control functions. This is important because some membrane proteins can mitigate lipid curvature effects and hence their inclusion will lead to more accurate models.
Control functions are parametrized as a mixture where the components contribute linearly as a function of concentration to the mixture properties (assumption E). The use of this principle of ideal mixing is widespread [25,36,54,55] in the biophysics community and unlikely to be re-evaluated. Related to this is the low data density of the relevant lipid biophysical data, which allows the ranking of lipid contributions to curvature elastic stress (assumption F) or membrane order (assumption G). As new data emerge, a less coarse-grained approach to generate the values of wces and wdis can be employed. However, because the major trends are well established it is unlikely that either assumption E or F is likely to be re-evaluated.
4.2. Summary of key results and future directions
Using data-driven models [20,46] as proxies for membrane disorder and membrane curvature elastic stress in vivo, we have analysed the lipidomes of ca 500 cellular populations. Our analysis suggests that:
— both pces and pdis are well-evidenced in the new datasets,
— a positive correlation (R = + 0.93) exists between the two control functions across the new lipidomes,
— curvature elastic stress in mammalian cells is ca 4–7 × 10⁻¹² N,
— regulation of membrane order (membrane fluidity/viscosity) can be achieved by regulation of membrane curvature elastic stress but not vice versa,
— lipids synthesized through the Kennedy pathway have a more or less equal effect on both control functions, and
— Lands' cycle offers a route by which cells might increase curvature elastic stress to a greater extent than membrane order.
These findings have several implications for model studies of lipid–protein interactions. For example, it is common practice to look at the activity of membrane interacting proteins in binary lipid mixtures. Focusing model membrane studies on lipid mixtures with pdis and pces values comparable to those in real cells might reveal new insights into how lipid composition affects protein activity, particularly if pces and pdis values are used to normalize protein activity in across lipid compositions.
These data-driven models present a number of hypotheses, which ought to be tested independently. There are a number of challenges that currently prevent this. The biggest is that there is currently no way to directly measure stored elastic energy in a membrane. Rather its magnitude must be inferred using the intrinsic parameters of lipid mixtures and linear mixing. Membrane order can be measured in membranes; hence one approach to test the hypotheses presented is to measure membrane order and compare it to the calculated curvature elastic energy in complex lipid mixtures. The relatively few spontaneous curvature values of lipids in the literature, when compared with the number of lipids in cells, currently prevent this analysis.
Supplementary Material
Supplementary Material
Supplementary Material
Supplementary Material
Acknowledgements
The author acknowledges Lisa O'Rourke for proofreading drafts of the manuscript and George S. Attard for helpful discussions.
Data accessibility
This paper makes use of primary open access data that have previously been published; all relevant data and their source are cited at the appropriate point in the text.
Competing interests
The author declares no competing interests.
Funding
No funding has been received for this article.
References
- 1.Mazzella N, Syakti AD, Molinet J, Gilewicz M, Doumenq P, Artaud J, Bertrand J-C. 2005. Effects of crude oil on phospholipid fatty acid compositions of marine hydrocarbon degraders: estimation of the bacterial membrane fluidity. Environ. Res. 97, 300–311. ( 10.1016/j.envres.2004.06.007) [DOI] [PubMed] [Google Scholar]
- 2.Gonzalez A, Odjélé A, Weber J-M. 2013. PCB-153 and temperature cause restructuring of goldfish membranes: homeoviscous response to a chemical fluidiser. Aquat. Toxicol. 144–145, 11–18. ( 10.1016/j.aquatox.2013.09.018) [DOI] [PubMed] [Google Scholar]
- 3.Wieslander Å, Rilfors L, Lindblom G. 1986. Metabolic changes of membrane lipid composition in Acholeplasma laidlawii by hydrocarbons, alcohols, and detergents: arguments for effects on lipid packing. Biochemistry 25, 7511–7517. ( 10.1021/bi00371a038) [DOI] [PubMed] [Google Scholar]
- 4.King ME, Spector AA. 1978. Effect of specific fatty acyl enrichments on membrane physical properties detected with a spin label probe. J. Biol. Chem. 253, 6493–6501. [PubMed] [Google Scholar]
- 5.Ferguson KA, Glaser M, Bayer WH, Vagelos PR. 1975. Alteration of fatty acid composition of LM cells by lipid supplementation and temperature. Biochemistry 14, 146–151. ( 10.1021/bi00672a025) [DOI] [PubMed] [Google Scholar]
- 6.Guschina IA, Harwood JL. 2006. Mechanisms of temperature adaptation in poikilotherms. FEBS Lett. 580, 5477–5483. ( 10.1016/j.febslet.2006.06.066) [DOI] [PubMed] [Google Scholar]
- 7.Oger PM, Cario A. 2013. Adaptation of the membrane in Archaea. Biophys. Chem. 183, 42–56. ( 10.1016/j.bpc.2013.06.020) [DOI] [PubMed] [Google Scholar]
- 8.Gladyshev MI, et al. 2011. Effect of temperature on contents of essential highly unsaturated fatty acids in freshwater zooplankton. Limnol. Ecol. Manage. Inland Waters 41, 339–347. ( 10.1016/j.limno.2011.03.001) [DOI] [Google Scholar]
- 9.Behan-Martin MK, Jones GR, Bowler K, Cossins AR. 1993. A near perfect temperature adaptation of bilayer order in vertebrate brain membranes. Biochim. Biophys. Acta Biomembr. 1151, 216–222. ( 10.1016/0005-2736(93)90106-A) [DOI] [PubMed] [Google Scholar]
- 10.Behan MK, Macdonald AG, Jones GR, Cossins AR. 1992. Homeoviscous adaptation under pressure: the pressure dependence of membrane order in brain myelin membranes of deep-sea fish. Biochim. Biophys. Acta Biomembr. 1103, 317–323. ( 10.1016/0005-2736(92)90102-R) [DOI] [PubMed] [Google Scholar]
- 11.Cossins AR, Prosser CL. 1978. Evolutionary adaptation of membranes to temperature. Proc. Natl Acad. Sci. USA 75, 2040–2043. ( 10.1073/pnas.75.4.2040) [DOI] [PMC free article] [PubMed] [Google Scholar]
- 12.Anderson RL, Minton KW, Li GC, Hahn GM. 1981. Temperature-induced homeoviscous adaptation of chinese hamster ovary cells. Biochim. Biophys. Acta Biomembr. 641, 334–348. ( 10.1016/0005-2736(81)90490-9) [DOI] [PubMed] [Google Scholar]
- 13.Davy De Virville J, et al. 2002. Homeoviscous and functional adaptations of mitochondrial membranes to growth temperature in soybean seedlings. Plant Cell Environ. 25, 1289–1297. ( 10.1046/j.1365-3040.2002.00901.x) [DOI] [Google Scholar]
- 14.Hazel JR. 1995. Thermal adaptation in biological membranes: is homeoviscous adaptation the explanation? Annu. Rev. Physiol. 57, 19–42. ( 10.1146/annurev.ph.57.030195.000315) [DOI] [PubMed] [Google Scholar]
- 15.Hazel JR. 1997. Thermal Adaptation in biological membranes: beyond homeoviscous adaptation. Adv. Mol. Cell Biol. 19, 57–102. ( 10.1016/S1569-2558(08)60075-2) [DOI] [PubMed] [Google Scholar]
- 16.Sinensky M. 1974. Homeoviscous adaptation—a homeostatic process that regulates the viscosity of membrane lipids in Escherichia coli. Proc. Natl Acad. Sci. USA 71, 522–525. ( 10.1073/pnas.71.2.522) [DOI] [PMC free article] [PubMed] [Google Scholar]
- 17.Laroche C, Beney L, Marechal PA, Gervais P.. 2001. The effect of osmotic pressure on the membrane fluidity of Saccharomyces cerevisiae at different physiological temperatures. Appl. Microbiol. Biotechnol. 56, 249–254. ( 10.1007/s002530000583) [DOI] [PubMed] [Google Scholar]
- 18.Santoro N, Lisi A, Pozzi D, Pasquali E, Serafino A, Grimaldi S. 1997. Effect of extremely low frequency (ELF) magnetic field exposure on morphological and biophysical properties of human lymphoid cell line (Raji). Biochem. Biophys. Acta 1357, 281–290. ( 10.1016/S0167-4889(97)00032-3) [DOI] [PubMed] [Google Scholar]
- 19.Rybczynska M, Spitaler M, Knebel NG, Boeck G, Grunicke H, Hofmann J.. 2001. Effects of miltefosine on various biochemical parameters in a panel of tumor cell lines with different sensitivities. Biochem. Pharmacol. 62, 765–772. ( 10.1016/S0006-2952(01)00715-8) [DOI] [PubMed] [Google Scholar]
- 20.Dymond MK. 2015. Mammalian phospholipid homeostasis: homeoviscous adaptation deconstructed by lipidomic data-driven modelling. Chem. Phys. Lipids 191, 136–146. ( 10.1016/j.chemphyslip.2015.09.003) [DOI] [PubMed] [Google Scholar]
- 21.Crockett EL, Hazel JR. 1995. Cholesterol levels explain inverse compensation of membrane order in brush border but not homeoviscous adaptation in basolateral membranes from the intestinal epithelia of rainbow trout. J. Exp. Biol. 198, 1105–1113. [DOI] [PubMed] [Google Scholar]
- 22.Yu Y, Vidalino L, Anesi A, Macchi P, Guella G.. 2014. A lipidomics investigation of the induced hypoxia stress on HeLa cells by using MS and NMR techniques. Mol. Biosyst. 10, 878–890. ( 10.1039/c3mb70540d) [DOI] [PubMed] [Google Scholar]
- 23.Gruner SM. 1985. Intrinsic curvature hypothesis for biomembrane lipid composition: a role for nonbilayer lipids. Proc. Natl Acad. Sci. USA 82, 3665–3669. ( 10.1073/pnas.82.11.3665) [DOI] [PMC free article] [PubMed] [Google Scholar]
- 24.Helfrich W. 1973. Elastic properties of lipid bilayers: theory and possible experiments. Z. Nat. C 28, 693–703. ( 10.1002/mus.880040211) [DOI] [PubMed] [Google Scholar]
- 25.Seddon JM. 1990. Structure of the inverted hexangonal (HII) phase, and non-lamellar phase-transitions of lipids. Biochim. Biophys. Acta 1031, 1–69. ( 10.1016/0304-4157(90)90002-T) [DOI] [PubMed] [Google Scholar]
- 26.Vigh L, Maresca B, Harwood JL. 1998. Does the membrane's physical state control the expression of heat shock and other genes? Trends Biochem. Sci. 10, 369–374. ( 10.1016/S0968-0004(98)01279-1) [DOI] [PubMed] [Google Scholar]
- 27.Österberg F, Rilfors L, Wieslander Å, Lindblom G, Gruner SM. 1995. Lipid extracts from membranes of Acholeplasma laidlawii A grown with different fatty acids have a nearly constant spontaneous curvature. Biochim. Biophys. Acta 1257, 18–24. ( 10.1016/0005-2760(95)00042-B) [DOI] [PubMed] [Google Scholar]
- 28.Parsons JB, Rock CO. 2013. Bacterial lipids: metabolism and membrane homeostasis. Prog. Lipid Res. 52, 249–276. ( 10.1016/j.plipres.2013.02.002) [DOI] [PMC free article] [PubMed] [Google Scholar]
- 29.Hermansson M, Hokynar K, Somerharju P.. 2011. Mechanisms of glycerophospholipid homeostasis in mammalian cells. Prog. Lipid Res. 50, 240–257. ( 10.1016/j.plipres.2011.02.004) [DOI] [PubMed] [Google Scholar]
- 30.Yeung T, Gilbert GE, Shi J, Silvius J, Kapus A, Grinstein S. 2008. Membrane phosphatidylserine regulates surface charge and protein localization. Science 319, 210–213. ( 10.1126/science.1152066) [DOI] [PubMed] [Google Scholar]
- 31.Baenke F, Peck B, Miess H, Schulze A.. 2013. Hooked on fat: the role of lipid synthesis in cancer metabolism and tumour development. Dis. Model. Mech. 6, 1353–1363. ( 10.1242/dmm.011338) [DOI] [PMC free article] [PubMed] [Google Scholar]
- 32.Pietiläinen KH, et al. 2011. Association of lipidome remodeling in the adipocyte membrane with acquired obesity in humans. PLoS Biol. 9, e1000623 ( 10.1371/journal.pbio.1000623) [DOI] [PMC free article] [PubMed] [Google Scholar]
- 33.Di Paolo G, Kim T.. 2011. Linking lipids to Alzheimer's disease: cholesterol and beyond. Nat. Rev. Neurosci. 12, 284–296. ( 10.1038/nrn3012) [DOI] [PMC free article] [PubMed] [Google Scholar]
- 34.Li Z, Agellon LB, Vance DE. 2005. Phosphatidylcholine homeostasis and liver failure. J. Biol. Chem. 280, 37 798–37 802. ( 10.1074/jbc.M508575200) [DOI] [PubMed] [Google Scholar]
- 35.Weijers RNM. 2012. Lipid composition of cell membranes and its relevance in type 2 diabetes mellitus. Curr. Diabetes Rev. 8, 390–400. ( 10.2174/157339912802083531) [DOI] [PMC free article] [PubMed] [Google Scholar]
- 36.Attard GS, Templer RH, Smith WS, Hunt AN, Jackowski S. 2000. Modulation of CTP:phosphocholine cytidylyltransferase by membrane curvature elastic stress. Proc. Natl Acad. Sci. USA 97, 9032–9036. ( 10.1073/pnas.160260697) [DOI] [PMC free article] [PubMed] [Google Scholar]
- 37.Cornell RB, Arnold RS. 1996. Modulation of the activities of enzymes of membrane lipid metabolism by non-bilayer-forming lipids. Chem. Phys. Lipids 81, 215–227. ( 10.1016/0009-3084(96)02584-4) [DOI] [Google Scholar]
- 38.Ces O, Mulet X. 2006. Physical coupling between lipids and proteins: a paradigm for cellular control. Signal Transduct. 6, 112–132. ( 10.1002/sita.200500079) [DOI] [Google Scholar]
- 39.Beard J, Attard GS, Cheetham MJ. 2008. Integrative feedback and robustness in a lipid biosynthetic network. J. R. Soc. Interface 5, 533–543. ( 10.1098/rsif.2007.1155) [DOI] [PMC free article] [PubMed] [Google Scholar]
- 40.Dymond MK, Attard GS, Postle AD. 2008. Testing the hypothesis that amphiphilic antineoplastic lipid analogues act through reduction of membrane curvature elastic stress. J. R. Soc. Interface 5, 1371–1386. ( 10.1098/rsif.2008.0041) [DOI] [PMC free article] [PubMed] [Google Scholar]
- 41.Dymond MK, Attard GS. 2008. Cationic type I amphiphiles as modulators of membrane curvature elastic stress in vivo. Langmuir 24, 11 743–11 751. ( 10.1021/la8017612) [DOI] [PubMed] [Google Scholar]
- 42.Cybulski LE, Martín M, Mansilla MC, Fernández A, De Mendoza D.. 2010. Membrane thickness cue for cold sensing in a bacterium. Curr. Biol. 20, 1539–1544. ( 10.1016/j.cub.2010.06.074) [DOI] [PubMed] [Google Scholar]
- 43.Lockshon D, Olsen CP, Brett CL, Chertov A, Merz AJ, Lorenz DA, Van Gilst MR, Kennedy BK. 2012. Rho signaling participates in membrane fluidity homeostasis. PLoS ONE 7, e45049 ( 10.1371/journal.pone.0045049) [DOI] [PMC free article] [PubMed] [Google Scholar]
- 44.Zhang XH, Zhao C, Ma ZA. 2007. The increase of cell-membranous phosphatidylcholines containing polyunsaturated fatty acid residues induces phosphorylation of p53 through activation of ATR. J. Cell Sci. 120, 4134–4143. ( 10.1242/jcs.015834) [DOI] [PMC free article] [PubMed] [Google Scholar]
- 45.Ye J, DeBose-Boyd RA. 2011. Regulation of cholesterol and fatty acid synthesis. Cold Spring Harb. Perspect. Biol. 3, a004754 ( 10.1101/cshperspect.a004754) [DOI] [PMC free article] [PubMed] [Google Scholar]
- 46.Dymond MK, Hague CV, Postle AD, Attard GS. 2013. An in vivo ratio control mechanism for phospholipid homeostasis: evidence from lipidomic studies. J. R. Soc. Interface 10, 20120854 ( 10.1098/rsif.2012.0854) [DOI] [PMC free article] [PubMed] [Google Scholar]
- 47.Hague CV, Postle AD, Attard GS, Dymond MK. 2013. Cell cycle dependent changes in membrane stored curvature elastic energy: evidence from lipidomic studies. Faraday Discuss. 161, 481–497. ( 10.1039/c2fd20078c) [DOI] [PubMed] [Google Scholar]
- 48.The LIPID MAPS Lipidomics Gateway http://www.lipidmaps.org/ (accessed 1 July 2015).
- 49.Raetz CRH, et al. 2006. Kdo2-Lipid A of Escherichia coli, a defined endotoxin that activates macrophages via TLR-4. J. Lipid Res. 47, 1097–1111. ( 10.1194/jlr.M600027-JLR200) [DOI] [PubMed] [Google Scholar]
- 50.Dennis EA, et al. 2010. A mouse macrophage lipidome. J. Biol. Chem. 285, 39 976–39 985. ( 10.1074/jbc.M110.182915) [DOI] [PMC free article] [PubMed] [Google Scholar]
- 51.Sampaio JL, Gerl MJ, Klose C, Ejsing CS, Beug H, Simons K, Shevchenko A. 2011. Membrane lipidome of an epithelial cell line. Proc. Natl Acad. Sci. USA 108, 1903–1907. ( 10.1073/pnas.1019267108) [DOI] [PMC free article] [PubMed] [Google Scholar]
- 52.Chan RB, Oliveira TG, Cortes EP, Honig LS, Duff KE, Small SA, Wenk MR, Shui G, Di Paolo G.. 2012. Comparative lipidomic analysis of mouse and human brain with Alzheimer disease. J. Biol. Chem 287, 2678–2688. ( 10.1074/jbc.M111.274142) [DOI] [PMC free article] [PubMed] [Google Scholar]
- 53.Marsh D. 2013. Handbook of lipid bilayers. Boca Raton, FL: CRC Press. [Google Scholar]
- 54.Lafleur M, Bloom M, Eikenberry EF, Gruner SM, Cullis PR. 1996. Correlation between lipid plane curvature and lipid chain order. Biophys. J. 70, 2747–2757. ( 10.1016/S0006-3495(96)79844-2) [DOI] [PMC free article] [PubMed] [Google Scholar]
- 55.Leikin S, Kozlov M, Fuller N, Rand R. 1996. Measured effects of diacylglycerol on structural and elastic properties of phospholipid membranes. Biophys. J. 71, 2623–2632. ( 10.1016/S0006-3495(96)79454-7) [DOI] [PMC free article] [PubMed] [Google Scholar]
- 56.Kollmitzer B, Heftberger P, Rappolt M, Pabst G. 2013. Monolayer spontaneous curvature of raft-forming membrane lipids. Soft Matter 9, 10 877–10 884. ( 10.1039/c3sm51829a) [DOI] [PMC free article] [PubMed] [Google Scholar]
- 57.Chen CM. 2000. Theory for the bending rigidity of protein-coated lipid membranes. Phys. A 281, 41–50. ( 10.1016/S0378-4371(00)00037-6) [DOI] [Google Scholar]
- 58.Kaiser H-J, Lingwood D, Levental I, Sampaio JL, Kalvodova L, Rajendran L, Simons K. 2009. Order of lipid phases in model and plasma membranes. Proc. Natl Acad. Sci. USA 106, 16 645–16 650. ( 10.1073/pnas.0908987106) [DOI] [PMC free article] [PubMed] [Google Scholar]
- 59.Dawaliby R, Trubbia C, Delporte C, Noyon C, Ruysschaert J-M, Van Antwerpen P, Govaerts C. 2015. Phosphatidylethanolamine is a key regulator of membrane fluidity in eukaryotic cells. J. Biol. Chem. 291, 3658–3667. ( 10.1074/jbc.M115.706523) [DOI] [PMC free article] [PubMed] [Google Scholar]
- 60.Gibellini F, Smith TK. 2010. The Kennedy pathway—de novo synthesis of phosphatidylethanolamine and phosphatidylcholine. IUBMB Life 62, 414–428. ( 10.1002/iub.337) [DOI] [PubMed] [Google Scholar]
- 61.Lands WEM. 1957. Metabolism of glycerolipides: a comparison of lecithin and triglceride synthesis. J. Biol. Chem. 231, 883–889. [PubMed] [Google Scholar]
- 62.Yamashita A, Hayashi Y, Nemoto-Sasaki Y, Ito M, Oka S, Tanikawa T, Waku K, Sugiura T. 2014. Acyltransferases and transacylases that determine the fatty acid composition of glycerolipids and the metabolism of bioactive lipid mediators in mammalian cells and model organisms. Prog. Lipid Res. 53, 18–81. ( 10.1016/j.plipres.2013.10.001) [DOI] [PubMed] [Google Scholar]
- 63.Sadasivam S, Duan S, DeCaprio JA. 2012. The MuvB complex sequentially recruits B-Myb and FoxM1 to promote mitotic gene expression. Genes Dev. 26, 474–489. ( 10.1101/gad.181933.111) [DOI] [PMC free article] [PubMed] [Google Scholar]
Associated Data
This section collects any data citations, data availability statements, or supplementary materials included in this article.
Supplementary Materials
Data Availability Statement
This paper makes use of primary open access data that have previously been published; all relevant data and their source are cited at the appropriate point in the text.