Abstract
The manipulation of microscopic objects is challenging because of high adhesion forces, which render macroscopic gripping strategies unsuitable. Adhesive footpads of climbing insects could reveal principles relevant for micro-grippers, as they are able to attach and detach rapidly during locomotion. However, the underlying mechanisms are still not fully understood. In this work, we characterize the geometry and contact formation of the adhesive setae of dock beetles (Gastrophysa viridula) by interference reflection microscopy. We compare our experimental results to the model of an elastic beam loaded with capillary forces. Fitting the model to experimental data yielded not only estimates for seta adhesion and compliance in agreement with previous direct measurements, but also previously unknown parameters such as the volume of the fluid meniscus and the bending stiffness of the tip. In addition to confirming the primary role of surface tension for insect adhesion, our investigation reveals marked differences in geometry and compliance between the three main kinds of seta tips in leaf beetles.
Keywords: wet adhesion, insect setae, capillary forces, elasto-capillarity, biomechanics, biomimicry
1. Introduction
The miniaturization of engineered components in industrial processes is challenging, not only because of the need to maintain high efficiency or functionality, but also because of the physical constraints on their manipulation. At the scale where stiction and surface tension dominate other forces, how do we devise an efficient tool that reliably grabs and releases small and fragile objects? One strategy is to control and to take advantage of these surface forces [1–3]. In nature, such a solution has evolved in a number of organisms efficiently employing adhesion at the micrometre scale.
There are two main types of adhesive mechanism in climbing animals: ‘dry’ adhesion (as found in geckos) and ‘wet’ adhesion (used by insects, spiders and tree frogs). Dry adhesion in geckos relies on compliant setae and nanometric spatulae that adhere by van der Waals forces and has been studied extensively [4]; several gecko-inspired fibrillar adhesives have already been designed and tested [5,6]. By contrast, wet adhesion relies on the presence of small amounts of liquid secreted by the animal and the resulting viscous and capillary forces. Wet adhesion occurs in animals bearing two different types of adhesive structures, ‘smooth’ and ‘hairy’ pads [7]. Smooth pads (e.g. in stick insects, cockroaches and bees) are soft ‘cushions’ forming one single liquid bridge with the substrate. Hairy pads (e.g. in beetles and flies) are structures covered with dense arrays of slender adhesive setae (figure 1b,c), each of which forms a liquid bridge when it touches the substrate.
Figure 1.
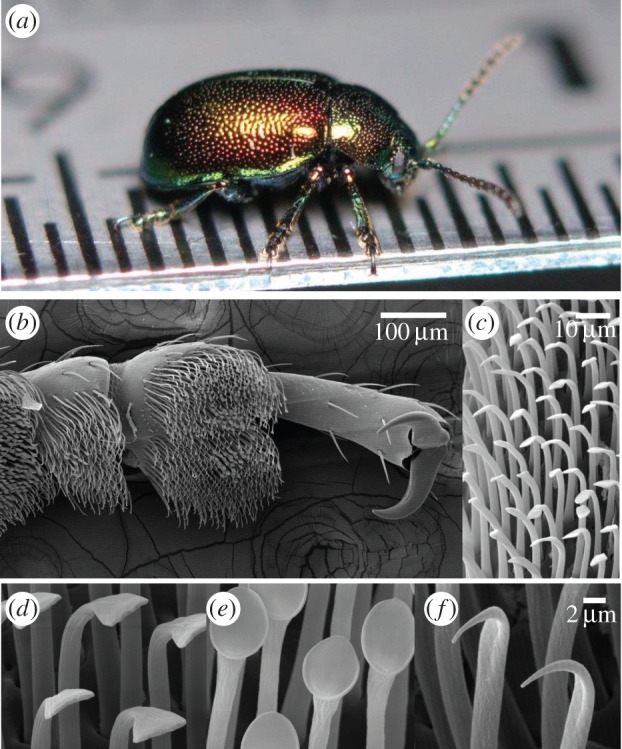
The leaf beetle Gastrophysa viridula and the morphology of its adhesive pads, (a) macroscopic view (ruler divisions are 0.5 mm), (b) ventral view of the tarsus and (c) setae. (d–f) The three main types of setae studied in this paper: spatula-shaped (d), discoidal (e) and pointed (f).
Although hairy pads are promising for bioinspired applications, the small size of individual setae makes direct observations challenging. Each seta tip is only a few micrometres wide and only few studies have attempted to design elaborate strategies to measure in vivo their mechanical and adhesive properties [8–11]. Nanoindentation measurements on the setae of lady beetle Coccinella septempunctata revealed a large difference in Young's modulus between the tip (1.2 MPa) and the stalk (6.8 GPa) [12]. These values are consistent with the ability of Gastrophysa viridula seta tips to accommodate surface roughness [13]. On the other hand, the volume of liquid in the capillary fluid bridges is so far unknown, although it is thought to be smaller than a few femtolitres [14]. Some other interesting morphological characteristics of the setae are still not fully understood: the shape of the seta tips varies both between insect species, and between different pad areas on the same foot [15,16]. In leaf beetles (figure 1), one can identify three main tip geometries: spatula-shaped, discoidal and pointed. Although the detailed function of each tip geometry is still unclear, first measurements [8] showed that discoidal tips produce larger adhesion forces than other tips. In addition, they were found to have a larger spring constant. As discoidal setae are only found in males, they may play an important role in the mating behaviour of the beetles [16]. By contrast, spatula-shaped tips showed a stronger direction-dependence and are probably specialized for the rapid switching between strong attachment and detachment during locomotion.
The existing models for fibrillar adhesion suffer from a lack of reliable experimental information at the scale of individual setae. A simple capillary bridge model has been rejected on the grounds that a meniscus of Newtonian liquid cannot explain the high shear forces of insect pads [17–20], as well as their weak velocity-dependence in the case of smooth pads [21]. Therefore, many theoretical descriptions of insect adhesion are based on dry contact [21,22]. As a result, the possible advantages of an intervening liquid are not considered. Experiments on smooth adhesive pads in insects have shown that reducing the volume of adhesive fluid increased adhesion on smooth substrates [21,23], but decreased it on rough surfaces [20]. Dry contact indeed fails to provide significant adhesion as soon as the distance between both solids exceeds a few tens of nanometres. Although the storage of elastic energy has been pointed out as a possible mechanism helping rapid detachment in gecko dry adhesion [4], this factor is ignored in many adhesion models and its detailed interplay with capillary forces has not been described. Theoretical work on the interplay between flexible structures and capillary forces exists (e.g. [24,25]), but it has not yet been applied to the field of insect adhesion.
The primary goal of this work is to characterize and better understand the interaction between adhesive setae of the dock beetle G. viridula and capillary forces during contact with a substrate. We focus on the elastic properties of the seta tip and the volume of liquid in the capillary meniscus, thereby comparing the three main types of seta tip in leaf beetles (discoidal, spatula-shaped and pointed). Our approach combines experimental and theoretical work. First, the three-dimensional geometry of seta tips in contact with glass is obtained in vivo using interference reflection microscopy (IRM) [18]. The experimental set-up and results are described in §§2 and 3, respectively. Second, we develop a simplified beam model of a seta tip loaded by capillary forces (§4). The unknown parameters of the model (namely the stiffness of the beam and the volume of liquid in the meniscus) are then determined by matching the predicted geometry to the experimental data (§5). Further predictions of the model, including adhesion force levels, are discussed in §6.
2. Experimental set-up
The mechanical properties of insect cuticle greatly depend on its degree of hydration [26], and it is probably that hydration also affects insect adhesive setae. It is therefore important to work with living insects. We studied male dock beetles (G. viridula; n = 5). For each of beetle, we analysed the behaviour of 10–14 setae of each type (spatula-shaped, discoidal or pointed tip—figure 1d–f) from the most distal seta-bearing (third) tarsomere of the rear or middle leg, resulting in a total of n = 60 for each kind of seta tip.
Using IRM (figure 2), we imaged the contact geometry of the seta tips. The beetles were immobilized by embedding them on their back in Blu-Tack (Bostik) and Parafilm (Bemis) tape mounted on a metal rod; Blu-Tack was also used to isolate one of the legs. Its tarsus was fixed on the dorsal side with vinyl polysiloxane impression material (Elite HD + light body, Zhermack, Badia Polesine, Italy). The last tarsal segment and the claws were bent over and fixed in the Blu-Tack to expose the distal pad on the third tarsal segment and to prevent the claws from touching the surface. The holder with the beetle was attached to a closed-loop piezo stage (P-611 ZS, Physik Instrumente) that moved in the vertical direction with a resolution of 2 nm. The distal adhesive pad was brought into contact with a glass coverslip mounted under a Leica DMR-HC upright microscope with a 100×/1.25 oil objective. We used switchable bandpass interference filters in the epi-illumination path to achieve monochromatic epi-illumination by isolating the 546 or 436 nm lines from the spectrum of a 100 W mercury arc lamp. We recorded a succession of images for different z-positions on a QIC-FM12 12-bit monochrome camera (QICAM) with an optical resolution comprised between 210 and 270 nm. Figure 3 shows a typical IRM image of the seta tips. It can be seen that the hairs make different levels of contact. The fringe pattern on the proximal (stalk) side of each contact zone represents the part of the seta that is sufficiently close to the substrate so that the air gap between the seta and the glass surface produces interference.
Figure 2.
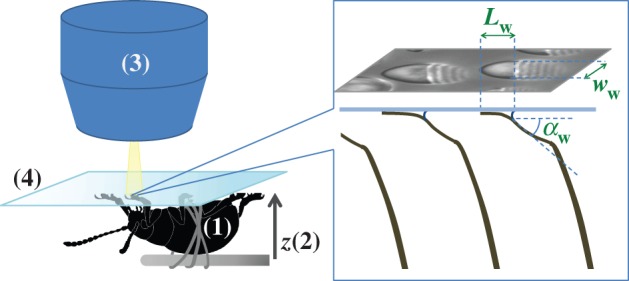
Experimental set-up: a male beetle (1) is attached to a piezo stage (2) and one of its legs is brought into contact with a glass coverslip (4). Monochromatic epi-illumination (3) reveals interference fringes that result from the thin air gap between the tip and the glass. We measured both the geometry of the contact zone (total length  and width profile
  ) as well as the tip angle
  as calculated from the first fringes. (Online version in colour.)
Figure 3.
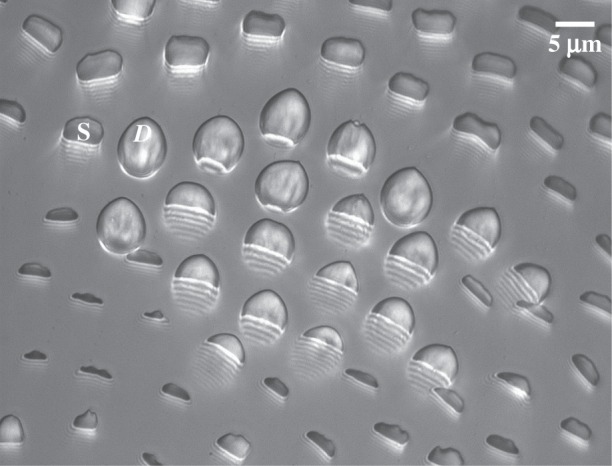
Typical IRM image of the beetle adhesive pad in contact, containing discoidal (D) and spatula (S) tips. Fringe patterns are visible on the proximal side of the contact zones, corresponding to parts of the seta tips that are close to the substrate but not yet in contact.
A flexible cantilever beam in wet contact with a substrate can be in different regimes of elasto-capillary equilibrium [24], depending on how much it is deformed by the capillary forces. At high stiffness, the beam does not significantly deform and does not touch the substrate. The liquid forms a capillary bridge that links both structures. At low stiffness, the tip of the beam touches the substrate and the meniscus takes the shape of a liquid wedge (figure 2, right). Our experimental observations suggest that the latter regime describes the behaviour of the very thin and compliant seta tips. Recent cryo-SEM images of fly setae [27] also confirm this conclusion, as most of the liquid was found near the proximal edge of the seta contact zones.
Between each movement of the piezo stage and the subsequent image, sufficient time (3–5 s) was left for the liquid bridge to reach a static equilibrium. This condition is fulfilled when the viscous forces induced by a motion of the liquid bridge are negligible compared to capillary forces. The capillary number  estimates the ratio of viscous to capillary forces associated with a Poiseuille flow between two parallel plates [25], where
  ,
,  and v are the dynamic viscosity, the surface tension and the characteristic velocity of the movement. If considering a vertical recirculation of the fluid, the associated capillary number
  scales as
  with L the characteristic length of the horizontal flow and h the distance between the plates. Previous work estimated the liquid viscosity to be
  [11]. The surface tension of most oil-based liquids is approximately
  [28]. Finally, our images revealed that v was of the order of 0.1 µm s−1, so the corresponding capillary number
  is indeed much smaller than unity.
  also conforms to this criterion as long as
  , a distance where van der Waals forces between both plates must be taken into account and continuous fluid mechanics is not applicable anymore.
During our measurements, we sometimes observed small back-and-forth movements of the seta tips (of approx. 1 µm) which may be induced by fluctuations in the haemolymph pressure or muscle contractions. Thus, the uncertainty about the actual z-position of the setae was much larger than the nanometre resolution of the piezo stage, thereby increasing the variability of our results.
3. Experimental results
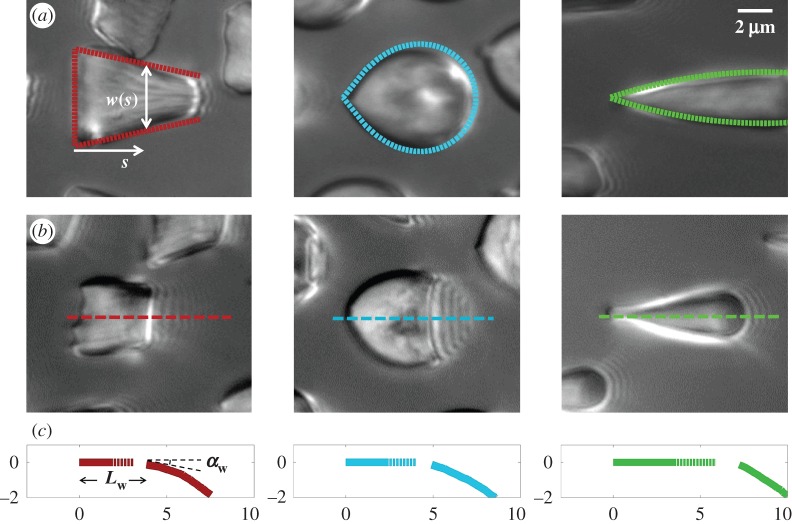
We first analysed the shape of the contact area of 45 seta tips (15 of each kind). The width w at any given distance s from the distal end of the tip was approximated by linear, lemniscate and parabolic functions corresponding to spatula-shaped, discoidal and pointed tips, respectively (figure 4a). The corresponding dimensionless equations  are given in table 1. Average values were calculated for the maximum width
  and length
  of the full contact area. The length
  was defined as the transition from the seta tip to the seta stalk. In the following,
  will be used to normalize lengths and distances (
 ,
,  ).
).
Figure 4.
Measurements from IRM images for each of the three types of seta tip (from left to right: spatula-shaped, discoidal and pointed). (a) Approximation  of the local width of the contact area. (b) Longitudinal direction defining the contact length
  and the tilt angle
  . (c) Side-view reconstruction of the shape of seta tips in half contact with the substrate (scale in micrometres), calculated from the spacing between interference fringes: the dotted part of the curve represents the zone where the liquid meniscus should be.
Table 1.
Average dimensionless width profile  , dimensional maximum width
  and dimensionless clamping position
  (length of the seta tip normalized by
  ) for each kind of seta tip.
| tip | spatula | discoidal | pointed |
|---|---|---|---|
 |
 (linear) (linear) |
 (lemniscate) (lemniscate) |
 (quadratic) (quadratic) |
| wM (μm) | 5.61 | 6.14 | 2.93 |
 |
1.26 | 1.21 | 4.20 |
Even though the flexible seta tip extremities should be very close to the substrate, there is no visible transition from dry to wet contact on the IRM images. The image contrast is reduced by stray light reflected from the dorsal side of the seta tip but some liquid may also be trapped between the seta tip and the substrate. Nevertheless, if this layer is thin enough, both normal and tangential forces can be transmitted from the seta to the substrate just like for a dry contact (although with a different friction coefficient). No interference is observed in the wet region: stray light from the dorsal side of the seta tip and the high brightness of the background conceal the light interferences produced by two surfaces of similar refractive indices (glass substrate,  , and insect secretion,
  [29]). On the other hand, the liquid–air interface is present right before the first bright interference fringe. The proximal–distal length of the wet contact zone
  (i.e. the distance between this interface and the seta tip, along the medial symmetry axis of the seta contact zone, figure 4b) was measured for each z-position of the piezo stage (figure 2).
The angle  is defined as the local inclination of the seta at a curvilinear distance s from the end of the tip. Outside of the wet contact zone,
  can be estimated from the spacing between interference fringes. Of particular interest is the angle
  (at abscissa sw, i.e. the liquid–air interface), which is deduced from the distance between the first two bright fringes adjacent to the meniscus. Classical theories for thin films assume that interference occurs between light rays reflected from two almost parallel interfaces, i.e. for very small
  . Because this approximation is not valid in our case, we had to reconstruct the interference profile by ray tracing, according to the general theory developed by Wiegand et al. [30]. Our calculations are therefore valid also for larger
  and they take into account the finite aperture of illumination. Finally, we measured the average angle change along the fringe profile
  (the dot represents derivation with respect to the curvilinear abscissa s) for each tip and each contact step. Fringes are not always straight lines perfectly perpendicular to the longitudinal direction of the tip (defined in figure 4b), so the distance between them is subject to a significant measurement error (typically 2 pixels here, corresponding to 114.6 nm), which translates into uncertainty regarding αw. Similarly, a maximal error of 5 pixels was estimated for the positioning of the fluid–air interface and hence
  (cf. charateristic error bars in figures 5 and 6). The local measurement of
  for each position of the stage z provides an approximate reconstruction of the three-dimensional geometry of the seta tip (figure 4c). However, only the local slope is measured; the absolute distance to the substrate as well as the fluid wedge length and height are unknown (see the discontinuity of the profiles in figure 4c).
Figure 5.
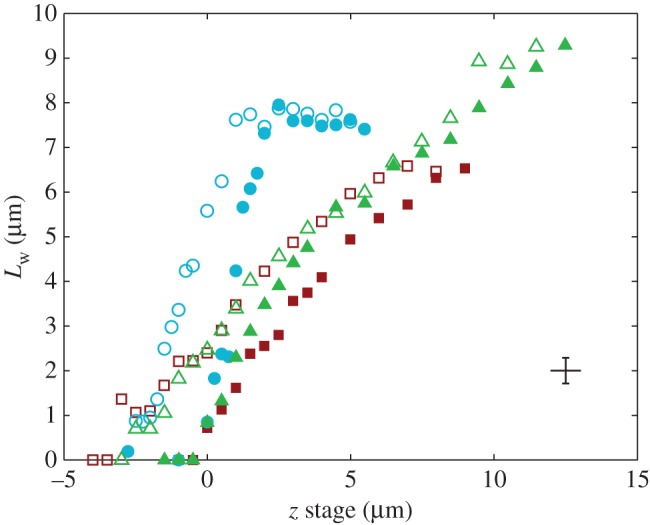
Contact length  of three seta tips for each position z of the piezo stage. Symbols correspond to different seta types: spatula-shaped (squares), discoidal (circles) and pointed (triangles). Filled symbols represent loading (increasing z), whereas open symbols correspond to unloading (decreasing z).
Figure 6.
Seta inclination  at the fluid–air interface plotted against contact length
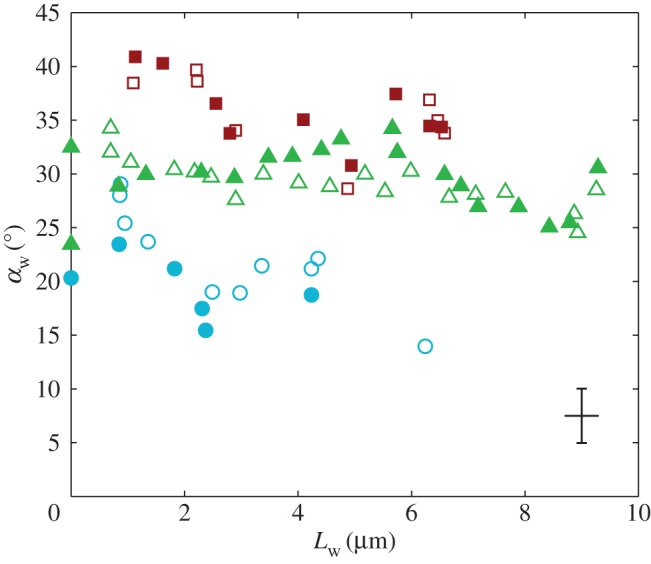
  . Symbols correspond to different seta types: spatula-shaped (squares), discoidal (circles) and pointed (triangles). Filled symbols represent loading (increasing z), whereas open symbols correspond to unloading (decreasing z).
Figure 5 shows the seta contact length  as a function of the piezo stage displacement z (the first contact of the tip with the substrate corresponds to
  ). The three kinds of tips are clearly differentiated: the slope is about four-times higher for discoidal tips than for the spatula-shaped and pointed tips. The contact length
  also saturates at
  for both discoidal and spatula tips, thus presenting a defined maximum tip length unlike pointed tips. For each of the three seta types, a significant difference was observed between contact length at the same z-position during loading (increasing z) and unloading (decreasing z). This phenomenon is typical of adhesive contacts [31]. However, the hysteresis is not visible when the local slope
  at the fluid–air interface is plotted against the contact length
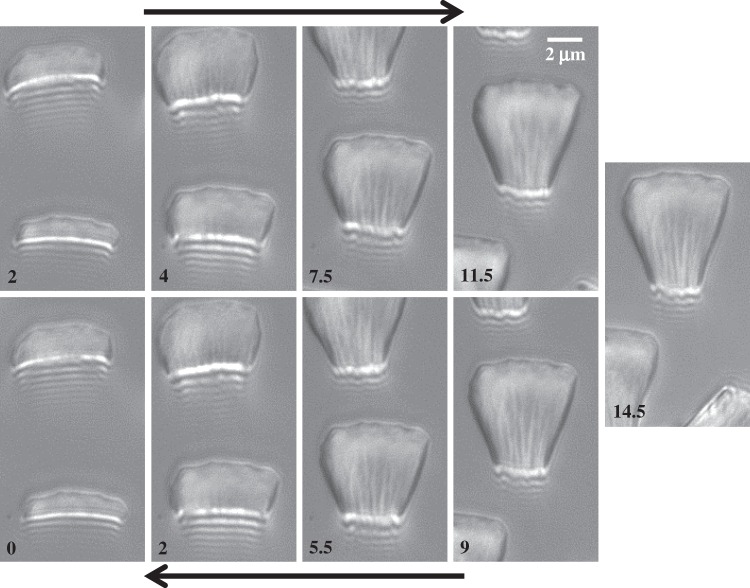
  (figure 6). This suggests that the hysteresis could be attributed to either backlash in the insect fixation, uncontrolled movement of the insect (§2) or partial bending of the stalk, each of them possibly resulting in imperfect transmission of the vertical movement from the stage to the seta tip. The absence of significant hysteresis indicates that the tip is always in a local equilibrium that does not depend on whether the seta is attaching to or detaching from the substrate. Because friction forces are reversed when switching from loading to unloading (they always oppose the motion), they must not significantly affect this local equilibrium. The observed horizontal sliding of the tips as the piezo stage is moving (distal during loading, proximal during unloading, figure 7) confirms that, in this particular configuration, friction does not dominate the force balance. Figure 6 also shows that discoidal tips form generally smaller angles with the substrate than both spatula-shaped and pointed hairs.
Figure 7.
IRM view of a spatula-shaped seta tip at successive positions z of the stage (indicated in micrometres in the lower left of each image). In the upper row, the pad approaches the substrate, while in the lower row, the pad separates from the substrate. The difference in z-values between loading and unloading shows that there was considerable hysteresis. It can be seen that the seta slid distally along the substrate during loading and proximally during unloading.
We averaged angle measurements from 10 to 15 tips of the same kind from the same pad. As neighbouring tips do not always have the same contact length  at a given position of the stage (figure 3), we had to sort each pair
  into bins of similar
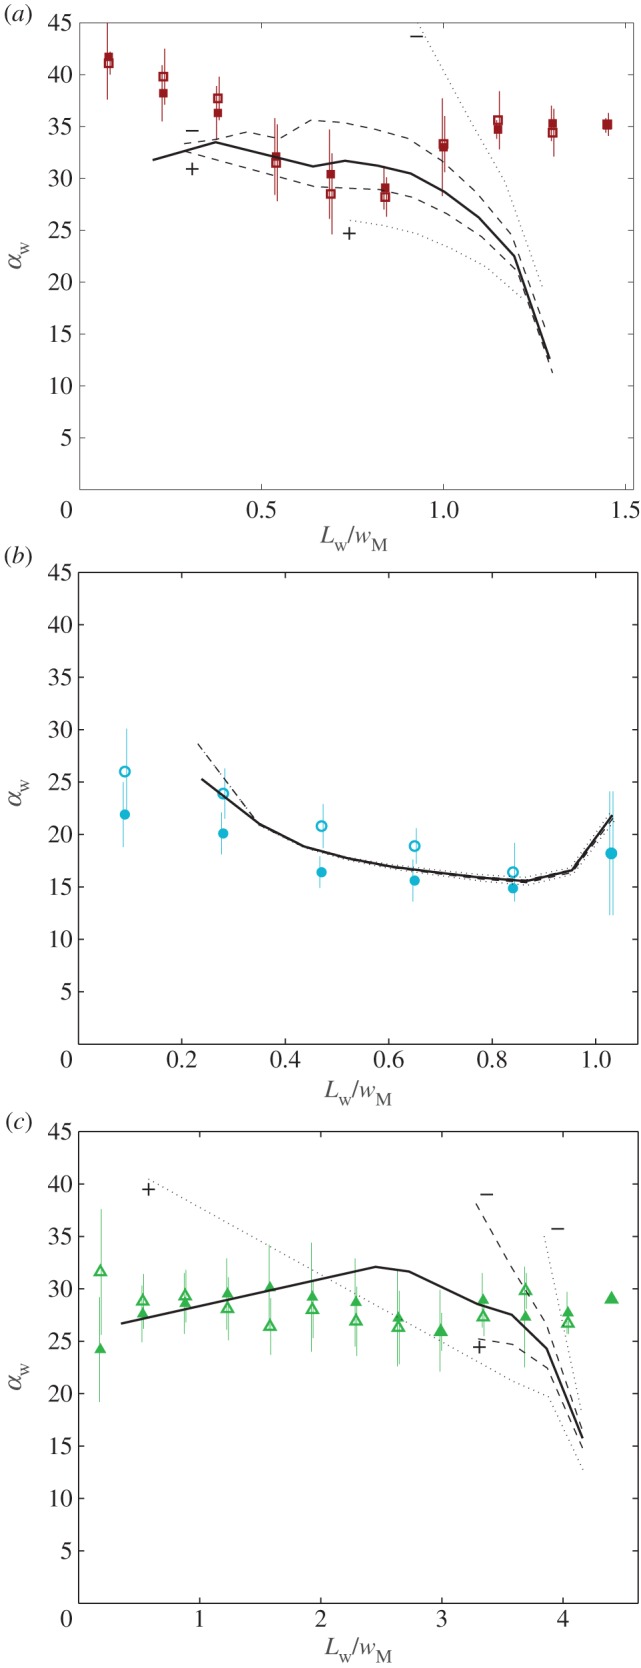
  . The size of the bins was identified for each individual and seta type such as each bin would contain enough data points to ensure significant average and standard deviation values. The resulting averaged curves followed the same tendency as those of single seta tips (figure 8). Curves of
  from different individuals did not superimpose precisely due to biological variation. Each individual was therefore fitted separately by the model.
Figure 8.
Seta inclination  at the fluid–air interface plotted against contact length
  ; symbols show the average of many measurements over 10 seta tips from the same individual. (a) Spatula-shaped (squares), (b) discoidal (circles) and (c) pointed tips (triangles). Filled symbols represent loading (increasing z), and empty symbols unloading (decreasing z). Solid, dashed and dotted lines represent fits by the elasto-capillary model for a friction coefficient of
  , ±10 and ±30 kPa, respectively. Additional plus and minus symbols indicate the sign of coefficient
  . Thickness profile
  (equation (4.5)) was used for the fit of discoidal tips, and profile
  (equation (4.6)) for spatula-shaped and pointed tips. (Online version in colour.)
4. Elasto-capillary model of the seta tip
Each seta tip can be modelled as a thin flexible beam clamped at one end, corresponding to the transition to the seta stalk (figure 9). When the pad is not in contact with the substrate, the seta tips are assumed to be straight and tilted with an angle  . When the beam touches the substrate, it bends in response to two forces: (i) the reaction force
  from the solid–solid contact and (ii) the surface tension forces from the capillary meniscus. This meniscus can be approximated by a liquid wedge of volume V between the beam and the substrate. The corresponding loads include the Laplace pressure
  inside the meniscus and the capillary force
  along the contact line, where
  , R and
  are the surface tension, the radius of curvature of the meniscus and the width of the tip at the proximal edge of the meniscus, respectively.
Figure 9.
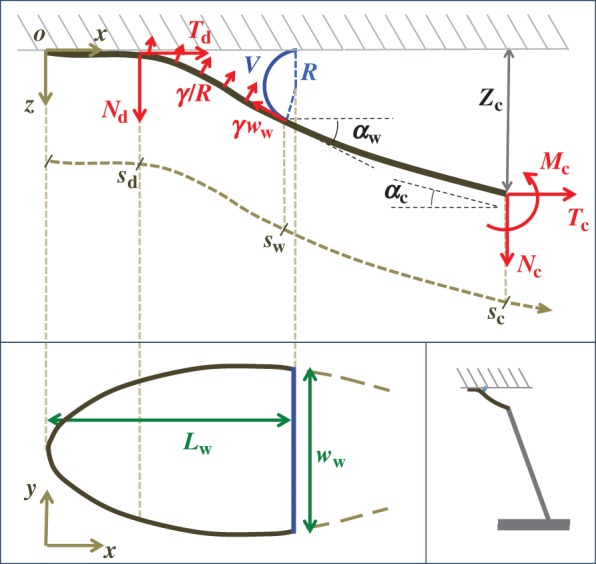
Elasto-capillary model: a flexible beam (length  , width
  ) is in contact with a flat substrate (hatched area). It is clamped at one end at a distance
  from the substrate and with an inclination angle
  . A portion
  of the beam is in solid–solid contact with the substrate. Another portion
  is separated from the substrate by a wedge-shaped liquid meniscus of volume V. The horizontal distance between the beam tip and the meniscus edge is denoted
  . The loads applied to the beam are the solid–solid contact reaction force
  , the associated friction force
  , surface tension at the contact line
  and the Laplace pressure
  , where R is the curvature radius of the meniscus. The resulting efforts at the clamp are
  ,
,  and
and  . (Online version in colour.)
4.1. Geometry parameters
Seta tips are a few hundred nanometres thick [32], so their aspect ratio (thickness over length) is smaller than 0.1. They can thus be considered as slender beams which undergo significant deflection while the corresponding strain remains small. We define the curvilinear coordinate s along the neutral axis of the beam, with the origin  at the very tip. Indices o, d, w and c correspond to the extremity of the beam, the end of the solid–solid contact area, the end of the fluid-mediated contact area (fluid–air interface) and the clamping point, respectively. The beam deflection is expressed by a parametric equation
  , where z is the distance to the substrate and x is the distance to the beam extremity, parallel to the substrate. The parametrization is such that
| 4.1 |
and
| 4.2 |
where  is the local slope of the beam. It is obtained by solving Euler–Bernouilli's equation
| 4.3 |
where  ,
,  and
and  are the curvature, the local bending moment and the local bending stiffness of the beam, respectively.
The bending stiffness  is related both to the width
  and the height
  of the cross-section of the seta tip. As shown in §3, the width profile has been measured from the IRM images and averaged. It is normalized by its maximum width
  and approximated with the function
  where
where  (table 1). On the contrary, the local thickness
  is not directly accessible with our experimental set-up. Eimüller et al. reported thickness measurements of spatula tips made by X-ray microscopy: it varies from about 100 nm to about 500 nm in the first 5 µm from the tip [32]. This increase is well approximated by a square-root function:
 |
4.4 |
with  the thickness at
  . The local Young's modulus is also unknown. Transmission electron microscopy [32] has revealed that the tips are not homogeneous structures. They rather consist of a solid hull filled with fibrillar material. The dorsal and ventral cuticles could thus be the main contributor to the bending stiffness (similar to an I-beam). Assuming a hull of constant thickness, the bending stiffness is proportional to the square of the total beam thickness:
| 4.5 |
This expression is based on a succession of hypotheses a priori only justified for spatula tips. As no similar measurements are available concerning discoidal or pointed tips, we choose to additionally consider a simpler profile of constant thickness and homogeneous Young's modulus:
| 4.6 |
where  now represents the maximum bending stiffness. Both profiles were examined for each tip geometry.
4.2. Loads and bending equations
Shear stresses induced by bending are safely neglected as soon as the beam is sufficiently slender. By contrast, substrate roughness induces significant stretching, which can strongly modify the mechanical behaviour of the seta [13]. We here consider the substrate to be perfectly flat: the pure bending of the beam is then described by equation (4.3). Boundary conditions associated with equations (4.1)–(4.3) are defined at the transition from solid–solid to liquid-mediated contact  :
:
| 4.7 |
| 4.8 |
| 4.9 |
The loads depend on the geometry of the seta (figure 9). Because the solid–solid contact zone is assumed to be perfectly flat, there is no net moment in this part of the beam. We can then assume that the (unknown) resultant reaction force normal to the substrate  is concentrated at the edge of the dry contact zone (position
  ). The absence of significant hysteresis in figure 6 suggested that solid friction forces do not strongly modify the elasto-capillary equilibrium. To test this hypothesis, we consider a friction force
  that opposes the sliding motion of the seta, where
  is the static shear stress and
  the area of solid–solid contact. According to figure 9,
  is positive during loading (distal sliding of the tips) and negative during unloading (proximal sliding). The case
  was first considered for the calibration of the model on experimental data. Then
  was varied in order to assess its influence on the elasto-capillary equilibrium.
The adhesive liquid mostly contains lipids [33], and the resulting low contact angle contributes to the robustness of the adhesion mechanism on a broad range of substrates. For the sake of simplicity, we here assume that the liquid perfectly wets both surfaces (zero contact angle). The liquid meniscus is then approximated by a circular arc of radius R tangent to both the beam and the substrate. Surface tension  contributes twice to the beam loads. First it exerts a force per unit width at the contact line (position
  ), parallel to the liquid–air interface (i.e. tangent to the beam). The second load is a negative Laplace pressure
  uniformly distributed over the wet part of the beam (
 ). For simplicity, we, furthermore, assume that
  so the curvature of the liquid meniscus is much smaller in the
  -plane than in the
  -plane.
In the wedge region ( ), the resulting local moment in the beam is given by
| 4.10 |
where
and x, z,  and M all depend on position s. In the solid–solid contact zone (
 ),
),
 |
4.11 |
The volume of liquid V in the wedge is computed from the beam shape:
 |
4.12 |
Finally, the normal ( ) and tangential (
 ) efforts at the clamped end
  are computed according to
 |
4.13 |
and
 |
4.14 |
These efforts are directly communicated to the insect leg;  thus represents the net adhesive force developed by one single seta tip.
A dimensionless form of equations (4.10)–(4.14) is obtained by dividing distances, forces and moments by  ,
,  and
and  , respectively. We then define two dimensionless parameters
  and
and  that fully characterize the equilibrium: the elasto-capillary number
  represents the ratio between capillary and elastic forces [34] and the dimensionless liquid volume
  defines the amount of fluid in the wedge.
We performed the numerical resolution of the model using MATLAB 2015a software. The beam deflection can be computed for any quadruplet of parameters  as follows. Equation (4.3) is integrated from
  to
to  , with
  defined as
  (i.e. the liquid meniscus connects tangentially to both solids). The curvature radius R is determined by iteration, until the liquid volume calculated from equation (4.12) matches the prescribed volume
  . Finally, the deformation of the detached part is obtained by integrating equation (4.3) for
  . The obtained solution is considered valid only if the deflection angle
  remains in the range
  for every point of the beam. A fitting procedure (described in the electronic supplementary material) is then implemented to identify the quadruplet
  that leads to a beam deflection that matches the experimental data. Two criteria determine the best fit: the residual
  between experimental and fitted curves is minimized and the percentage of curve
  for which the theoretical solution falls within the error bar is maximized.
5. Results
5.1. Adjusted dimensionless parameters
The predictions of our model are summarized in figure 8. Although the model captures well the behaviour of  for intermediate values of
  , it fails to compute a valid solution when
  is either too small or too large. Best values of
  determined for each seta tip are then averaged geometrically for each tip type (table 2). Trial values for
  and
and  are discrete and equidistant on a logarithmic scale: the corresponding standard deviations are thus expressed in exponential form.
Table 2.
Best match between model results and experimental data for each kind of seta tip (spatula, discoidal and pointed) and for the two bending stiffness profiles B1 and B2 (equations (4.5) and (4.6)). The quality of the fit is determined from the percentage  of valid theoretical solutions that are within the experimental error bar and by the corresponding residual
  . Best pairs
  are averaged geometrically for each tip type. The corresponding standard deviation is expressed in exponential form. Dimensional bending stiffness at the widest point of the tip
  and liquid volume V are also given.
| tip | spatula | discoidal | pointed |
|---|---|---|---|
| B1 | |||
 (%) (%) |
28 | 24 | 31 |

|
1.7 | 0.8 | 1.3 |

|
 |
 |
 |

|
 |
 |
 |
 (μN µm2) (μN µm2) |
 |
 |
 |
| V (μm3) |  |
 |
 |
| B2 | |||
| nv (%) | 27 | 25 | 46 |

|
1.3 | 1.6 | 0.9 |

|
 |
 |
 |

|
 |
 |
 |
 (μN µm2) (μN µm2) |
 |
 |
 |
| V (μm3) |  |
 |
 |
The associated dimensional quantities  and V are represented in figure 10. Significant differences are obtained depending of the thickness profile used in the model. The non-homogeneous profile (
 , equation (4.5)) offers more consistent results for the discoidal tips of different individuals. By contrast,
  and
and  criteria speak in favour of profile
  (equation (4.6)) for pointed tips. Both profiles work equivalently well for spatula tips. Based on this selection, tip types can be classified from stiffer (discoidal) to more flexible (pointed). A larger amount of fluid is systematically associated with a higher degree of stiffness.
Figure 10.
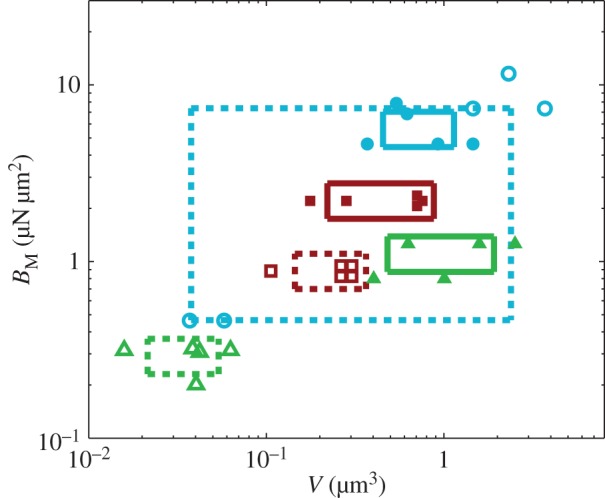
Dimensional parameters of the model adjusted on experimental data: bending modulus  at the widest point of the tip versus volume of liquid V in the meniscus. Three tip geometries are represented (spatula, squares; discoidal, circles; pointed, triangles) as well as two thickness profiles (
 (solid lines, filled markers) and
  (dashed lines, empty markers)). The markers indicate particular solutions fitted for every trial batch and the box delimits an area of one standard deviation around average value. (Online version in colour.)
5.2. Adhesion force
The resulting force in the direction normal to the substrate  represents the adhesion force developed by a single seta. It generally increases with the contact length
  (figure 11) but also significantly differs from one seta type to the other. For the same contact length, discoidal tips generate adhesion 2–3 times larger than spatula tips and 8–12 times larger than pointed tips. On the other hand, spatula and pointed tips can be seen as more robust than the discoidal ones, as a small change in contact length will not result in a large drop in adhesion force.
Figure 11.
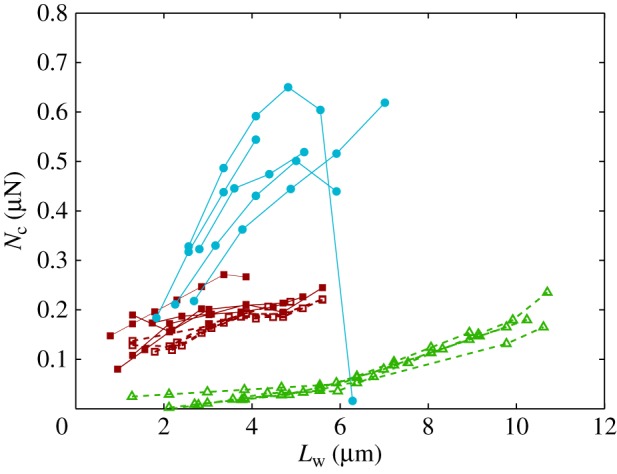
Normal force  at the tip-to-stalk transition versus contact length
  . The three tip geometries are represented (spatula, squares; discoidal, circles; pointed, triangles) as well as the corresponding thickness profiles (
 (solid lines, filled markers) and
  (dashed lines, empty markers)).
5.3. Friction force
The consideration of a small non-zero friction force in the analytical model ( dashed lines in figure 8) brings the prediction for spatula-shaped and pointed tips outside of the experimental error bars. The upper (respectively, lower) curve corresponds to negative (respectively, positive)
  . Including friction in this case thus results in a strong differentiation between attachment and detachment that is not observed experimentally. On the other hand, higher values for the shear stress (
 dotted lines in figure 8) influence only slightly the behaviour of the model prediction for discoidal tips. We conclude that friction is not a dominant effect for spatula-shaped and pointed tips in this particular configuration where the insect leg is brought in normal contact with a horizontal smooth substrate, but could have a role for discoidal tips.
6. Discussion
Once the parameters  and
and  are determined, the model provides
  curves in good agreement with the experimental data. Nevertheless, the model sometimes failed to produce a valid solution, mostly at very small or at large
  . Either there is no value of R that holds the required liquid volume
  or the local angle of the tip
  becomes larger than
  . On the one hand, at small
  the extremity of the tip might not bend significantly in response to capillary forces, which could invalidate our hypothesis of a wedge-shaped liquid meniscus [24]. On the other hand, the angles measured for
  correspond to the stalk angle, which is not considered in our model. However, these limitations do not undermine the quality of the fit in the intermediate range of
  .
.
After matching to experimental data, the approximated elasto-capillary number  always gravitates around unity. This dimensionless number represents the ratio between capillary forces and elastic deformation. We then conclude that both ingredients are equally involved in insect adhesion. The match on
  yields an estimation of the liquid volume V in a single meniscus. The order of magnitude is tenths of femtolitres, in agreement with the amount of liquid collected from the footprints of a related leaf beetle [11].
The stiffness of each tip inferred in this study can also be compared to other data in the literature. A Young modulus of 1.2 MPa was measured by nanoindentation on the tip of severed setae from the lady beetle C. septempunctata [12]. These results were proven consistent with the deflection of G. viridula seta tips on structured substrates [13]. TEM images revealed that seta tips consist of a fibrillar bulk surrounded by a denser outer shell [32]. The shell is probably stiffer so it would provide most of the resistance to bending, similar to an I-beam. Young's modulus E of the shell is then given by
| 6.1 |
where w, h, e and B are the local width and height, the flange thickness and the bending stiffness, respectively. TEM images [32] suggest that  , whereas the height h can be approximated by profile
  (equations (4.5) and (4.6)) and the width w measured from our images (table 1). Our combined experiments and elasto-capillary model provided estimations of
  (table 2), from which we can infer Young's modulus for each seta tip:
  ,
,  ,
,  . Our estimations are thus one or two orders of magnitude higher than the nanoindentation results. The two experiments, however, involve different bending deformations (figure 12). In the present experiment, the seta tip is fully bent and the entire cross-section contributes to the stiffness. By contrast, the nanoindentation experiments [12] were performed with an indentation depth of about 50 nm, which is only sufficient to bend the thin outer shell instead of actually compressing it. In other words, the force/displacement ratio
  measured in nanoindentation corresponds in first approximation to the bending of a thin sheet of thickness e, width and length w and Poisson's ratio
  clamped at both ends
| 6.2 |
rather than the compression of a bulk material in Hertzian contact (as calculated in [12]):
| 6.3 |
where  is the indentation tip radius. The ratio between the two estimations of Young's modulus is
| 6.4 |
Figure 12.
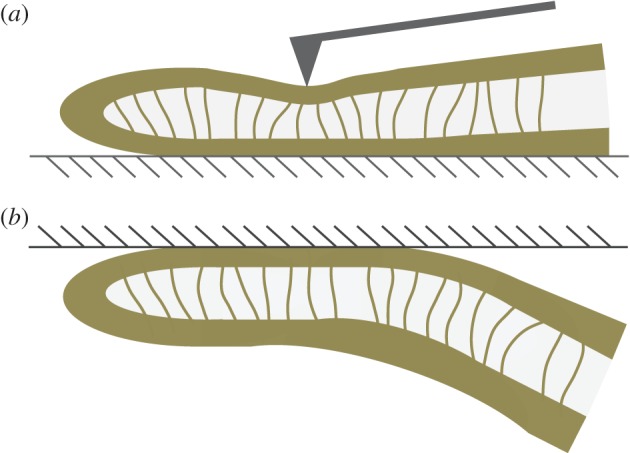
Schematic view of a sagittal cut of the seta tip in two bending configurations: (a) nanoindentation and (b) contact with a flat surface (hatched area). (Online version in colour.)
Thus, an approximated value of Young's modulus of the shell by nanoindentation would be  , which is now of the same order of magnitude as our estimations. Although this approach offers a first understanding of the modulus difference, a more precise comparison could consider other sources of discrepancy, such as the occurrence of finite size effects during indentation.
In vivo compression of G. viridula setae [8] have already revealed that each of the three kinds of tips has a different spring constant k (defined as the ratio between a force applied at the end of the tip and its maximum deflection). Discoidal tips ( ) are significantly stiffer than spatula (
 ) and pointed tips (
 ). We can also infer spring constants from our estimations of B (table 2) by solving equation (4.3) in the limit of small deformation. We obtain
  ,
,  and
and  . Although the same hierarchy appears, the stiffness levels are significantly lower here than in [8]. This can again be understood from the difference in loading between both experiments: in [8], the entire seta is subject to bending with a stalk several orders of magnitude stiffer than the tip. During contact, most of the elastic deformation will thus occur in the tip as described in our model.
Direct measurement of the adhesion force  associated with each seta type is also available from [8]:
  ,
,  and
and  . Once again, our estimations are in fair agreement: they have the same order of magnitude and the ratio between different tips is also consistent, although our model systematically underestimates
  by a factor of two. Nevertheless, we get to the conclusion that stiffer hairs lead to higher adhesion. This result is consistent with the idea that a stiffer pad can distribute stresses over a larger area and thereby maximize adhesion [35,36]. The higher adhesion developed by discoidal hairs on smooth surfaces is to be related to their presence on male individuals only. They are indeed expected to enhance attachment to the female elytra during mating. On the other hand, despite granting lower levels of adhesion, the spatula-shaped hairs certainly offer a more robust locomotion strategy, because a small decrease in contact length does not result in a drastic change in adhesion force: when walking on uneven surfaces, sufficient adhesion will be granted even if the pad is not perfectly aligned and tips are in partial contact. For locomotion, perhaps the most essential parameter is the controllability (shear-sensitivity) of adhesion, and it seems that this is achieved most efficiently in the spatula-shaped hairs, as they are highly direction-dependent. The pointed hairs generally achieve only very little adhesion, and may be most important for generating friction by making side-contacts [8].
As described by the analytical model, any flexible structure coupled with a capillary bridge enables generation of adhesion similar to insects with hairy pads. The degree of stiffness allocated to the structure and the amount of liquid used would determine whether strong or robust adhesion is favoured. Such an elasto-capillary equilibrium can also be modified by varying clamping parameters, thus allowing control over adhesion. Further study of the model is necessary for a complete understanding of the elasto-capillary system but will be of great interest for the design of a bioinspired manipulation tool.
7. Conclusion
Many insect species can adhere to smooth substrates thanks to hairy adhesive pads. Although liquid footprints have been observed, the exact amount and the detailed role played by the liquid in the adhesion mechanism were still unclear, as was the function of different kinds of seta tips with different geometry and elastic properties.
In this paper, we have presented IRM measurements of the three-dimensional geometry of the seta tips of a living insect leg in controlled contact with a smooth substrate. Three kinds of seta tips (spatula-shaped, discoidal and pointed) could be distinguished, from both the shape of the contact area and from the average angle between the seta tip and the substrate. This angle was found to be the same for a given contact length, independent of the direction of motion (loading versus unloading).
This observation suggests that there is a local force equilibrium, in which the seta tip is deflected by the normal reaction force from the substrate and the capillary forces from the intervening liquid wedge. We modelled the seta tip as a slender beam and calculated its deflection as a function of both its bending stiffness and the liquid volume. We could then infer these two unknown properties by matching the predicted deflection to the IRM measurements. The model captured well the evolution of the tip geometry with increasing contact area. Moreover, the resulting adhesion force level and bending stiffness correspond to the values obtained by other experimental methods in previous studies. This agreement shows that a simplified model based on the combination of capillary forces and elastic deformations can account for the measured behaviour of seta tips. The observed elasto-capillary number  of the order of unity suggests that both capillary and elastic forces are equally essential to rationalize the adhesion mechanism.
At every step of this study, significant differences were observed between spatula-shaped, discoidal and pointed tips. Discoidal tips are stiffer while pointed tips are more compliant. Discoidal tips also involve a significantly larger volume of liquid. These features are consistent with the biological function of discoidal tips in males during mating.
Surface tension dominates the microscopic realm, and in many different contexts insects have been witnessed to make the most of it [37–40]. This work confirms that the interplay of capillary and elastic forces is probably the key ingredient responsible for the reversible adhesion of hairy pads on smooth substrates. Nevertheless, direct in vivo observation at the sub-micrometre scale of seta tips remains technically challenging, and future work is still required to elucidate and model the mechanics of these remarkable adhesive microstructures.
Supplementary Material
Supplementary Material
Acknowledgement
The authors are grateful to Ph. Compère for his assistance with taking SEM pictures, and to S. Dehaeck for his help with the interpretation of interferometry measurements. The authors also thank D. Labonte and Y. Zhou for help conducting the experiments and to M. Mayser, H.-H. Goetzke and A. Hackmann for fruitful discussions.
Authors' contributions
The authors contributed equally to this work.
Competing interests
We declare we have no competing interests.
Funding
This work has been supported by the IAP 7/38 MicroMAST funded by BELSPO (Belgian Science Office Policy), and by a FRIA grant (FNRS, Belgium).
References
- 1.Lambert P. 2007. Capillary forces in microassembly: modeling, simulation, experiments, and case study. Berlin, Germany: Springer. [Google Scholar]
- 2.Fantoni G, et al. 2014. Grasping devices and methods in automated production processes. CIRP Ann. Manuf. Technol. 63, 679–701. ( 10.1016/j.cirp.2014.05.006) [DOI] [Google Scholar]
- 3.Arutinov G, Mastrangeli MC, Van Heck G, Lambert P, Den Toonder J, Dietzel A, Smits E. 2015. Capillary gripping and self-alignment: a route toward autonomous heterogeneous assembly. IEEE Trans. Robot. 31, 1033–1043. ( 10.1109/TRO.2015.2452775) [DOI] [Google Scholar]
- 4.Gravish N, Wilkinson M, Autumn K. 2008. Frictional and elastic energy in gecko adhesive detachment. J. R. Soc. Interface 5, 339–348. ( 10.1098/rsif.2007.1077) [DOI] [PMC free article] [PubMed] [Google Scholar]
- 5.Santos D, Spenko M, Parness A, Kim S, Cutkosky M. 2007. Directional adhesion for climbing: theoretical and practical considerations. J. Adhesion Sci. Technol. 21, 1317–1341. ( 10.1163/156856107782328399) [DOI] [Google Scholar]
- 6.Yu J, Chary S, Das S, Tamelier J, Turner K, Israelachvili J. 2012. Friction and adhesion of gecko-inspired PDMS flaps on rough surfaces. Langmuir 28, 11 527–11 534. ( 10.1021/la301783q) [DOI] [PubMed] [Google Scholar]
- 7.Federle W. 2006. Why are so many adhesive pads hairy? J. Exp. Biol. 209, 2611–2621. ( 10.1242/jeb.02323) [DOI] [PubMed] [Google Scholar]
- 8.Bullock J, Federle W. 2011. Beetle adhesive hairs differ in stiffness and stickiness: in vivo adhesion measurements on individual setae. Naturwissenschaften 98, 381–387. ( 10.1007/s00114-011-0781-4) [DOI] [PubMed] [Google Scholar]
- 9.Langer GM, Ruppersberg JP, Gorb SD. 2004. Adhesion forces measured at the level of a terminal plate of the fly's seta. Proc. R. Soc. Lond. B 271, 2209–2215. ( 10.1098/rspb.2004.2850) [DOI] [PMC free article] [PubMed] [Google Scholar]
- 10.Kesel A, Martin A, Seidl T. 2003. Adhesion measurements on the attachment devices of the jumping spider Evarcha arcuata. J. Exp. Biol. 206, 2733–2738. ( 10.1242/jeb.00478) [DOI] [PubMed] [Google Scholar]
- 11.Abou B, Gay C, Laurent B, Cardoso O, Voigt D, Peisker H, Gorb S. 2010. Extensive collection of femtolitre pad secretion droplets in the beetle Leptinotarsa decemlineata allows nanolitre microrheology. J. R. Soc. Interface 7, 1745–1752. ( 10.1098/rsif.2010.0075) [DOI] [PMC free article] [PubMed] [Google Scholar]
- 12.Peisker H, Michels J, Gorb S. 2013. Evidence for a material gradient in the adhesive tarsal setae of the ladybird beetle Coccinella septempunctata. Nat. Commun. 4, 1661 ( 10.1038/ncomms2576) [DOI] [PubMed] [Google Scholar]
- 13.Zhou Y, Robinson A, Steiner U, Federle W. 2014. Insect adhesion on rough surfaces: analysis of adhesive contact of smooth and hairy pads on transparent microstructured substrates. J. R. Soc. Interface 11, 20140499 ( 10.1098/rsif.2014.0499) [DOI] [PMC free article] [PubMed] [Google Scholar]
- 14.Peisker H, Gorb S. 2012. Evaporation dynamics of tarsal liquid footprints in flies (Calliphora vicina) and beetles (Coccinella septempunctata). J. Exp. Biol. 215, 1266–1271. ( 10.1242/jeb.065722) [DOI] [PubMed] [Google Scholar]
- 15.Voigt D, Schuppert J, Dattinger S, Gorb S. 2008. Sexual dimorphism in the attachment ability of the Colorado potato beetle Leptinotarsa decemlineata (Coleoptera: Chrysomelidae) to rough substrates. J. Insect Physiol. 54, 765–776. ( 10.1016/j.jinsphys.2008.02.006) [DOI] [PubMed] [Google Scholar]
- 16.Bullock J, Federle W. 2009. Division of labour and sex differences between fibrillar, tarsal adhesive pads in beetles: effective elastic modulus and attachment performance. J. Exp. Biol. 212, 1876–1888. ( 10.1242/jeb.030551) [DOI] [PubMed] [Google Scholar]
- 17.Dirks J-H. 2014. Physical principles of fluid-mediated insect attachment—shouldn't insects slip? Beilstein J. Nanotechnol. 5, 1160–1166. ( 10.3762/bjnano.5.127) [DOI] [PMC free article] [PubMed] [Google Scholar]
- 18.Federle W, Riehle M, Curtis A, Full R. 2002. An integrative study of insect adhesion: mechanics and wet adhesion of pretarsal pads in ants. Integr. Comp. Biol. 42, 1100–1106. ( 10.1093/icb/42.6.1100) [DOI] [PubMed] [Google Scholar]
- 19.Federle W, Baumgartner W, Hölldobler B. 2004. Biomechanics of ant adhesive pads: frictional forces are rate- and temperature-dependent. J. Exp. Biol. 207, 67–74. ( 10.1242/jeb.00716) [DOI] [PubMed] [Google Scholar]
- 20.Drechsler P, Federle W. 2006. Biomechanics of smooth adhesive pads in insects: influence of tarsal secretion on attachment performance. J. Comp. Physiol. A 192, 1213–1222. ( 10.1007/s00359-006-0150-5) [DOI] [PubMed] [Google Scholar]
- 21.Labonte D, Federle W. 2015. Rate-dependence of ‘wet’ biological adhesives and the function of the pad secretion in insects. Soft Matter 11, 8661–8673. ( 10.1039/C5SM01496D) [DOI] [PubMed] [Google Scholar]
- 22.Persson B. 2007. Biological adhesion for locomotion: basic principles. J. Adhes. Sci. Technol. 21, 1145–1173. ( 10.1163/156856107782328335) [DOI] [Google Scholar]
- 23.Bullock J, Drechsler P, Federle W. 2008. Comparison of smooth and hairy attachment pads in insects: friction, adhesion and mechanisms for direction-dependence. J. Exp. Biol. 211, 3333–3343. ( 10.1242/jeb.020941) [DOI] [PubMed] [Google Scholar]
- 24.Kwon H-M, Kim H-Y, Puell J, Mahadevan L. 2008. Equilibrium of an elastically confined liquid drop. J. Appl. Phys. 103, 093519 ( 10.1063/1.2913512) [DOI] [Google Scholar]
- 25.McEwan A, Taylor G. 1966. The peeling of a flexible strip attached by a viscous adhesive. J. Fluid Mech. 26, 1 ( 10.1017/S0022112066001058) [DOI] [Google Scholar]
- 26.Vincent J, Wegst U. 2004. Design and mechanical properties of insect cuticle. Arthrop. Struct. Dev. 33, 187–199. ( 10.1016/j.asd.2004.05.006) [DOI] [PubMed] [Google Scholar]
- 27.Gorb SB, Schuppert J, Walther P, Schwarz H. 2012. Contact behaviour of setal tips in the hairy attachment system of the fly Calliphora vicina (Diptera, Calliphoridae): a cryo-SEM approach. Zoology 115, 142–150. ( 10.1016/j.zool.2011.10.006) [DOI] [PubMed] [Google Scholar]
- 28.De Gennes P-G, Brochard-Wyart F, Quéré D. 2004. Capillarity and wetting phenomena: drops, bubbles, pearls, waves. New York, NY: Springer. [Google Scholar]
- 29.Dirks J-H, Federle W. 2011. Mechanisms of fluid production in smooth adhesive pads of insects. J. R. Soc. Interface 8, 952–960. ( 10.1098/rsif.2010.0575) [DOI] [PMC free article] [PubMed] [Google Scholar]
- 30.Wiegand G, Neumaier K, Sackmann E. 1998. Microinterferometry: three-dimensional reconstruction of surface microtopography for thin-film and wetting studies by reflection interference contrast microscopy (RICM). Appl. Opt. 37, 6892 ( 10.1364/AO.37.006892) [DOI] [PubMed] [Google Scholar]
- 31.Yoshizawa H, Chen Y-L, Israelachvili J. 1993. Fundamental mechanisms of interfacial friction. 1. Relation between adhesion and friction. J. Phys. Chem. 97, 4128–4140. ( 10.1021/j100118a033) [DOI] [Google Scholar]
- 32.Eimüller TB, Guttmann P, Gorb S. 2008. Terminal contact elements of insect attachment devices studied by transmission X-ray microscopy. J. Exp. Biol. 211, 1958–1963. ( 10.1242/jeb.014308) [DOI] [PubMed] [Google Scholar]
- 33.Geiselhardt S, Geiselhardt S, Peschke K. 2009. Comparison of tarsal and cuticular chemistry in the leaf beetle Gastrophysa viridula (Coleoptera: Chrysomelidae) and an evaluation of solid-phase microextraction and solvent extraction techniques. Chemoecology 19, 185–193. ( 10.1007/s00049-009-0021-y) [DOI] [Google Scholar]
- 34.Bico J, Roman B, Moulin L, Boudaoud A. 2004. Adhesion: elastocapillary coalescence in wet hair. Nature 432, 690 ( 10.1038/432690a) [DOI] [PubMed] [Google Scholar]
- 35.Bartlett M, Crosby A. 2013. Scaling normal adhesion force capacity with a generalized parameter. Langmuir 29, 11 022–11 027. ( 10.1021/la4013526) [DOI] [PubMed] [Google Scholar]
- 36.Labonte D, Federle W. 2015. Scaling and biomechanics of surface attachment in climbing animals. Phil. Trans. R. Soc. B 370, 20140027 ( 10.1098/rstb.2014.0027) [DOI] [PMC free article] [PubMed] [Google Scholar]
- 37.Bush JW, Hu DL, Prakash M. 2008. Advances in insect physiology. Adv. Insect Physiol. 34, 117–192. ( 10.1016/S0065-2806(07)34003-4) [DOI] [Google Scholar]
- 38.Prakash M, Bush JW. 2011. Interfacial propulsion by directional adhesion. Int. J. Non-linear Mech. 46, 607–615. ( 10.1016/j.ijnonlinmec.2010.12.003) [DOI] [Google Scholar]
- 39.Voise J, Schindler M, Casas J, Raphaël E. 2011. Capillary-based static self-assembly in higher organisms. J. R. Soc. Interface 8, 1357–1366. ( 10.1098/rsif.2010.0681) [DOI] [PMC free article] [PubMed] [Google Scholar]
- 40.Kim S, Hasanyan J, Gemmell B, Lee S, Jung S. 2015. Dynamic criteria of plankton jumping out of water. J. R. Soc. Interface 12, 20150582 ( 10.1098/rsif.2015.0582) [DOI] [PMC free article] [PubMed] [Google Scholar]
Associated Data
This section collects any data citations, data availability statements, or supplementary materials included in this article.


