

Summary
CYP2A6 activity and genotype were determined for five racial/ethnic groups with variable lung cancer risk. Only in Japanese Americans did CYP2A6 activity or genotype predict smoking intensity, as defined by urinary total nicotine equivalents.
Abstract
Genetic variation in cytochrome P450 2A6 (CYP2A6) gene is the primary contributor to the intraindividual and interindividual differences in nicotine metabolism and has been found to influence smoking intensity. However, no study has evaluated the relationship between CYP2A6 genetic variants and the CYP2A6 activity ratio (total 3-hydroxycotinine/cotinine) and their influence on smoking intensity [total nicotine equivalents (TNE)], across five racial/ethnic groups found to have disparate rates of lung cancer. This study genotyped 10 known functional CYP2A6 genetic or copy number variants in 2115 current smokers from the multiethnic cohort study [African Americans (AA) = 350, Native Hawaiians (NH) = 288, Whites = 413, Latinos (LA) = 437 and Japanese Americans (JA) = 627] to conduct such an investigation. Here, we found that LA had the highest CYP2A6 activity followed by Whites, AA, NH and JA, who had the lowest levels. Adjusting for age, sex, race/ethnicity and body mass index, we found that CYP2A6 diplotypes were predictive of TNE levels, particularly in AA and JA (P trend < 0.0001). However, only in JA did the association remain after accounting for cigarettes per day. Also, it is only in this population that the lower activity ratio supports lower TNE levels, carcinogen exposure and thereby lower risk of lung cancer. Despite the association between nicotine metabolism (CYP2A6 activity phenotype and diplotypes) and smoking intensity (TNE), CYP2A6 levels did not correlate with the higher TNE levels found in AA nor the lower TNE levels found in LA, suggesting that other factors may influence smoking dose in these populations. Therefore, further study in these populations is recommended.
Introduction
Globally, among men and women, lung cancer is the most common occurring cancer and cause of cancer-related mortality (1). Although cigarette smoking is the primary risk factor for this disease, the risk is disparate across sex and populations. For the same lifetime quantity of cigarettes smoked, when compared with Whites, African Americans (AA) and Native Hawaiians (NH) have higher risk of disease, whereas Japanese Americans (JA) and Latinos (LA) have lower risk of disease (2). One of the differences in disease risk may be a result of the differences in internal dose of tobacco smoke constituents.
Nicotine is primarily metabolized through the cytochrome P450 2A6 (CYP2A6) catalyzed 5′ oxidation pathway (3). For the majority of smokers, >70% of nicotine metabolism occurs through this pathway, where nicotine is metabolized to cotinine and subsequently metabolized to 3-hydroxycotinine (3-HCOT). Nicotine, cotinine and 3-HCOT are each glucuronidated. The sum of the urinary concentration of these six compounds (nicotine equivalents) plus nicotine N-oxide, referred to as total nicotine equivalents (TNE) accounts for approximately 80% of the nicotine dose (3,4). Either TNE or nicotine equivalents are excellent biomarkers of daily nicotine uptake and total tobacco smoke exposure (4,5). The ratio of 3-HCOT to cotinine in plasma or urine has been used to assess relative CYP2A6 activity (3,6). In urine, a somewhat better measure of CYP2A6 activity may be the ratio of the sum of 3-HCOT and its glucuronide conjugate (total 3-HCOT) to cotinine (7).
Studies have shown that genetic variants of CYP2A6 are associated with variations in nicotine metabolism and the frequency of genetic variants can differ by race/ethnicity. For example, CYP2A6*4, a deletion allele occurs in >30% of Japanese as opposed to only 1% of Whites (8,9). Genetic polymorphisms resulting in no or reduced CYP2A6 activity alter nicotine metabolism and in some populations tobacco consumption (6,10–13). We have reported previously that lower CYP2A6 activity is associated with lower nicotine uptake (measured in nicotine equivalents) in JA, suggesting that the population’s lower risk of disease may be a result of less exposure to carcinogens (14). Moreover, CYP2A6 genetic variants associated with lower metabolism have also been shown to result in a decreased risk of lung cancer (13,15–19).
Here, using the subpopulation of multiethnic cohort study (MEC) current smokers who provided a urine sample, we investigated the variation of CYP2A6 activity in five racial/ethnic groups found to have disparate risk of lung cancer. Also, we investigated how much of the variance of the nicotine metabolism can be explained by CYP2A6 genetic variants identified previously as having an impact on enzyme levels or activity (8,20–23) and determine the relationship of CYP2A6 activity and CYP2A6 variants to smoking intensity.
Methods
Study population
This study comprises ~2300 MEC study participants who were current smokers at the time of biospecimen collection (7,24). The MEC is a prospective cohort study established to investigate the association of lifestyle and genetic factors with chronic diseases and is comprised of 215251 men and women between the ages of 45 and 75 years at baseline, primarily belonging to five ethnic/racial groups: AA, JA, LA, NH and Whites (25). Study recruitment occurred between 1993 and 1996 where potential participants were identified in Hawaii and California (primarily Los Angeles County) through drivers’ license files, voter registration lists and Health Care Financing Administration files. Each participant completed a mailed, self-administered questionnaire regarding demographic, dietary, lifestyle and other exposure factors. The Institutional Review Boards at the University of Southern California and University of Hawaii approved the study protocol.
Approximately 10 years after cohort entry, 2393 current smokers participated in the biospecimen subcohort by providing a blood sample and overnight or first morning urine, completing an epidemiologic and smoking history questionnaire and a medication record (24). Urine was kept on ice until processing. The smoking questions included the number of cigarettes per day (CPD) during the past 2 weeks. All samples were stored at −80°C until shipment to University of Minnesota on dry ice for biomarker analysis.
Nicotine metabolite and 4-(methylnitrosamino)-1-(3-pyridyl)-1-butanol analysis
The analyses for urinary TNE, cotinine, total 3-HCOT and total 4-(methylnitrosamino)-1-(3-pyridyl)-1-butanol (NNAL) (the sum of the NNK metabolites, NNAL and its glucuronides) were carried out and reported previously by us (7,24,26). The methods used were 96-well plate-based liquid chromatography-tandem mass spectrometry assays. The coefficient of variation for 22 undiluted samples from 10 blind replicates provided with the MEC samples were: TNE 9.9% and the total 3-HCOT/cotinine 8.2%. No samples included in the analysis (TNE > 1.27) had cotinine, nicotine or 3-HCOT values below their limits of quantitation (LOQ), 0.08, 0.11 and 0.09 nmol/ml, respectively. Nicotine N-oxide values < the LOQ (1.2ng/ml) were reported as half the LOQ.
CYP2A6 phenotype and genotype
The total 3-HCOT/cotinine was used as it is well characterized as a measure of CYP2A6 activity (7). We also examined the association by the measure of (3-HCOT + cotinine)/TNE, and the results were similar but due to the greater collinearity between this measure and TNE, as opposed to the total 3-HCOT/free cotinine ratio, we present findings using the latter.
Blood lymphocyte DNA was used to genotype 11 genetic variants previously found to be associated with nicotine metabolism in at least one racial/ethnic group in our study populations. These included a whole gene deletion (CYP2A6*4), a partial gene deletion (*12) and nine single-nucleotide polymorphisms (SNPs): rs28399444 (*20), rs56256500 (*23), rs28399435 (defining SNP of *14), rs61663607 (*1H), rs1801272 (*2), rs28399433 (*9), rs1137115 (*1A), rs5031016 (*7) and rs28399454 (*17). Rs5031016 and rs28399454 were genotyped using the Illumina Human1M-Duo BeadChip (27). Rs28399444 and rs56256500 were genotyped using the Kompetitive Allele-Specific PCR assay. For rs56256500 a predesigned assay by LGC group (UK) was used and for rs28399444, the assay primers were designed at the University of Hawaii Cancer Center (UHCC) Genomics Shared Resources (GSR) per primer design reported in Bloom et al. (21). The CYP2A6 whole gene deletion (*4) and partial gene deletion (*12) were genotyped with the 7900HT Fast Real-Time System (Life Technologies, Foster City, CA), using the TaqMan assays CYP2A6-Hs07545274_cn and CYP2A6-Hs07545275_cn, respectively. Copy number calls were determined using Life Technologies (28) CopyCaller v2.0 software. Approximately 5% blind duplicates were included for quality control. We found that rs28399444 was monomorphic, and it was left out of the analysis. Therefore, eight SNPs were retained for this analysis.
Due to high sequence homology in this region, particularly exons 7–9, the data were compiled and assessed for data inconsistencies. The presence or absence of first CYP2A6*4 and then CYP2A6*12 was determined. Next, for subjects genotyped as homozygous for either CYP2A6*4 or CYP2A6*12, i.e. with a whole or partial deleted region (exons 3–9), any genotyping data for SNPs in these regions were interpreted as an error and those subjects were recoded as having no genotyping data in the respective regions. Participants with only one copy of the gene or CYP2A6*12 could only be homozygous for genetic variants found within the respective regions, and thus, samples found to be heterozygous were determined to be an error and recoded as missing.
For this study analysis, all samples must have complete CYP2A6 genotype and phenotype data. Subjects with genetic relatedness, or conflicting or indeterminate sex were excluded. Also, samples with TNE <1.27 nmol/ml (sum of four times the LOQ for nicotine, cotinine, 3-HCOT and nicotine N-oxide) were excluded. After all exclusions, 2115 subjects were retained for this analysis. Haplotypes were determined using the PHASE software (29) for the 10 genetic variants.
Statistical methods
To calculate the geometric means for the CYP2A6 activity ratio, TNE and NNAL, the values were transformed by the natural log. Values presented in the tables are back-transformed using natural scale. To examine the difference in CYP2A6 activity, TNE and total NNAL across race/ethnicity, covariate-adjusted geometric means were computed for each ethnic/racial group at the mean covariate vector. All multivariable linear models were adjusted for the following predictors: age at time of urine collection (continuous), sex (when not stratified by sex), body mass index (BMI; kg/m2) (natural log) and creatinine (natural log for TNE and NNAL only as the CYP2A6 activity is expressed as a ratio not effected by urine concentration). Additional models were adjusted for CPD (natural log) (for CYP2A6 activity ratio, TNE and total NNAL) and CYP2A6 activity ratio (natural log) (for TNE and total NNAL). Among subjects in this analysis, 11 had missing BMI values and 42 missing values for CPD at time of urine collection. The missing values were imputed by the Markov Chain Monte Carlo method (7).
To examine the difference of CYP2A6 activity ratio across CYP2A6 diplotypes and across ethnic/racial groups, covariate-adjusted geometric means were computed for each ethnic/racial group at the mean covariate vector. The alleles were defined, based on enzymatic activity data in the literature (21,30,31), as follows: N (no variant alleles or *14); I (intermediate activity), *1H, *1A, *9, *17, *23; L (little or no activity), *4, *1A+2, *1H+2, *12, *1H+*7, *7. This resulted in the diplotypes being categorized into one of six enzymatic activity groups: N/N, N/I, N/L, I/I, I/L and L/L. The models were adjusted for age at time of urine collection (continuous), sex, race/ethnicity (when applicable), BMI (natural log) and the interaction term for race/ethnicity and CYP2A6 diplotype group. For the outcomes of TNE and total NNAL, creatinine (natural log) was also included in the model; we further examined the outcomes after adjusting for CPD.
To identify additional covariates that predicted CYP2A6 activity or TNE, we used stepwise regression with four variables forced into the model: age at the time of urine collection (continuous), sex (when applicable), race/ethnicity (when applicable), CPD (natural log) and TNE (natural log) (for CYP2A6). Variables that were allowed to compete in the stepwise regression analysis were those that provided additional information on smoking (e.g. smoking duration) or nicotine intake (e.g. TNE), CYP2A6 diplotypes, BMI and dietary or lifestyle factors that might modify nicotine metabolism (e.g. alcohol, soy, cruciferous vegetable intake) and hormone replacement therapy use. Here, the cumulative R 2 value was used to assess the percentage of variation of CYP2A6 activity accounted for by the independent variables.
Results
The characteristics of this multiethnic study population, stratified by race/ethnicity, are presented in Supplementary Table 1, available at Carcinogenesis Online. The population is comprised of male and female smokers (average age 60 years) from five ethnic/racial groups (AA = 350, NH = 288, Whites = 413, LA = 437 and JA = 627). In all, NH were younger and LA were older (median = 60 and 65 years of age, respectively). Whites were the heaviest smokers (median CPD = 18) and LA the lightest (7 CPD). The distributions were consistent across sex.
The geometric mean of CYP2A6 activity (the urinary ratio of total 3-HCOT to cotinine) was higher in LA and lowest in NH and JA compared with Whites and AA (Figure 1A and Supplemental Table 2, available at Carcinogenesis Online). This pattern was observed in both men and women. Women had slightly higher CYP2A6 activity levels across all ethnic/racial groups. The difference by sex was found to be statistically significant in AA, LA and Whites (P values = 0.005, 0.02 and 0.0008, respectively).
Figure 1.
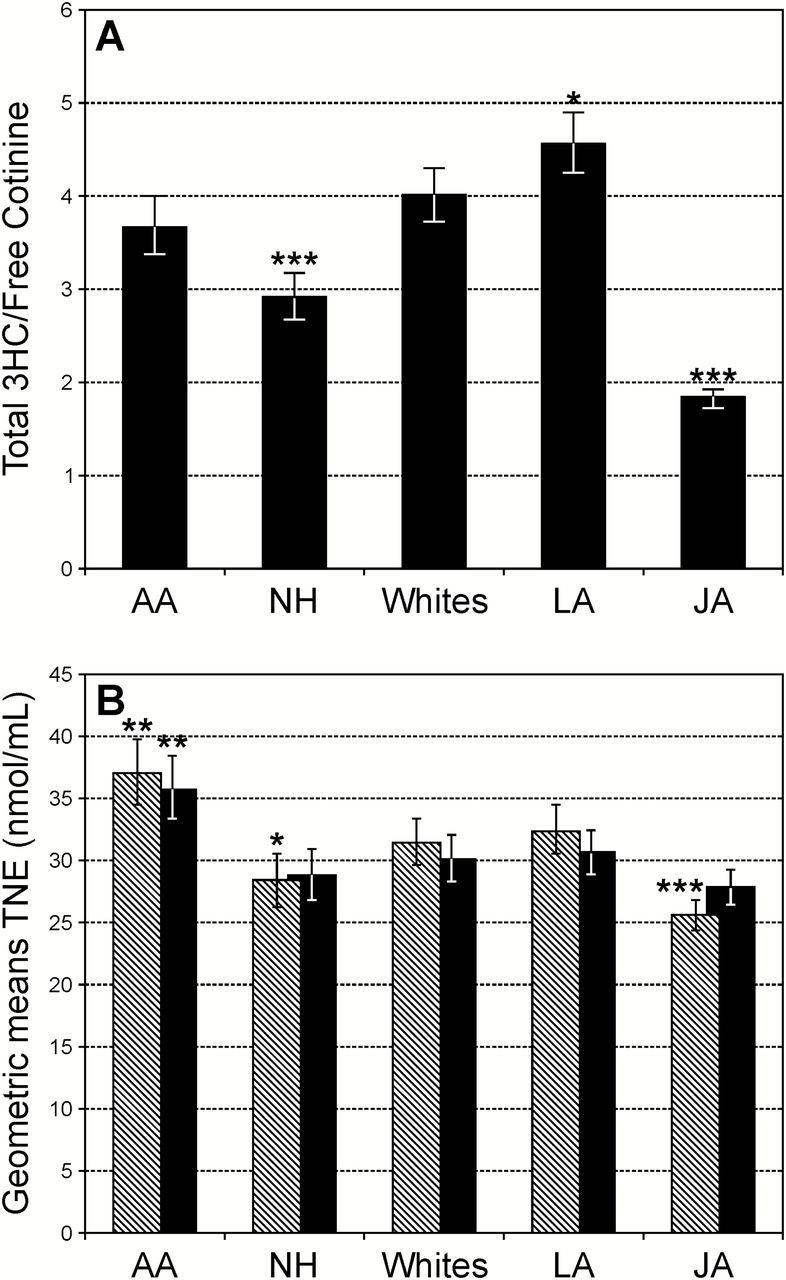
CYP2A6 activity and TNE stratified by racial/ethnic group. (A) The urinary ratio of total 3-HCOT to cotinine adjusted for age, sex, CPD and TNE; (B) TNE by racial/ethnic group adjusted for age, sex, BMI and CPD (hatched bars) and additionally adjusted for CYP2A6 activity (black bars). *P < 0.04, **P < 0.001, ***P < 0.0001 for difference between this group and Whites.
Among the five ethnic/racial groups, the geometric mean for TNE, adjusting for age, sex, creatinine, BMI and CPD, was highest in AA and lowest in JA. The mean TNE levels of NH were lower than in LA and Whites, which were not significantly different from one another (Figure 1B). After adjusting for CYP2A6 activity, TNE levels were comparable with Whites for all ethnic groups, but AA in whom the level remained significantly higher (Figure 1B and Supplemental Table 2, available at Carcinogenesis Online) (P = 0.0004). Similarly, the urinary concentration of NNAL, after adjusting for CYP2A6 activity, was not different between JA and Whites (P = 0.13). However, the urinary NNAL concentrations for AA and LA were higher than those of Whites (P ≤ 0.04, Supplemental Table 2, available at Carcinogenesis Online).
To determine the role of CYP2A6 variants in the observed ethnic/racial differences in TNE levels, 2115 MEC participants were genotyping for eight CYP2A6 SNPs and two copy number variants (CNV) known to influence CYP2A6 activity in at least one of the groups. After phasing the data, 14 different haplotypes were identified (Figure 2 and Supplemental Table 3, available at Carcinogenesis Online). The most common haplotype (referred to as ‘N’) was that with one copy of the wild-type allele for each of the eight SNPs and a full copy of the gene (40.6%). Other common haplotypes included CYP2A6*1A (17.3%), CYP2A6*9 (14.0%), CYP2A6*4 (8.7%) and CYP2A6*1H (7.2%). In all groups, except JA, the haplotype N was the most commonly observed. In JA, the CYP2A6*9, CYP2A6*4 and ‘N’ haplotypes were observed with similar frequencies (21%). The CYP2A6*4 and CYP2A6*9 haplotypes were also relatively frequent in NH (10 and 21%). CYP2A6*1A was the second most common haplotype in AA, NH, Whites and LA. In AA, CYP2A6*17 and CYP2A6*1H were the third most commonly occurring haplotypes (10.9 and 10.4%, respectively). CYP2A6*17 was only present in AA and LA, although quite rare in the latter population (0.2%). In general, the distribution of the CYP2A6 haplotypes in LA was similar to that in Whites but with a higher frequency of the *9 haplotype and lower frequency of *1H and *1A. Eight different CYP2A6*1x2 alleles were found in 10 participants, 2 AA, 3 NH, 2 Whites, 1 LA and 2 JA, (Supplemental Table 3, available at Carcinogenesis Online).
Figure 2.

Distribution of CYP2A6 haplotype. Haplotypes, PHASED from eight SNPs and two deletions, are listed in the order of predicted metabolic activity [normal, N (green) to non-functional or deleted, *12 and *4 (red)]. The allele nomenclature is as described at http://www.cypalleles.ki.se/cyp2a6.htm.
In this cohort of MEC smokers, 68 CYP2A6 diplotypes were observed. The median ratio of total 3-HCOT to cotinine (CYP2A6 activity) for each diplotype stratified by race/ethnicity is presented in Supplemental Table 4, available at Carcinogenesis Online. The median CYP2A6 activity for smokers with the N/N diplotype (n = 408) was 6.08 (interquartile range = 4.2–9.0). This diplotype was common in LA (34.8%), Whites (28.3%) and AA (22.3%), whereas it was not as common in NH (10.4%) and JA (4.9%). For NH, the N/*1A diplotype (18.8%) was most common (median CYP2A6 activity = 3.51, interquartile range: 2.61–5.39). The most common diplotype in JA was *4/*1H (9.4%), this group was found to have little CYP2A6 enzymatic activity (median = 0.56; interquartile range: 0.39–1.1). The median CYP2A6 activity for the 37 participants (33 JA, 2 NH and 2 LA) who were homozygous for the CYP2A6 deletion allele, (*4/*4) was 0.37, (interquartile range 0.24–0.69). For all but three diplotypes, *1A+*2/*1A+*2 (n = 1) and two of the *1 X 2 diplotypes (n = 3), the CYP2A6 activity ratio fell between that of the N/N and *4/*4 diplotypes (median CYP2A6 activity = 0.173, 11.5 and 8.4, respectively).
The 68 CYP2A6 diplotypes represented in this study were grouped into seven categories based on the enzymatic activity reported for the CYP2A6 alleles. Six categories, referred to as N/N, N/I (intermediate activity), N/L (loss of activity), I/I, I/L and L/L are defined in Table 1. The mean CYP2A6 activity of these diplotype groups were determined and stratified by ethnic/racial group (Table 1). (The seventh category was comprised of the eight different *1X2 haplotypes and was not included in these analyses.) In all ethnic/racial groups the ratio of total 3-HCOT to cotinine decreased as the diplotypes predicted CYP2A6 activity decreased (P < 0.0001). However, the ratio for a diplotype group sometimes varied by ethnicity. The total 3-HCOT/cotinine ratio for the L/L group in Whites was significantly higher than in the other ethnic/racial groups and in contrast to non-Whites, it did not differ from the I/L group (P > 0.05). These differences may in part be driven by the varied composition of the diplotype groups among the ethnic groups. Alternatively, this may be due to differences in the effect of a CYP2A6 haplotype on enzyme activity in a particular ethnic/racial group.
Table 1.
CYP2A6 activity, TNE and NNAL by diplotype groups, stratified by race/ethnicity
| Metabolism diplotype groupa | All | AA | NH | Whites | LA | JA | |||||||||||||
|---|---|---|---|---|---|---|---|---|---|---|---|---|---|---|---|---|---|---|---|
| Ratio of total 3-HCOT/cotinine [geometric mean (95% CI)]b | |||||||||||||||||||
| N | N | N | N | N | N | P valuec | |||||||||||||
| N/N | 440 | 5.67 | (5.27–6.11) | 81 | 6.58 | (5.74–7.54) | 30 | 5.24 | (4.20–6.55) | 136 | 5.68 | (5.12–6.31) | 162 | 6.64 | (6.04–7.32) | 31 | 4.52 | (3.63–5.62) | 0.005 |
| G1 (N/I) | 684 | 4.21 | (4.01–4.42) | 157 | 4.72 | (4.28–5.21) | 103 | 3.76 | (3.33–4.24) | 162 | 4.28 | (3.89–4.71) | 165 | 4.87 | (4.43–5.36) | 97 | 3.57 | (3.15–4.04)* | 0.001 |
| G2 (N/L) | 221 | 2.96 | (2.66–3.297) | 10 | 3.86 | (2.63–5.67) | 30 | 2.70 | (2.16–3.37) | 38 | 2.87 | (2.36–3.50) | 39 | 3.32 | (2.74–4.04) | 104 | 2.29 | (2.03–2.58) | 0.005 |
| G3 (I/I) | 344 | 2.79 | (2.61–2.99) | 89 | 3.03 | (2.66–3.45)** | 69 | 2.55 | (2.20–2.96)*** | 48 | 3.26 | (2.73–3.88) | 43 | 2.74 | (2.28–3.30)** | 95 | 2.46 | (2.17–2.78)*** | 0.044 |
| G4 (I/L) | 356 | 1.61 | (1.44–1.80) | 11 | 2.05 | (1.42–2.95) | 48 | 1.35 | (1.14–1.61) | 22 | 1.74 | (1.34–2.25) | 20 | 2.07 | (1.58–2.72) | 255 | 1.07 | (1.00–1.16)**** | <0.0001 |
| Loss (L/L) | 60 | 0.721 | (0.577–0.901) | 0 | 5 | 0.81 | (0.477–1.39)* | 6 | 1.65 | (1.01–2.69) | 6 | 0.502 | (0.308–0.818)***** | 43 | 0.401 | (0.334–0.481)***** | <0.0001 | ||
| P valued | <0.0001 | <0.0001 | <0.0001 | <0.0001 | <0.0001 | <0.0001 | |||||||||||||
| TNE [nmol/ml, geometric mean (95% CI)]e | |||||||||||||||||||
| N | N | N | N | N | N | P valuec | |||||||||||||
| N/N | 440 | 34.8 | (31.9–37.9) | 81 | 41.1 | (35.0–48.3) | 30 | 31.5 | (24.3–40.8) | 136 | 36.2 | (32.1–41.0) | 162 | 26.7 | (23.8–29.9)**** | 31 | 40.5 | (31.3–52.3) | <0.0001 |
| G1 (N/I) | 684 | 34.2 | (32.3–36.2) | 157 | 37 | (32.9–41.5) | 103 | 35.9 | (31.1–41.3) | 162 | 37.4 | (33.4–41.8) | 165 | 29.5 | (26.4–32.9)*** | 97 | 32.1 | (27.7–37.1) | 0.0159 |
| G2 (N/L) | 221 | 33.0 | (29.1–37.4) | 10 | 40.5 | (25.8–63.6) | 30 | 34.1 | (26.3–44.2) | 38 | 36.9 | (29.3–46.5) | 39 | 24.3 | (19.3–30.6)** | 104 | 31.7 | (27.5–36.5) | 0.0802 |
| G3 (I/I) | 344 | 27.8 | (25.6–30.1) | 89 | 29.4 | (25.2–34.2) | 69 | 26.8 | (22.6–31.8)** | 48 | 37.7 | (30.7–46.3) | 43 | 20.3 | (16.4–25.3)***** | 95 | 27.4 | (23.7–31.8)** | 0.0018 |
| G4 (I/L) | 356 | 26.4 | (23.1–30.1) | 11 | 25.8 | (16.8–39.6) | 48 | 29.8 | (24.3–36.7) | 22 | 27.2 | (20.1–36.9) | 20 | 26.0 | (18.9–35.7) | 255 | 23.4 | (21.4–25.6) | 0.2811 |
| Loss (L/L) | 60 | 22.2 | (17.0–29.0) | 0 | 5 | 29.6 | (15.6–56.1) | 6 | 23.7 | (13.2–42.6) | 6 | 20.7 | (11.5–37.0) | 43 | 16.7 | (13.4–20.8) | 0.0056 | ||
| P valued | <0.0001 | 0.015 | 0.1188 | 0.4254 | 0.0443 | <0.0001 | |||||||||||||
| NNAL concentration [pmol/ml, geometric mean (95% CI)]e | |||||||||||||||||||
| N | N | N | N | N | N | P valuec | |||||||||||||
| N/N | 423 | 1.30 | (1.19–1.41) | 79 | 1.63 | (1.39–1.90)* | 30 | 1.17 | (0.91–1.51) | 129 | 1.32 | (1.17–1.49) | 154 | 1.15 | (1.03–1.28) | 31 | 1.27 | (0.99–1.63) | 0.0086 |
| G1 (N/I) | 671 | 1.26 | (1.20–1.34) | 152 | 1.51 | (1.35–1.70) | 101 | 1.18 | (1.03–1.36) | 159 | 1.34 | (1.20–1.49) | 163 | 1.22 | (1.10–1.36) | 96 | 1.11 | (0.96–1.28)* | 0.005 |
| G2 (N/L) | 218 | 1.22 | (1.08–1.38) | 10 | 1.38 | (0.89–2.13) | 30 | 1.40 | (1.09–1.80) | 38 | 1.31 | (1.05–1.64) | 36 | 1.00 | (0.80–1.26) | 104 | 1.08 | (0.95–1.24) | 0.1651 |
| G3(I/I) | 329 | 1.03 | (0.955–1.12) | 84 | 1.13 | (0.97–1.32)* | 67 | 0.93 | (0.79–1.11)**** | 47 | 1.52 | (1.24–1.85) | 42 | 0.74 | (0.60–0.91)***** | 89 | 1.00 | (0.86–1.15)**** | <0.0001 |
| G4 (I/L) | 350 | 0.98 | (0.86–1.11) | 11 | 0.84 | (0.55–1.27) | 48 | 1.07 | (0.88–1.31) | 22 | 0.94 | (0.70–1.25) | 20 | 1.18 | (0.87–1.61) | 249 | 0.90 | (0.83–0.99) | 0.2977 |
| Loss (L/L) | 60 | 0.896 | (0.696–1.16) | 0 | 5 | 0.99 | (0.54–1.81) | 6 | 1.05 | (0.60–1.82) | 6 | 0.99 | (0.57–1.73) | 43 | 0.63 | (0.51–0.77) | 0.0055 | ||
| P valued | <0.0001 | 0.0008 | 0.0799 | 0.1246 | 0.0011 | 0.0158 | |||||||||||||
CI, confidence interval.
aDiplotype groups are defined by the functional activity of each allele as follows: N (no variant CYP2A6 SNPs), wild-type or *1A+*14; I (intermediate activity), *1H, *1A, *9, *17, *23; L (little or no activity), *4, *1A+2, *1H+2, *12, *1H+*7, *7.
bModel is adjusted for age, sex, race/ethnicity (when applicable), BMI (natural log) and the interaction term for race/ethnicity and CYP2A6 diplotype group.
cP value across race/ethnicity.
dP value across diplotype groups.
eModels are adjusted for age, sex, race/ethnicity (when applicable), BMI (natural log), the interaction term for race/ethnicity and CYP2A6 diplotype group, and creatinine (natural log).
*P < 0.05, **P < 0.02, ***P < 0.005, ****P < 0.001, *****P < 0.0001 for difference between value in Whites.
Despite some limitations (discussed more below), the CYP2A6 diplotype groups were used to determine the effect of CYP2A6 genotype on smoking intensity and tobacco carcinogen exposure. In AA, LA and JA, the diplotype groups with predicted lower CYP2A6 activity were associated with lower geometric mean TNE values (P trend = 0.015, 0.04, <0.0001, Table 1 and Figure 3). This trend was most clearly visible for JA smokers, for whom TNE levels decreased in a step wise fashion, N/N > N/I = N/L > I/I > I/L > L/L (Figure 3). With further adjustment for CPD, this trend remained in JA (P < 0.0001) and became nominally significant in AA (P = 0.08). Interestingly, the mean level of TNE in JA who do not carry any of the variant alleles (N/N) is comparable with the TNE level of the AA smoker in the N/N group (40.5 and 41.1 nmol/ml, respectively); this insignificance remained after adjusting for CPD (39.5 versus 35.1 nmol/ml, respectively; P value = 0.36). We did not observe a statistically significant relationship between TNE and diplotype group in NH and Whites (P trend > 0.12), but the relationships tended to be in the same direction. The same ethnic/racial patterns were observed for the relationship of urinary NNAL to the diplotype groups (Table 1).
Figure 3.
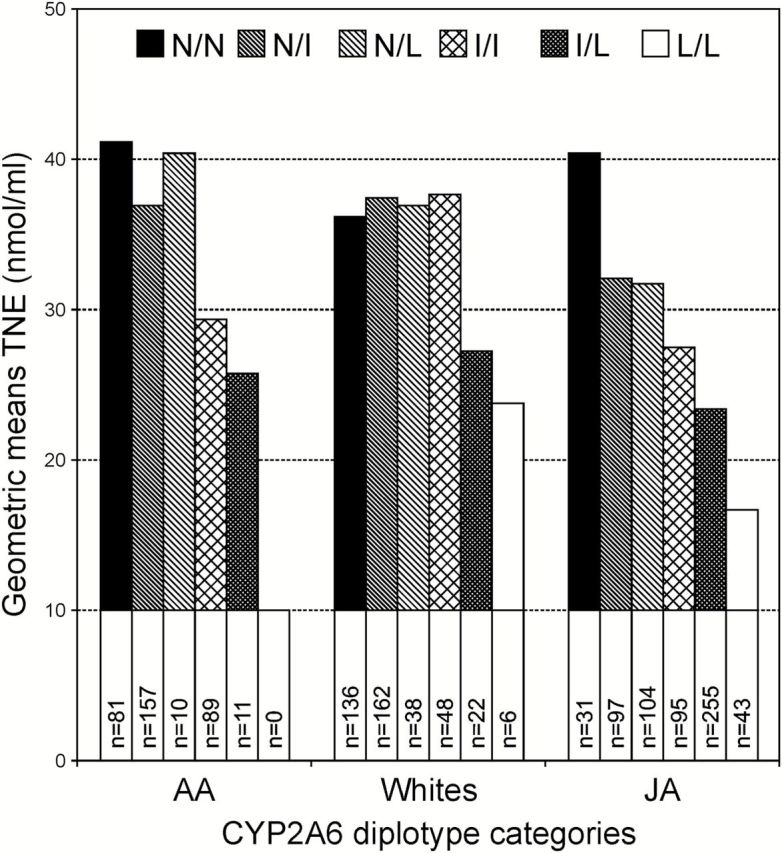
TNE by CYP2A6 diplotype. Diplotypes categories are defined by the functional activity of each allele as follows: N (no variant allele or *1A +*14); I (intermediate activity), *1H, *1A, *9, *17, *23; L (little or no activity), *4, *1A+2, *1H+2, *12, *1H+*7, *7.
To investigate possible ethnic-specific differences in the effect of a CYP2A6 haplotype on enzyme activity, we stratified by race/ethnicity and compared CYP2A6 activity by diplotype within each group (Table 2). The diplotypes included were the five most frequent for a group plus any that were among the top five in the other four groups (if n > 9). The geometric means of CYP2A6 activity for participants with each of these diplotype and the P values comparing that activity within each ethnic group are presented in Table 2. There are several ethnic specific CYP2A6 diplotype associations. Those that may affect the accuracy of our diplotype groups are discussed.
Table 2.
CYP2A6 activity by diplotype (P value for difference)a
| Groupb | Diplotype | Frequency | Mean activity | G1 | G2 | G3 | G4 | L | |||||||||||
|---|---|---|---|---|---|---|---|---|---|---|---|---|---|---|---|---|---|---|---|
| N/N | N/*1H | N/*1A | N/*9 | N/*17 | N/*1H+*7 | *4/N | *1A/*1A | *1A/*9 | *9/*9 | *4/*1A | *9/*1H+*7 | *4/*9 | *4/*1H | *4/*4d | |||||
| AA (n = 350) | N/N | 22.3% | 6.34 | Ref. | |||||||||||||||
| G1 | N/*1H | 11.4% | 4.81 | 0.0245 | Ref. | ||||||||||||||
| G1 | N/*1A | 16.9% | 5.17 | 0.0616 | 0.5724 | Ref. | |||||||||||||
| G1 | N/*9 | 4.8% | 3.30 | 0.0001 | 0.0406 | 0.0099 | Ref. | ||||||||||||
| G1 | N/*17 | 9.1% | 4.18 | 0.0019 | 0.3536 | 0.1253 | 0.2110 | Ref. | |||||||||||
| G3 | *1A/*1A | 5.4% | 4.14 | 0.0089 | 0.397 | 0.1839 | 0.2839 | 0.959 | Ref. | ||||||||||
| G3 | *1A/*9 | 3.1% | 3.67 | 0.0079 | 0.2123 | 0.1005 | 0.6636 | 0.5573 | 0.6164 | Ref. | |||||||||
| NH (n = 288) | N/N | 10.4% | 5.09 | Ref. | |||||||||||||||
| G1 | N/*1H | 4.9% | 3.83 | 0.0905 | Ref. | ||||||||||||||
| G1 | N/*1A | 18.8% | 3.70 | 0.0071 | 0.821 | Ref. | |||||||||||||
| G1 | N/*9 | 12.2% | 3.58 | 0.0066 | 0.6792 | 0.7711 | Ref. | ||||||||||||
| G2 | *4/N | 6.3% | 2.46 | <0.0001 | 0.0182 | 0.0046 | 0.0133 | Ref. | |||||||||||
| G3 | *1A/*1A | 4.5% | 3.33 | 0.014 | 0.4836 | 0.5152 | 0.6695 | 0.1103 | Ref. | ||||||||||
| G3 | *1A/*9 | 11.5% | 2.50 | <0.0001 | 0.0103 | 0.0007 | 0.0048 | 0.9223 | 0.0921 | Ref. | |||||||||
| G3 | *9/*9 | 4.5% | 1.65 | <0.0001 | <0.0001 | <0.0001 | <0.0001 | 0.033 | 0.0006 | 0.0144 | Ref. | ||||||||
| G4 | *4/*1A | 5.2% | 1.64 | <0.0001 | <0.0001 | <0.0001 | <0.0001 | 0.0244 | 0.0003 | 0.009 | 0.9773 | Ref. | |||||||
| G4 | *4/*9 | 5.6% | 1.04 | <0.0001 | <0.0001 | <0.0001 | <0.0001 | <0.0001 | <0.0001 | <0.0001 | 0.0171 | 0.0144 | Ref. | ||||||
| Whites (n = 412) | N/N | 28.3% | 5.70 | Ref. | |||||||||||||||
| G1 | N/*1H | 8.0% | 4.44 | 0.0335 | Ref. | ||||||||||||||
| G1 | N/*1A | 22.0% | 4.53 | 0.0057 | 0.868 | Ref. | |||||||||||||
| G1 | N/*9 | 6.0% | 3.57 | 0.0004 | 0.1676 | 0.0766 | Ref. | ||||||||||||
| G3 | *1A/*1A | 4.8% | 3.98 | 0.0124 | 0.5125 | 0.3741 | 0.5443 | Ref. | |||||||||||
| G3 | *1A/*9 | 2.4% | 2.98 | 0.001 | 0.064 | 0.0353 | 0.4163 | 0.2097 | Ref. | ||||||||||
| LA (n = 419) | N/N | 34.8% | 6.75 | Ref. | |||||||||||||||
| G1 | N/*1H | 4.6% | 6.28 | 0.5863 | Ref. | ||||||||||||||
| G1 | N/*1A | 15.8% | 5.09 | 0.0005 | 0.1336 | Ref. | |||||||||||||
| G1 | N/*9 | 14.9% | 4.42 | <0.0001 | 0.0134 | 0.1421 | Ref. | ||||||||||||
| G3 | *1A/*9 | 4.1% | 3.00 | <0.0001 | <0.0001 | 0.0004 | 0.009 | Ref. | |||||||||||
| JA (n = 627) | N/N | 4.9% | 4.58 | Ref. | |||||||||||||||
| G1 | N/*1H | 2.6% | 4.71 | 0.8798 | Ref. | ||||||||||||||
| G1 | N/*1A | 4.2% | 4.09 | 0.492 | 0.4703 | Ref. | |||||||||||||
| G1 | N/*9 | 8.8% | 3.15 | 0.0072 | 0.0219 | 0.0755 | Ref. | ||||||||||||
| G2 | N/*1H+*7 | 7.8% | 2.87 | 0.001 | 0.0055 | 0.0185 | 0.4457 | Ref. | |||||||||||
| G2 | *4/N | 8.3% | 1.83 | <0.0001 | <0.0001 | <0.0001 | <0.0001 | 0.0003 | Ref. | ||||||||||
| G3 | *1A/*1A | 2.7% | 3.59 | 0.194 | 0.2086 | 0.5034 | 0.4418 | 0.197 | 0.0001 | Ref. | |||||||||
| G3 | *1A/*9 | 4.3% | 2.63 | 0.0007 | 0.0029 | 0.0095 | 0.2151 | 0.5542 | 0.0136 | 0.1029 | Ref. | ||||||||
| G3 | *9/*9 | 4.9% | 1.84 | <0.0001 | <0.0001 | <0.0001 | 0.0001 | 0.0018 | 0.9753 | 0.0004 | 0.0284 | Ref. | |||||||
| G4 | *4/*1A | 5.4% | 1.87 | <0.0001 | <0.0001 | <0.0001 | 0.0001 | 0.002 | 0.8775 | 0.0004 | 0.0328 | 0.9135 | Ref. | ||||||
| G4 | *9/*1H+*7 | 8.3% | 1.23 | <0.0001 | <0.0001 | <0.0001 | <0.0001 | <0.0001 | 0.0011 | <0.0001 | <0.0001 | 0.0046 | 0.0024 | Ref. | |||||
| G4 | *4/*9 | 8.9% | 0.857 | <0.0001 | <0.0001 | <0.0001 | <0.0001 | <0.0001 | <0.0001 | <0.0001 | <0.0001 | <0.0001 | <0.0001 | 0.0023 | Ref. | ||||
| G4 | *4/*1H | 9.4% | 0.644 | <0.0001 | <0.0001 | <0.0001 | <0.0001 | <0.0001 | <0.0001 | <0.0001 | <0.0001 | <0.0001 | <0.0001 | <0.0001 | 0.0138 | Ref. | |||
| L | *4/*4 | 5.3% | 0.383 | <0.0001 | <0.0001 | <0.0001 | <0.0001 | <0.0001 | <0.0001 | <0.0001 | <0.0001 | <0.0001 | <0.0001 | <0.0001 | <0.0001 | 0.0001 | Ref. | ||
aThe diplotypes included are N/N and those that were the five most frequent in any of the five ethnic/racial groups. Diplotypes with fewer than 10 subjects within the ethnic groups are not listed for that group. CYP2A6 activity is the geometric mean of the total 3-HCOT to cotinine ratio. Models are adjusted for age, sex and BMI (log).
bGroups are defined as in Table 1.
In the four ethnic groups (AA, NH, JA and Whites), which had both *1A/*1A (G3, I/I) and N/*1A (G1, N/I) individuals, there was no difference in the mean CYP2A6 activity for these diplotypes (P’s > 0.18). These data suggest that individual with *1A/*1A and N/*1A diplotypes should be grouped together with regard to their metabolic activity.
Whites and AA with the N/*1H diplotype had lower CYP2A6 activity compared with those with N/N (P’s < 0.04). In contrast, NH, LA and JA, carriers of the N/*1H diplotype were found to have CYP2A6 activity similar to N/N individuals in the same racial/ethnic group (P’s ≥ 0.09). However, the CYP2A6 activity of JA who carry the *1H/*4 diplotype (n = 59) was significantly lower than the activity in JA with the N/*4 diplotype (n = 52), 0.64 versus 1.8 (Table 2). These somewhat conflicting results, do not allow us to draw any conclusions on the importance of the *1H variant to CYP2A6 activity in JA without further characterization of the CYP2A6 gene in this group.
In JA, the presence of *1A does not affect CYP2A6 activity alone or in combination with *9 or *4, whereas in Whites, NH and LA, this SNP affects enzyme activity. In JA smokers, the CYP2A6 activity of carriers of the N/*1A and *1A/*1A diplotypes do not differ from those with the N/N diplotype (Table 2, P’s = 0.492 and 0.1940, respectively). However, in NH, Whites, LA and AA CYP2A6 activity is significantly or nominally significantly lower (22–24%) in carriers of the N/*1A diplotype compared with N/N (P’s = 0.0005–0.0616). In NH, Whites and AA, CYP2A6 activity was significantly lower in carriers of the *1A/*1A compared with N/N (P’s = 0.009–0.01). There were no Latino subjects with *1A/*1A. Additionally, in Whites, LA and NH, CYP2A6 activity is the same in smokers with the N/*1A and those with N/*9 (P’s ≥ 0.08). Yet, AA and JA with the N/*9 diplotype have significantly lower CYP2A6 activity than do N/*1A or *1A/*1A individuals (P’s < 0.01). Interestingly, in AA, N/*1A, which was labeled as group 1, intermediate normal activity, was found to have similar enzymatic activity as *1A/*9 (group 3 = I/I) (P = 0.10). However, in the remaining four ethnic groups, *1A/*9 was found to have lower enzymatic activity than N/*1A (P’s < 0.04), especially in NH, LA and JA (P’s ≤ 0.01). All of which suggests that *9 may have greater influence over CYP2A6 activity in non-Whites and *1A may have a greater influence on activity in Whites compared with JA and possibly relative to other ethnic/racial groups.
A multivariable regression model was used to characterize the relative contribution of the 68 CYP2A6 diplotypes to our measure of CYP2A6 activity, the ratio of total 3-HCOT to cotinine (Table 3). We found that age, sex, race/ethnicity BMI, TNE and CPD explain 34% of the variation in CYP2A6 activity ratio. The CYP2A6 diplotypes helped to explain 30% more of the variation. In JA, these diplotypes explained 46% more of the variation. Whereas, in Whites and AA, these diplotypes explained 34–36% of the variation. In Whites, only 43% of the total variation was explained and in AA 50%, whereas in JA, 64% of the total variation was explained. The relative contribution of CYP2A6 diplotype to the variation in the total 3-HCOT to cotinine ratio was greater in females then males. The effect of sex on the contribution of CYP2A6 diplotype to the activity ratio was most pronounced in AA. Also, both the CYP2A6 phenotypes and diplotypes were comparable contributors of the variance in TNE (33 versus 29%). In AA, Whites and JA, the phenotype contributed more to the variance than the diplotypes. However, in NH, both the CYP2A6 phenotype and diplotype contributed equally to the variance of TNE and in LA the diplotypes contributed 2% more.
Table 3.
Determinants of the CYP2A6 activity ratio (urinary total 3-HCOT/cotinine) and TNE
| Independent variables | All | Males | Females | |||
|---|---|---|---|---|---|---|
| Cumulative R2 | % variation explained | Cumulative R2 | % variation explained | Cumulative R2 | % variation explained | |
| Determinants of CYP2A activity ratio | ||||||
| Base modela | 0.34 | — | 0.36 | — | 0.33 | — |
| + CYP2A6 diplotypes | 0.64 | 30 | 0.64 | 28 | 0.65 | 32 |
| Stratified by race/ethnicity | ||||||
| AA | ||||||
| Base model | 0.26 | — | 0.27 | — | 0.27 | — |
| + CYP2A6 diplotypes | 0.50 | 36 | 0.48 | 21 | 0.56 | 29 |
| NH | ||||||
| Base model | 0.14 | — | 0.10 | — | 0.19 | — |
| + CYP2A6 diplotypes | 0.59 | 45 | 0.61 | 51 | 0.62 | 43 |
| Whites | ||||||
| Base model | 0.18 | — | 0.26 | — | 0.12 | — |
| + CYP2A6 diplotypes | 0.44 | 34 | 0.51 | 25 | 0.47 | 35 |
| LA | ||||||
| Base model | 0.13 | — | 0.15 | — | 0.11 | — |
| + CYP2A6 diplotypes | 0.52 | 39 | 0.55 | 40 | 0.54 | 43 |
| JA | ||||||
| Base model | 0.18 | — | 0.20 | — | 0.15 | — |
| + CYP2A6 diplotypes | 0.64 | 46 | 0.63 | 43 | 0.68 | 53 |
| Determinants of TNE | ||||||
| Base modelb | 0.25 | — | 0.25 | — | 0.25 | — |
| + CYP2A6 phenotype | 0.33 | 8 | 0.33 | 8 | 0.31 | 6 |
| or + CYP2A6 diplotypes | 0.29 | 4 | 0.30 | 5 | 0.29 | 4 |
| Stratified by race/ethnicity | ||||||
| AA | ||||||
| Base model | 0.17 | — | 0.20 | — | 0.15 | — |
| + CYP2A6 phenotype or | 0.29 | 12 | 0.30 | 10 | 0.28 | 13 |
| + CYP2A6 diplotypes | 0.26 | 9 | 0.35 | 15 | 0.24 | 9 |
| NH | ||||||
| Base model | 0.23 | — | 0.20 | — | 0.26 | — |
| + CYP2A6 phenotype or | 0.28 | 5 | 0.22 | 2 | 0.32 | 6 |
| + CYP2A6 diplotypes | 0.28 | 5 | 0.30 | 10 | 0.33 | 7 |
| Whites | ||||||
| Base model | 0.28 | — | 0.21 | — | 0.28 | — |
| + CYP2A6 phenotype or | 0.36 | 8 | 0.38 | 17 | 0.32 | 4 |
| + CYP2A6 diplotypes | 0.35 | 7 | 0.34 | 13 | 0.38 | 10 |
| LA | ||||||
| Base model | 0.30 | — | 0.32 | — | 0.28 | — |
| + CYP2A6 phenotype or | 0.35 | 5 | 0.36 | 4 | 0.35 | 7 |
| + CYP2A6 diplotypes | 0.37 | 7 | 0.44 | 12 | 0.37 | 9 |
| JA | ||||||
| Base model | 0.17 | — | 0.19 | — | 0.11 | — |
| + CYP2A6 phenotype or | 0.26 | 9 | 0.29 | 10 | 0.19 | 8 |
| + CYP2A6 diplotypes | 0.22 | 5 | 0.26 | 7 | 0.19 | 8 |
aBase model includes age, sex (if applicable), race/ethnicity (Blacks, Whites, NH, JA and LA—if applicable), BMI (natural log), CPD (natural log) and TNE.
bBase model includes age, sex (if applicable), race/ethnicity (Blacks, Whites, NH, JA and LA—if applicable), BMI (natural log) and CPD (natural log).
Discussion
In this study, we characterized the association of CYP2A6 activity (total 3-HCOT/cotinine) and CYP2A6 genotypes with ethnic/racial differences in smoking level and intensity. It is the first study to examine the variation in CYP2A6 activity and genetics among multiple ethnic racial groups. The five groups included have disparate rates of lung cancer, and we reported previously that TNE, a measure of nicotine uptake, varies significantly across these groups (24). In AA, Whites and JA, the measure of TNE correlates with their direction of disease risk (highest in AA and lowest in JA when compared with Whites) (2,7,24). Here, we report that lower mean CYP2A6 activity in JA explained their significantly lower mean TNE levels and that within this ethnic group CYP2A6 diplotypes predicted TNE levels. CYP2A6 diplotypes were also associated with TNE in AA and LA smokers. Although JA have the lowest TNE levels and AA the highest, a striking outcome of this study was that these two populations have the same level of TNE (even after adjustment for CPD) in the diplotype group that carry none of the reduced activity CYP2A6 alleles. These data confirm that CYP2A6 variants that influence CYP2A6 activity contribute to the ethnic/racial differences in smoking intensity.
CYP2A6 is a highly polymorphic gene with a number of SNPs and CNV, which contribute to significant interindividual and interethnic variations in protein expression and enzyme activity (32). Genetic polymorphisms resulting in no or reduced CYP2A6 activity alter nicotine metabolism and tobacco consumption (6,10–13). In Japanese, the CNV, CYP2A6*4, and the SNP, CYP2A6*7 (rs5031016) are associated with reduced nicotine metabolism and cigarette consumption (CPD) (8,12,18). In European Americans, seven CYP2A6 polymorphisms explained ~70% of the variability in the metabolism of orally administered nicotine to cotinine (21). Six of the CYP2A6 variants (*4, *9, *1A, *12, *2, *1H) in that model were included in our study, the seventh is a rare variant *38 [frequency = 0.05%; (30)]. Many of these variants are also present in AA, either at similar or slightly higher frequencies (30). In addition, there are a number of CYP2A6 variants unique to AA, although most are rare (30,33,34). A number of these rare variants as well as CYP2A6*17, which is relatively common in AA (allele frequency 11%) but essentially nonexistent in other groups, have reduced enzyme activity (33). There is little or no published information on the effect of CYP2A6 variants on nicotine metabolism in LA and NH.
In this study, we compared the urinary ratio of total 3-HCOT to cotinine, a measure of CYP2A6 activity across multiple racial/ethnic groups and evaluated the effect of this ratio on smoking intensity in these groups. We found that LA had a higher CYP2A6 activity ratio than Whites and AA, who had similar ratios. The CYP2A6 activity ratio for NH was lower than in Whites, and JA had the lowest ratio. The lower CYP2A6 activity in JA and NH is consistent with our earlier study of nicotine and caffeine metabolism in these populations (14). However, using the urinary ratio of 3-HCOT to cotinine as a measure of CYP2A6 activity, Kandel et al. (35) reported that activity in AA was lower than in Whites. It has also been reported that the plasma ratio of 3-HCOT to cotinine is lower in AA compared with Whites (35). We believe these reported differences in CYP2A6 activity between Whites and AA are in part due to the effect of decreased cotinine glucuronidation in AA on the 3-HCOT to cotinine ratio. Cotinine glucuronidation is catalyzed by UGT2B10 and a splice variant of UGT2B10 is common in AA (allele frequency 35%) (7). Therefore, UGT2B10 genotype should be considered when comparing nicotine metabolic pathways in AA. We reported previously that in this cohort of MEC smokers the total 3-HCOT to cotinine ratio used here was not significantly affected by the presence of the UGT2B10 splice variant (7). In concordance with the literature, we found that CYP2A6 activity influenced smoking behavior (11,14,28). When TNE levels in the different ethnic/racial groups were adjusted for the total 3-HCOT to cotinine ratio, there was no longer a significantly lower TNE level in JA or in NH compared with Whites, only the higher level of TNE in AA remained significant.
Previously, in a study that included JA, NH and Whites, we reported that for the combined groups excretion of urinary NNAL, a biomarker of tobacco carcinogen exposure increased with CYP2A6 activity. However, this association was not statistically significant for any of the individual groups (14). In the present study, lower NNAL levels, like TNE, were associated with both CYP2A6 activity and CYP2A6 diplotypes in JA. However, in NH, there was no statistically significant relationship between NNAL levels and CYP2A6 activity or diplotypes.
The MEC used in this study allowed us to investigate possible ethnic-specific effects of CYP2A6 diplotype on CYP2A6 activity. One variant allele that appeared to differentially impact CYP2A6 activity was CYP2A6*1A. This haplotype, defined by a synonymous SNP in exon 1, has been associated with decreased mRNA and protein levels in liver samples (22). In vivo, the CYP2A6*1A allele is significantly associated with slower nicotine metabolism in European American (21). There is little, if any, information on the effect of this allele on CYP2A6 activity or nicotine metabolism in non-Whites. In the current study, the CYP2A6*1A allele was associated with lower CYP2A6 activity in four of the ethnic/racial groups. However, in JA, this haplotype appeared to have no effect on CYP2A6 activity. JA who were heterozygous or homozygous for CYP2A6*1A did not differ in CYP2A6 activity levels compared with JA with the N/N diplotype. Bloom et al. reported in European Americans that the SNP defining CYP2A6*1A may disrupt an exon splicer suppressor motif and that when this SNP occurs with a nonsynonymous SNP (CYP2A6*14) only 35 base pairs away, the net effect is no change in CYP2A6 activity (21,36). The second SNP strengthens an adjacent exonic splicing enhancer site, compensating for the effect of the *1A SNP. An as-yet identified SNP (in high linkage disequilibrium with *1A) present in JA may influence the effect of *1A on splicing and result in the comparable CYP2A6 activity levels we found among JA with the *1A/N, *1A/*1A and N/N diplotypes.
Several studies have found an association between CYP2A6 variant alleles and lung cancer (13,17,37). Genetic polymorphisms in CYP2A6 may contribute to interindividual variation in risk of lung cancer among smokers by altering smoking intensity due to changes in nicotine metabolism and/or affecting the activation/detoxification pathway of the tobacco lung carcinogen, NNK. The data presented here on TNE of JA smokers and in a recent study on CYP2A6 and lung cancer in a Chinese cohort (38) support the hypothesis that the association of CYP2A6 variants with lung cancer risk is primarily the result of altered nicotine metabolism leading to increased smoking intensity and exposure to tobacco smoke carcinogens. In Japanese and Chinese populations, which have a relatively high frequency of CNV, the CYP2A6*4 variant is associated with decreased lung cancer risk (17). In European Americans, CYP2A6 variants in combination with SNPs in the nicotine receptor gene cluster on chromosome 15 (CHRNA5–CHRNA3–CHRNB4), also appear to contribute to lung cancer risk (13). In addition, a recent study reported an association of CYP2A6 variant alleles with lung cancer risk in AA (19). In that study, the authors suggest that CYP2A6 may have a limited effect on cigarette consumption, but a significant effect on nicotine uptake per cigarette (19). Consistent with this suggestion, we found that after adjustment for CPD CYP2A6 diplotypes was nominally associated with TNE levels in AA. However, adjustment for CYP2A6 activity did not significantly diminish the higher level of TNE in AA compared with Whites. Therefore, although CYP2A6 activity appears to modulate nicotine uptake or smoking intensity in AA, other genetic factors, such as variants in the nicotinic receptor subunits or social factors must contribute significantly to tobacco consumption in this ethnic/racial group.
This study had some limitations. One, ~5% of samples had unreliable genotyping data for the CYP2A6 deletion and therefore were recoded as missing data. If this data were systematically missing for a specific ethnic/racial group, this may slightly bias our findings. In addition, we selectively genotyped CYP2A6 variants by what was defined in the literature. We found that although the CYP2A6 phenotype and diplotypes provided comparable contribution with the variance of TNE, the slightly higher contribution of the phenotype in most populations suggests that additional variants need to be identified. Study strengths include the large multiethnic sample size and the potential to account for a number of confounders using high-quality self-reported epidemiologic data, which captured measures of smoking and other modifiable factors (e.g. estrogen use) at time of urine collection. In addition, the inclusion of multiple racial/groups with variable frequencies of CYP2A6 haplotypes allowed us to better define the relative contribution of these genetic variants to nicotine metabolism.
In this study, we provide strong evidence that in JA CYP2A6 activity is a critical driver of nicotine and carcinogen uptake and report that 46% of the variance in the CYP2A6 activity ratio can be explained by the diplotypes from 10 CYP2A6 variants. Therefore, the high prevalence of reduced or no activity CYP2A6 alleles in JA likely results in the lower risk of lung cancer in this group relative to Whites as a result of their lower level of carcinogen exposure. NH, like JA, have a lower CYP2A6 activity level and like JA, the TNE level of NH compared with Whites were no longer significantly different when adjusted for CYP2A6 activity. Yet, CYP2A6 diplotypes were not significantly associated with TNE in NH, possibly due to the smaller sample size for NH compared with JA. Alternatively, there may be as-yet unidentified unique CYP2A6 variants in NH. Nevertheless, in NH, a substantial amount (45%) of the variance in CYP2A6 activity was explained by the 10 CYP2A6 variants genotyped and the diplotypes and phenotypes contributed equally to TNE variance in this population. Regardless of the correct explanation for the observed lack of association between CYP2A6 diplotypes and TNE in NH, the TNE levels in NH are not consistent with the relatively high lung cancer risk in this group compared with JA. Factors beyond tobacco carcinogen exposure must be involved.
AA who carry reduced activity CYP2A6 diplotypes have lower TNE levels (Figure 3) and a decreased risk of lung cancer (19). However, mean TNE levels are higher and the risk of lung cancer is greater in AA for comparable CPD, consistent with greater smoking intensity in this group relative to the other four racial ethnic groups. In AA, like in JA, CYP2A6 activity may result in lower smoking intensity by some smokers, but smoking in the group as a whole must be influenced more strongly by other factors.
The data obtained in this study have improved our understanding of the relative importance of CYP2A6 variant alleles to nicotine metabolism and smoking intensity across ethnic racial groups. By clearly establishing the link between CYP2A6 variants in JA and TNE, a robust measure of nicotine dose, these data strongly support decreased nicotine uptake and therefore decreased carcinogen exposure as the major mechanism by which low or null activity CYP2A6 variants lead to the relatively low lung cancer risk in Japanese smokers (2,39). Further analyses and additional studies will be carried out to establish the relative contribution of CYP2A6 variant alleles to the disparate lung cancer risk across the five ethnic racial groups.
Supplementary material
Supplementary Tables 1–4 can be found at http://carcin.oxfordjournals.org/
Funding
NIH grant (CA138338 for this study); NIH (CA77598 for LC/MS/MS analysis of total NNAL, nicotine and metabolites carried out in the Analytical Biochemistry Core of the University of Minnesota Cancer Center); NIH grant (R37CA54281, R01CA63464, P01CA33619 and UM1CA164973 for the Multiethnic Cohort).
Conflict of Interest Statement: None declared.
Supplementary Material
Glossary
Abbreviations
- 3-HCOT
3-hydroxycotinine
- AA
African Americans
- BMI
body mass index
- CNV
copy number variants
- CPD
cigarettes per day
- JA
Japanese Americans
- LA
Latinos
- LOQ
limits of quantitation
- MEC
multiethnic cohort study
- NH
Native Hawaiians
- NNAL
4-(methylnitrosoamino)-1-(3-pyridyl)-1-butanol
- SNP
single-nucleotide polymorphism
- TNE
total nicotine equivalents
References
- 1. Torre L.A., et al. (2015) Global cancer statistics, 2012. CA Cancer J. Clin., 65, 87–108. [DOI] [PubMed] [Google Scholar]
- 2. Haiman C.A., et al. (2006) Ethnic and racial differences in the smoking-related risk of lung cancer. N. Engl. J. Med., 354, 333–342. [DOI] [PubMed] [Google Scholar]
- 3. Hukkanen J., et al. (2005) Metabolism and disposition kinetics of nicotine. Pharmacol. Rev., 57, 79–115. [DOI] [PubMed] [Google Scholar]
- 4. Scherer G., et al. (2007) Relationship between machine-derived smoke yields and biomarkers in cigarette smokers in Germany. Regul. Toxicol. Pharmacol., 47, 171–183. [DOI] [PubMed] [Google Scholar]
- 5. Wang J., et al. (2011) Is 24h nicotine equivalents a surrogate for smoke exposure based on its relationship with other biomarkers of exposure? Biomarkers, 16, 144–154. [DOI] [PubMed] [Google Scholar]
- 6. Benowitz N.L., et al. (2006) CYP2A6 genotype and the metabolism and disposition kinetics of nicotine. Clin. Pharmacol. Ther., 80, 457–467. [DOI] [PubMed] [Google Scholar]
- 7. Murphy S.E., et al. (2014) Nicotine N-glucuronidation relative to N-oxidation and C-oxidation and UGT2B10 genotype in five ethnic/racial groups. Carcinogenesis, 35, 2526–2533. [DOI] [PMC free article] [PubMed] [Google Scholar]
- 8. Zhang X., et al. (2002) Effects of whole deletion of CYP2A6 on nicotine metabolism in humans. Drug Chem. Toxicol., 25, 203–213. [DOI] [PubMed] [Google Scholar]
- 9. Nakajima M., et al. (2000) Deficient cotinine formation from nicotine is attributed to the whole deletion of the CYP2A6 gene in humans. Clin. Pharmacol. Ther., 67, 57–69. [DOI] [PubMed] [Google Scholar]
- 10. Mwenifumbo J.C., et al. (2007) Genetic variability in CYP2A6 and the pharmacokinetics of nicotine. Pharmacogenomics, 8, 1385–1402. [DOI] [PubMed] [Google Scholar]
- 11. Malaiyandi V., et al. (2006) Impact of CYP2A6 genotype on pretreatment smoking behaviour and nicotine levels from and usage of nicotine replacement therapy. Mol. Psychiatry, 11, 400–409. [DOI] [PubMed] [Google Scholar]
- 12. Minematsu N., et al. (2006) Limitation of cigarette consumption by CYP2A6*4, *7 and *9 polymorphisms. Eur. Respir. J., 27, 289–292. [DOI] [PubMed] [Google Scholar]
- 13. Wassenaar C.A., et al. (2011) Relationship between CYP2A6 and CHRNA5-CHRNA3-CHRNB4 variation and smoking behaviors and lung cancer risk. J. Natl. Cancer Inst., 103, 1342–1346. [DOI] [PMC free article] [PubMed] [Google Scholar]
- 14. Derby K.S., et al. (2008) Nicotine metabolism in three ethnic/racial groups with different risks of lung cancer. Cancer Epidemiol. Biomark. Prev., 17, 3526–3535. [DOI] [PMC free article] [PubMed] [Google Scholar]
- 15. Miyamoto M., et al. (1999) CYP2A6 gene deletion reduces susceptibility to lung cancer. Biochem. Biophys. Res. Commun., 261, 658–660. [DOI] [PubMed] [Google Scholar]
- 16. Ariyoshi N., et al. (2002) Genetic polymorphism of CYP2A6 gene and tobacco-induced lung cancer risk in male smokers. Cancer Epidemiol. Biomark. Prev., 11, 890–894. [PubMed] [Google Scholar]
- 17. Wang L., et al. (2013) Association of CYP2A6*4 with susceptibility of lung cancer: a meta-analysis. PLoS One, 8, e59556. [DOI] [PMC free article] [PubMed] [Google Scholar] [Retracted]
- 18. Kumasaka N., et al. (2012) Haplotypes with copy number and single nucleotide polymorphisms in CYP2A6 locus are associated with smoking quantity in a Japanese population. PLoS One, 7, e44507. [DOI] [PMC free article] [PubMed] [Google Scholar]
- 19. Wassenaar C.A., et al. (2015) CYP2A6 reduced activity gene variants confer reduction in lung cancer risk in African American smokers–findings from two independent populations. Carcinogenesis, 36, 99–103. [DOI] [PMC free article] [PubMed] [Google Scholar]
- 20. Xu C., et al. (2002) An in vivo pilot study characterizing the new CYP2A6*7, *8, and *10 alleles. Biochem. Biophys. Res. Commun., 290, 318–324. [DOI] [PubMed] [Google Scholar]
- 21. Bloom J., et al. (2011) The contribution of common CYP2A6 alleles to variation in nicotine metabolism among European-Americans. Pharmacogenet. Genomics, 21, 403–416. [DOI] [PMC free article] [PubMed] [Google Scholar]
- 22. Haberl M., et al. (2005) Three haplotypes associated with CYP2A6 phenotypes in Caucasians. Pharmacogenet. Genomics, 15, 609–624. [DOI] [PubMed] [Google Scholar]
- 23. Ho M.K., et al. (2008) A novel CYP2A6 allele, CYP2A6*23, impairs enzyme function in vitro and in vivo and decreases smoking in a population of Black-African descent. Pharmacogenet. Genomics, 18, 67–75. [DOI] [PMC free article] [PubMed] [Google Scholar]
- 24. Park S.L., et al. (2015) Variation in levels of the lung carcinogen NNAL and its glucuronides in the urine of cigarette smokers from five ethnic groups with differing risks for lung cancer. Cancer Epidemiol. Biomark. Prev., 24, 561–569. [DOI] [PMC free article] [PubMed] [Google Scholar]
- 25. Kolonel L.N., et al. (2000) A multiethnic cohort in Hawaii and Los Angeles: baseline characteristics. Am. J. Epidemiol., 151, 346–357. [DOI] [PMC free article] [PubMed] [Google Scholar]
- 26. Carmella S.G., et al. (2013) High throughput liquid and gas chromatography-tandem mass spectrometry assays for tobacco-specific nitrosamine and polycyclic aromatic hydrocarbon metabolites associated with lung cancer in smokers. Chem. Res. Toxicol., 26, 1209–1217. [DOI] [PMC free article] [PubMed] [Google Scholar]
- 27. Patel Y.M., et al. (2015) The contribution of common genetic variation to nicotine and cotinine glucuronidation in multiple ethnic/racial populations. Cancer Epidemiol. Biomark. Prev., 24, 119–127. [DOI] [PMC free article] [PubMed] [Google Scholar]
- 28. Strasser A.A., et al. (2011) Nicotine metabolite ratio predicts smoking topography and carcinogen biomarker level. Cancer Epidemiol. Biomark. Prev., 20, 234–238. [DOI] [PMC free article] [PubMed] [Google Scholar]
- 29. Stephens M., et al. (2001) A new statistical method for haplotype reconstruction from population data. Am. J. Hum. Genet., 68, 978–989. [DOI] [PMC free article] [PubMed] [Google Scholar]
- 30. Bloom A.J., et al. (2012) Use of a predictive model derived from in vivo endophenotype measurements to demonstrate associations with a complex locus, CYP2A6. Hum. Mol. Genet., 21, 3050–3062. [DOI] [PMC free article] [PubMed] [Google Scholar]
- 31. Mwenifumbo J.C., et al. (2005) Ethnic variation in CYP2A6*7, CYP2A6*8 and CYP2A6*10 as assessed with a novel haplotyping method. Pharmacogenet. Genomics, 15, 189–192. [DOI] [PubMed] [Google Scholar]
- 32. Raunio H., et al. (2012) CYP2A6: genetics, structure, regulation, and function. Drug Metabol. Drug Interact., 27, 73–88. [DOI] [PubMed] [Google Scholar]
- 33. Mwenifumbo J.C., et al. (2008) Novel and established CYP2A6 alleles impair in vivo nicotine metabolism in a population of Black African descent. Hum. Mutat., 29, 679–688. [DOI] [PubMed] [Google Scholar]
- 34. Piliguian M., et al. (2014) Novel CYP2A6 variants identified in African Americans are associated with slow nicotine metabolism in vitro and in vivo. Pharmacogenet. Genomics, 24, 118–128. [DOI] [PMC free article] [PubMed] [Google Scholar]
- 35. Kandel D.B., et al. (2007) Urine nicotine metabolites and smoking behavior in a multiracial/multiethnic national sample of young adults. Am. J. Epidemiol., 165, 901–910. [DOI] [PubMed] [Google Scholar]
- 36. Bloom A.J., et al. (2013) A compensatory effect upon splicing results in normal function of the CYP2A6*14 allele. Pharmacogenet. Genomics, 23, 107–116. [DOI] [PMC free article] [PubMed] [Google Scholar]
- 37. Liu T., et al. (2013) Association between CYP2A6 genetic polymorphisms and lung cancer: a meta-analysis of case-control studies. Environ. Mol. Mutagen., 54, 133–140. [DOI] [PubMed] [Google Scholar]
- 38. Yuan J.M., et al. (2015) Downregulation of cell cycle-related proteins in ovarian cancer line and cell cycle arrest induced by microRNA. Int. J. Clin. Exp. Med., 8, 18476–18481. [PMC free article] [PubMed] [Google Scholar]
- 39. Wakai K., et al. ; JACC Study Group (2005) Updated information on risk factors for lung cancer: findings from the JACC Study. J. Epidemiol., 15 (suppl. 20), S134–S139. [DOI] [PMC free article] [PubMed] [Google Scholar]
Associated Data
This section collects any data citations, data availability statements, or supplementary materials included in this article.