

Abstract
From a microscopic point of view, the frictional force associated with the relative sliding of rough surfaces originates from deformation of the material in contact, by adhesion in the contact interface or both. We know that plastic deformation at the size scale of micrometres is not only dependent on the size of the contact, but also on the rate of deformation. Moreover, depending on its physical origin, adhesion can also be size and rate dependent, albeit different from plasticity. We present a two-dimensional model that incorporates both discrete dislocation plasticity inside a face-centred cubic crystal and adhesion in the interface to understand the rate dependence of friction caused by micrometre-size asperities. The friction strength is the outcome of the competition between adhesion and discrete dislocation plasticity. As a function of contact size, the friction strength contains two plateaus: at small contact length , the onset of sliding is fully controlled by adhesion while for large contact length , the friction strength approaches the size-independent plastic shear yield strength. The transition regime at intermediate contact size is a result of partial de-cohesion and size-dependent dislocation plasticity, and is determined by dislocation properties, interfacial properties as well as by the loading rate.
Keywords: discrete dislocation plasticity, adhesion, friction strength, loading rate
1. Introduction
The inevitable roughness of practical surfaces leads to the real contact area being only a small portion of the apparent contact area. At a sufficiently fine resolution, one observes that some asperities form intimate contacts and distort plastically. Upon relative shearing of the two solids, some initially non-contacting asperities can get interlocked, but a large contribution to the friction force originates from further plastic deformation of the contacting asperities and/or the loss of adhesive contact. Based on the notion that asperities in contact dominate the frictional resistance, Bowden & Tabor [1] developed their concept of a ‘plastic junction’ that ‘fails’ at a critical force F=τfra, which is defined by the true contact area a and the friction strength τfr and depends on the two materials in contact. Following this paradigm, many researchers have focused on the prediction and measurement of the real contact area for different surface topologies and the friction strength at different length scales.
In an effort to establish the real contact area a to be used in the Bowden–Tabor Law, Greenwood & Williamson [2] idealized a rough surface as a collection of spherical asperities with heights that follow a Gaussian or exponential distribution. Their model showed how the contact deformation depends on the topography of the surface and established a criterion for distinguishing surfaces that touch elastically from those which interact plastically. However, the model does not take into account interactions among asperities. Bhushan [3] carried out real contact area measurements in polymeric magnetic media and demonstrated that after unloading a significant portion of the deformation was not recovered, which indicates that plastic deformation had happened in the contact process. By means of optical interferometry and tunnelling microscopy, Majumdar & Bhushan [4] showed that the magnetic disc surface is fractal in nature. Gao & Bower [5] have computed the real contact area between a rigid flat surface and a deformable rough surface with Weierstrass profile based on the response of a single asperity in two dimensions. Pei et al. [6] subsequently analysed the real contact between self-affine fractal surfaces through a three-dimensional model. Both models took asperity interactions and fractality into account, but employed macroscopic plasticity models, even though it has become increasingly clear in the last two decades that plasticity is size dependent at size scales below tens of micrometres. The effect of size-dependent plasticity on the development of the contact has recently been analysed by Sun et al. [7] in terms of the plastic flattening of a sinusoidal metal surface through discrete dislocation (DD) dynamics. Consistent with the general trend in size-dependent plasticity, it was found that small asperities are more difficult to deform plastically than larger ones.
There are several techniques these days to measure the friction strength τfr of asperity contact pairs, the sizes of which are micrometres or smaller. Homola et al. [8] used a surface force apparatus (SFA) to obtain a friction strength τfr of around 20 MPa between two mica surfaces with the contact area 5×10⁹ and 2×10¹¹ nm2. By means of an atomic force microscope (AFM), Carpick et al. [9,10] observed a value of around 900 MPa for the friction strength between a flat mica surface and a platinum AFM tip where the contact area is 30–60 nm2. This suggests a size effect of the friction strength, with a smaller contact area having a higher friction strength, even though the two experiments did not have exactly the same materials in contact.
To date, there have been a few studies on the size effect of the friction strength. Through a micro-mechanical dislocation model of frictional slip between two asperities, Hurtado & Kim [11,12] argued that there are three regimes in the size dependence of the friction strength τfr. The strength τfr is equal to the theoretical shear strength of the solid for very small contacts while it equals the Peierls stress for relatively large contacts. The transition regime is controlled by emission of a dislocation loop at the edge of the contact, and thus is governed by a scaling law similar to the Rice–Thompson model [13]. As experimental results of Homola et al. [8] and Carpick et al. [9,10] are fitted well by the JKR theory of adhesive contact [14], Deshpande et al. [15] took into account both plastic deformation and adhesion in a DD calculation of a contact pair, and confirmed the existence of three regimes in τfr versus contact area: τfr is equal to the interfacial adhesion strength for very small contacts while it equals a strength that is controlled by size-independent dislocation plasticity for relatively large contacts. The transition regime is controlled by size-dependent dislocation plasticity, giving rise to a τfr∝a−1/2 scaling.
It is well established that dislocation plasticity is inherently strain rate dependent. Given the role of plasticity in contacting asperities, as discussed above, one would expect that friction is also dependent on the rate of loading, even in static friction. In fact, there is experimental evidence that static friction in rocks depends on the loading rate [16], despite the absence of plasticity in these materials. Scieszka & Jankowski [17] found that for brake friction couples (composite of rubber, steel, glass etc.), static friction increases with increasing loading rate. Based on experimental observations of non-crystalline materials, supplemented with physical arguments, Bar-Sinai et al. [18] proposed an ‘up-down-up-down’ schematic picture of the friction law, which includes strengthening regimes at extremely low velocity (governed by plastic creep) and high velocity (controlled by thermal activation).
To the best of our knowledge, however, there have been no efforts to explain the loading rate-dependent friction in crystalline materials. Here we report a computational study of the rate dependence of the friction strength τfr between a planar metallic single crystal and a flat-bottomed indenter. A non-softening cohesive law is used to model adhesion between the indenter and the substrate, which we endow with the rate strengthening behaviour of [18] at high velocity, while DD dynamics is used to describe plasticity in the substrate.
2. Formulation
The geometry of the model problem is the same as in [15], and is shown in figure 1a. The initiation of sliding between a flat indenter and a planar single crystal substrate is carried out under plane strain conditions normal to the plane of consideration. There is no normal force on the rigid indenter, as the normal force does not influence the predicted friction stress [19]. Loading is imposed in the form of a monotonically increasing, remote displacement in the x1 direction
at the two lateral and bottom sides of the substrate while the rigid indenter is kept at a fixed position. Thus, the displacement rate signifies ‘loading rate’ in this study. The mean contact shear stress τ is given by
where F is the reaction force transmitted by the cohesive zone across the contact surface Scoh, as indicated in figure 1a. The relative shearing can be accommodated by contact interfacial failure and by plastic deformation of the substrate which is described by the collective motion of DDs.
Figure 1.

(a) Sketch of the boundary-value problem under consideration and (b) non-softening cohesive relation.
As particular kind of interfacial property, adhesion can be described with continuum cohesive formulations [20,21]. Xu & Needleman [22] used a ‘softening’ cohesive relation to simulate inclusion debonding in a crystal matrix. In frictional sliding, there will always be new contact that forms when the current interface detaches. Therefore, in this paper, we use the ‘non-softening’ cohesive relation, sketched in figure 1b, as described by
| 2.1 |
Here, Δt=u1(x1,0) is the tangential displacement jump across the cohesive surface, Tt is the shear traction with the maximum value being τmax when |Δt|=δt.
In view of the target contact sizes, inelastic deformation is described by means of dislocation plasticity in the crystal substrate. The boundary-value problem under consideration is solved using the superposition framework of Van der Giessen & Needleman [23] in rate form. Each edge dislocation is treated as a singularity in half-infinite space [24], with the traction free surface at x2=0. A smooth image field is needed to correct for the boundary conditions along the contact governed by equation (2.1). Hence, the displacement rates , strain rates and stress rates are written as
where () denotes differentiation with respect to time and the () field is the sum of the fields of all N dislocations in their current positions, i.e.
The image fields are obtained by solving a linear elastic boundary-value problem using finite elements with the boundary conditions changing as the dislocation structure and the external load evolve; details can be found in [15].
In this two-dimensional model, the face-centred cubic (FCC) crystal structure is represented by three slip systems [25], whose slip planes are oriented at θ=0° and ±60° (θ defined in figure 1a). This is a fair approximation of the orientation of the effective slip systems in FCC and body-centred cubic crystals to ensure plane strain deformation [25]. In effect, the model aims at FCC crystals trough well-established constitutive rules for the generation and glide of dislocations (climb and cross-slip are ignored). Glide is governed by the component of the Peach–Koehler force in the slip direction. For the Ith dislocation, this force is given by
where is the slip plane normal and is the Burgers vector of dislocation I. This force will cause the dislocation I to glide with velocity
where B is the drag coefficient. We use B=10−4 Pa s and , both of which are representative for aluminium.
New dislocation pairs are generated by simulating the Frank–Read mechanism. In two dimensions, point sources will generate a dislocation dipole when the magnitude of the Peach–Koehler force at the source site exceeds a critical value τnucb for a period of time tnuc [23]. The initial distance between the two dislocations in the dipole is
such that the long-range attractive stress between the two dislocations is balanced by the local shear stress.
Annihilation of two dislocations with opposite Burgers vector happens when they are within an annihilation distance of 6b. Obstacles are included to account for the effect of blocked slip caused by precipitates and by forest dislocations on out-of-plane slip systems that are not explicitly described. Dislocations get pinned when they arrive at the obstacle site. Pinned dislocations are released from the obstacles when their Peach–Koehler force exceeds an obstacle dependent value τobsb.
At the beginning of every time increment of the simulation, nucleation, annihilation, pinning and release at obstacle sites are evaluated, and the dislocation structure is updated. The crystal is taken to have properties that are reminiscent of aluminium with Young's modulus E=70 GPa and Poisson's ratio ν=0.33. The width L and height h of the crystal are 1000 μm and 50 μm, respectively, both much larger than the contact sizes to be studied.
Slip planes are spaced at 100b, where b is the Burgers vector magnitude of 0.25 nm. Sources and obstacles are randomly distributed over the slip planes with densities 72 μm−2 and 124 μm−2, respectively. The strength of the sources to generate edge dislocations is selected randomly from a Gaussian distribution with mean value and 20% (i.e. 10 MPa) standard deviation. The time span needed for nucleation of a dislocation dipole, tnuc, is taken to be 10 ns, which is 20× the time increment Δt used. The strength of the obstacles τobs is taken to be 150 MPa. The crystal is stress free and dislocation free at the beginning of the simulation. Just like in [15] and in order to minimize the calculation cost for the responses we are interested in, plastic activity is limited to a plastic window of Lp=30 μm wide and hp=10 μm high, centred around the contact. Sources and obstacles are only distributed inside this window. Dislocations can exit the crystal substrate along the surface x2=0, including along the contact area, and if dislocations reach other boundaries of the plastic window, the simulation is stopped.
(a). Rate-dependent plasticity in tension
For reference, we first present the rate dependence of plasticity described in the model with the material parameters mentioned above. Tensile calculations were carried out on a tensile bar of length 2L=16 μm and width W=4 μm with the crystal oriented as shown in figure 2a. At a strain rate of , the flow strength σY, identified by the mean flat part of the stress–strain curve, is around 50 MPa (figure 2b). Higher strain rates lead to a higher flow strength (figure 3) which is consistent with a recent experimental study on single crystalline copper pillars [26].
Figure 2.

(a) Sketch of the boundary-value problem analysed to obtain the tensile stress versus strain response of the single crystal and (b) predicted stress–strain curve at strain rate of 102 s−1.
Figure 3.

Strain rate sensitivity of the yield strength σY in simple tension.
3. Rate-dependent friction at fixed adhesion strength
In this section, we study the shearing rate effect on the friction strength when the cohesive properties are still independent of the slip velocity, namely τmax=300 MPa and δt=0.5 nm. For reference, we first present results for a relatively high normalized loading rate , just like in [15]. Five realizations of random source positions and strengths are analysed for each contact size a, and the overall response is averaged. The mean contact shear stress, shown in figure 4a, increases linearly at the beginning. For larger contact sizes (greater than 10 μm), due to plasticity, the shear stress gradually reaches a plateau where sliding happens. For smaller contact areas (a<1 μm), there is no or insufficient plasticity to relax the stress prior to achieving the cohesive strength where sliding happens.
Figure 4.

(a) Mean contact shear stress versus displacement response for selected values of the contact size a and (b) friction strength (defined as the value of τ at U=0.05 μm) as a function of the contact size for .
Following [15], we use the value of U at which the curve of the largest contact is relatively flat to identify the onset of sliding, i.e. U=0.05 μm in figure 4a, and refer to the corresponding shear stress τ as the friction strength τfr. This is not a unique definition, but it is shown in appendix A that a definition of friction strength similar to that of yield strength gives results that differ by less than 4%. As seen in figure 4b, the friction strength as a function of contact size has two plateaus, and a transition regime in which τfr is approximately proportional to a−1/2. For small contact sizes (the upper plateau), the friction strength is equal to the cohesive strength, i.e. the onset of sliding is completely caused by interfacial slip (decohesion), while for large contact sizes (the lower plateau), the overall sliding is caused by plastic shearing deformation. In the latter regime, the friction strength is controlled by the size-independent plastic shearing of the crystalline substrate. The transition regime, which starts at a contact length of about 0.5 μm, is the result of the competition between interfacial slip and plastic deformation. Further inspection of the results reveals that for contact sizes in the transition regime, there is partial slip along the contact, as shown in figure 5 for contact size a=1 μm. The fact that the horizontal displacement along part of the contact is larger than the cohesive critical displacement δt=0.5 nm indicates that slip near the edges of the contact coexists with plastic deformation inside the crystal.
Figure 5.

Distribution of horizontal displacement u1 and dislocation distribution for contact size a=1 μm at U=0.05 μm. (Online version in colour.)
The result of the competition is influenced by dislocation properties, such as source and obstacle density, and cohesive strength (figure 6). We observe that when the dislocation source density is higher, there is more plastic deformation (figure 6a), hence more stress relaxation and less interfacial slip (figure 6b). For instance, the response for a=0.4 μm is not adhesion controlled anymore when the source density is increased from 72 to 155 μm2. On the other hand, a higher cohesive strength makes slip more difficult (figure 6b), but does not significantly influence the friction strength in the transition regime (figure 6a).
Figure 6.

Effect of source density and cohesive strength effect on (a) friction strength and (b) decohesion fraction which is defined by the ratio of the number of Gaussian integration points that have reached the cohesive strength τmax (i.e. |Δt|>δt) over the total number of integration points along the cohesive surface.
As DD plasticity is strain rate dependent, as shown in the previous subsection, we expect the friction strength to vary with loading rate. In keeping with [15], we first explore cases where the normalized loading rate is kept constant for different a. The variation of τfr with varying over three decades is plotted in figure 7a. Over the entire range of , the size dependence of the friction strength still has two plateaus, but the plasticity controlled lower plateau rises with increasing strain rate. As a consequence, the extent of the cohesion-controlled regime is affected. The underlying reason is that at high loading rates there may not be enough time to nucleate sufficiently many dislocations to relax the strength before it reaches the cohesive strength. As plastic deformation at higher loading rate is more difficult (i.e. requires higher stress), interfacial slip (decohesion) becomes relatively easier, as shown in figure 7b. The slope of the friction strength in the transition regime in figure 7a decreases with increasing normalized loading rate, approximately from −0.35 at a normalized loading rate of 105 s−1 to −0.66 for . The dependence of the slope on the magnitude of can be described as .
Figure 7.

Effect of loading rate on (a) friction strength and (b) decohesion fraction.
The sensitivity of the friction strength of a large contact to loading rate reflects the rate sensitivity of dislocation plasticity. Using as a measure of strain rate, we compare, in figures 3 and 8, the rate dependence of the friction strength, e.g. a=10 μm, with that of the yield strength in tension. As different definitions of ‘strain rate’ and stress are adopted, it is not surprising that the curves do not overlap, but one can make them do so by adopting normalization by an appropriate constant. This implies that the response of the two models is governed by the same rate sensitivity parameter, i.e. they describe the rate effect of the same material.
Figure 8.
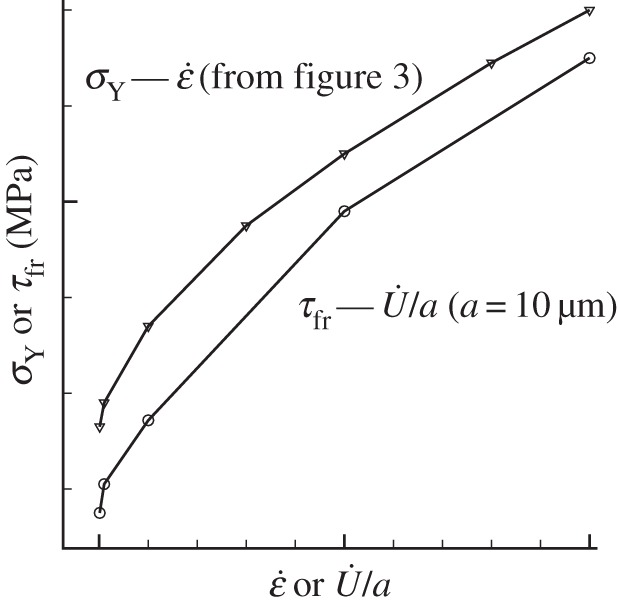
Comparison between the effect of loading rate in simple tension and contact shearing.
While the use of as loading rate is convenient from a theoretical point of view, the displacement rate is a primary quantity that is directly controllable in experiment. If we plot the friction strength for different contact areas at the same rather than the same , we observe in figure 9a that the transition regimes have a very similar shape with a slope of approximately −0.63.
Figure 9.

Variation of (a) friction strength and (b) decohesion fraction with contact area for selected loading rates.
4. Slip velocity-dependent adhesion strength
In the previous section, we have found that strain rate dependence of dislocation plasticity implies that the size-dependent friction strength τfr depends on loading rate (figure 7). In this section, we explore the implications when the adhesion strength is not constant but depends on the velocity jump (slip rate) across the contact. We assume the following slip rate strengthening relation for the interfacial strength:
| 4.1 |
where τ0 is a reference cohesive strength which is taken to be 300 MPa here. K is the cohesive stiffness =τ0/δt and is the reference slip rate which is taken to be 104 μm s−1 (this choice ensures a sufficiently large variation of the maximum cohesive strength for the range of loading rates used in the previous section). The value of the exponent n is taken to be 0.2, as motivated in appendix B. The maximum cohesive strength, when vanishes, is
| 4.2 |
As in the previous section, we first calculate the friction strength for different contact areas a for a given (figure 10a). In this case, at the same normalized loading rate , a smaller a corresponds to a smaller loading rate , which yields a lower slip rate, hence a lower friction strength, so that the adhesion controlled regime is not a plateau anymore. If, however, the friction is plotted at the same loading rate instead of (figure 10b), the upper plateau is still present, but higher loading rate leads to a higher strength. In this figure, we used the exponent n=0.2 in equation (4.1); when n=0 adhesion is slip rate independent (cf. figure 9a). Owing to the different contribution from adhesion, the slope of transition regime changes from −0.63 for n=0 to −0.75 for n=0.2.
Figure 10.

(a) Friction strength as a function of contact size at different normalized loading rates and (b) friction strength versus contact size for selected values of the loading velocities. Results are shown for the slip rate-dependent adhesion relation (4.1) with n=0.2.
For a linear dependence on slip rate, n=1, the adhesion controlled plateau in the τfr(a) curves disappears (figure 11). The reason is that a linear dependence can yield such high cohesive strength that it is very difficult to reach the cohesive maximum strength. Hence, for sufficiently fast loading rates, the adhesion-controlled plateau disappears and a scaling regime τfr∝a−0.9 extends up to contact sizes as large as 10 μm.
Figure 11.

Friction strength as a function of the contact size at different loading rates with n=1 in the cohesive law (4.1).
5. Discussion
The baseline finding in this study is that, at any given loading rate, there is a characteristic dependence of the friction strength on the contact size a, similar to that in [15]. For small contact area a, dislocation plasticity does not play a role as the nucleation of dislocations is source limited; hence the onset of sliding is controlled by adhesion. For sufficiently large contact area (a≥10 μm for the parameters in this paper), the friction strength approaches another plateau which is determined by size-independent plasticity. The transition regime emerges from the competition between the two. Because of size-dependent plasticity (larger contact length leads to a lower strength), plastic deformation is easier with increasing contact size and, therefore, contributes more to the onset of the sliding, i.e. less interfacial slip (decohesion) (figures 6b, 7b). Thus, the transition regime is essentially the re-distribution of the relative contributions of interfacial slip (decohesion) and plasticity to the onset of the sliding according to the (size dependent) strengths of the two.
Knowing the fraction of de-adhered contact, ζ, and the size-independent plastic strength τpl (the friction strength of large a), we can estimate the friction strength in the transition regime by a simple rule of mixtures: , where ζ is the decohesion fraction. Figure 12 shows the comparison (for the n=0 case) between the estimated and the calculated friction strength under different loading velocities. The small difference is caused by the fact that τpl may not be an accurate estimate of the plastic strength of the still adhering section (1−ζ)a for the following reasons: (i) the shear stress distribution is not uniform along the adhering fraction of the contact; (ii) the actual plastic strength is size dependent and, therefore, larger than τpl because (1−ζ)a<a. Despite these small numerical differences, we conclude that the transition regime is indeed intimately tied to partial decohesion.
Figure 12.

Comparison between the simulated friction strength (open symbols) and a rule-of-mixtures estimate using the fraction ζ of slipped contact (small solid symbols), based on the cohesive strength and the size-independent shear yield strength.
6. Conclusion
We have carried out a DD plasticity analysis of the initiation of sliding between a rigid flat bottomed indenter and a planar single crystal substrate under different loading rates. Plastic flow in the substrate arises from the collective motion of dislocations that nucleate from Frank–Read sources that are distributed randomly in the crystal. Adhesion in the contact interface is simulated by a cohesive zone whose strength may depend on the slip rate. The salient conclusion of the study are:
- — the friction strength as a function of the contact area a has three regimes:
For small contact areas, where dislocation plasticity is source limited, the friction strength is equal to the adhesion strength while for large contact area, the friction strength is determined by the size-independent yield strength. The transition regime emerges from the competition between adhesion and dislocation plasticity, and can be characterized by the fraction of the contact area that has de-adhered. — When different sizes of contact are loaded under the same normalized loading rate , the exponent s in the scaling τfr∝as of the friction strength in the transition regime depends on the magnitude of roughly following . When they are loaded under the same unnormalized loading rate , for a given interfacial property, e.g. n=0, the slope in the transition regime is roughly the same, while the slope changes from −0.63 for n=0 (slip rate-independent adhesion) to −0.9 for n=1 (slip rate linear dependent adhesion).
— As dislocation plasticity is strain rate dependent, the friction strength τfr in the transition regime as well as in the lower plateau increases with increasing loading rate , thus the friction force F=τfra increases with increasing loading rate. For small contact areas, the friction strength is adhesion controlled, hence the friction force F=τfra also increases with increasing loading rate when adhesion is slip rate strengthening.
It bears emphasis that this paper is concerned with the loading rate dependence of the static friction strength. This is different from the dependence observed in kinetic friction experiments, where friction also increases with loading rate, but until a critical rate after which it decreases (e.g. [27]). The decrease is generally attributed to thermal weakening. We do not expect thermal weakening to be relevant for static friction, where the relative sliding distances are too small to have dissipated enough energy.
Appendix A. Definition of friction strength by analogy to yield strength
Rather than defining the friction strength at a fixed value of the sliding displacement U, as done in the main text of the paper, we could also have defined it by analogy to the definition of yield strength from a stress–strain curve as the stress at 0.2% plastic strain. That is, we define τfr at certain plastic displacement Upl=U−τ/G, where G is the contact size-dependent elastic stiffness. The latter can be deduced from the τ–U curve for each a, while the critical Upl is to be chosen (just like the 0.2% plastic strain in the definition of yield strength is a more or less arbitrary choice).
In figure 13, we choose the friction strength of 73 MPa for a 4 μm contact (at U=0.05 μm) as the reference and compute the corresponding Upl to be 0.035 μm. Using this value, the friction strength for other contact sizes are then determined by the construction indicated with the dashed lines. We see that the difference of these strengths differ very little from the strengths measured at U=0.05 μm. As the latter definition is easier to apply, this is the one adopted throughout the paper.
Figure 13.

Comparison of τfr estimates based on U=0.05 μm and on Upl=0.035 μm.
Appendix B. Motivation of the power law velocity-strengthening model
Here we motivate the power law velocity-strengthening model, , see equation (4.2). The velocity dependence at relatively low sliding velocity comes from a stress-biased thermally activated process [18] which typically yields logarithmic velocity strengthening, i.e. , where c and b are constants related to energy barrier, activation volume and temperature. This logarithmic relationship has been observed in many experiments, but the slip velocity is typically not larger than a few hundreds of μm s−1 [18].
There is quite a bit of data [18] indicating that the dependence on the sliding velocity is stronger than logarithmic at higher sliding velocities. For instance, in clay-rich gouge, when the sliding velocity is larger than 104 μm s−1, strengthening is stronger than logarithmic until the velocity is larger than 105 μm s−1 when thermal weakening effects appear (not discussed in this paper). A schematic picture is shown in figure 14. Owing to the lack of the experimental data for crystalline materials being studied in this paper, we assume that adhesion has a power law strengthening with exponent 0.2 to represent both strengthening regimes.
Figure 14.

The power law dependence of adhesion assumed in this paper approximates the two velocity-strengthening regimes observed in the experiments on non-crystalline materials.
Data accessibility
The raw data for figures 4–12 are available in the electronic supplementary material ‘friction-rate-data-package.zip’.
Authors' contributions
H.S. and E.V.d.G. designed the study and contributed to the analysis of the results. H.S. and V.S.D. implemented the computational program. H.S. carried out the numerical simulations and drafted the manuscript with VS.D. and E.V.d.G. All authors gave final approval for publication.
Competing interests
We declare we have no competing interests.
Funding
This work was supported by Foundation for Fundamental Research on Matter (FOM), which is part of the Netherlands Organisation for Scientific Research (NWO), grant no. 13POF07-1.
References
- 1.Bowden FP, Tabor D. 1950. The friction and lubrication of solids, part I, ch. 5. Oxford, UK: Clarendon Press. [Google Scholar]
- 2.Greenwood JA, Williamson JBP. 1966. Contact of nominally flat surfaces. Proc. R. Soc. Lond. A 295, 300–319. (doi:10.1016/0043-1648(67)90287-6) [Google Scholar]
- 3.Bhushan B. 1985. The real area of contact in polymeric magnetic media-II: experimental data and analysis. ASLE Trans. 28, 181–197. (doi:10.1080/05698198508981610) [Google Scholar]
- 4.Majumdar A, Bhushan B. 1991. Fractal model of elastic-plastic contact between rough surfaces. ASME J. Tribol. 113, 1–11. (doi:10.1115/1.2920588) [Google Scholar]
- 5.Gao YF, Bower AF. 2006. Elastic-plastic contact of a rough surface with Weierstrass profile. Proc. R. Soc. A 462, 319–348. (doi:10.1098/rspa.2005.1563) [Google Scholar]
- 6.Pei L, Hyun S, Molinari JF, Robbins MO. 2005. Finite element modelling of elasto-plastic contact between rough surfaces. J. Mech. Phys. Solids 53, 2385–2409. (doi:10.1016/j.jmps.2005.06.008) [Google Scholar]
- 7.Sun F, van der Giessen E, Nicola L. 2012. Plastic flattening of a sinusoidal metal surface: a discrete dislocation plasticity study. Wear 296, 672–680. (doi:10.1016/j.wear.2012.08.007) [Google Scholar]
- 8.Homola AM, Israelachvili JN, McGuiggan PM, Gee ML. 1990. Fundamental experimental studies in tribology: the transition from ‘interfacial’ friction of undamaged molecularly smooth surfaces to ‘normal’ friction with wear. Wear 136, 65–83. (doi:10.1016/0043-1648(90)90072-i) [Google Scholar]
- 9.Carpick RW, Agrait N, Ogletree DF, Salmeron M. 1996. Measurement of interfacial shear (friction) with an ultra-high vacuum atomic force microscope. J. Vac. Sci. Technol. B 14, 1289 (doi:10.1116/1.589083) [Google Scholar]
- 10.Carpick RW, Agrait N, Ogletree DF, Salmeron M. 1996. Variation of the interfacial shear strength and adhesion of a nanometer-sized contact. Langmuir 12, 3334–3340. (doi:10.1021/la9509007) [Google Scholar]
- 11.Hurtado JA, Kim KS. 1999. Scale effects in friction of single-asperity contacts–I: from concurrent slip to single-dislocation-assisted slip. Proc. R. Soc. Lond. A 455, 3363–3384. (doi:10.1098/rspa.1999.0455) [Google Scholar]
- 12.Hurtado JA, Kim KS. 1999. Scale effects in friction of single-asperity contacts–II: multiple-dislocation-cooperated slip. Proc. R. Soc. Lond. A 455, 3385–3400. (doi:10.1098/rspa.1999.0456) [Google Scholar]
- 13.Rice JR, Thompson R. 1973. Ductile versus brittle behavior of crystals. Philos. Mag. 29, 73 (doi:10.2172/4403224) [Google Scholar]
- 14.Johnson KL, Kendall K, Roberts AD. 1971. Surface energy and the contact of elastic solids. Proc. R. Soc. Lond. A 324, 301–313. (doi:10.1098/rspa.1971.0141) [Google Scholar]
- 15.Deshpande VS, Needleman A, Van der Giessen E. 2004. Discrete dislocation plasticity analysis of static friction. Acta Mater. 52, 3135–3149. (doi:10.1016/j.actamat.2004.03.018) [DOI] [PMC free article] [PubMed] [Google Scholar]
- 16.Marone C. 1998. The effect of loading rate on static friction and the rate of fault healing during the earthquake cycle. Nature 391, 69–72. (doi:10.1038/34157) [Google Scholar]
- 17.Scieszka SF, Jankowski A. 1996. The importance of static friction characteristics of brake friction couple, and methods of testing. Tribotest J. 3–2, 137–148. (doi:10.1002/tt.3020030203) [Google Scholar]
- 18.Bar-Sinai Y, Spatschek R, Brener EA, Bouchbinder E. 2014. On the velocity-strengthening behavior of dry friction. J. Geophys. Res. Solid Earth 119, 1738–1748. (doi:10.1002/2013jb010586) [Google Scholar]
- 19.Deshpande VS, Balint DS, Needleman A, Van der Giessen E. 2006. Size effects in single asperity frictional contacts. Model. Simul. Mat. Sci. Eng. 15, S97–S108. (doi:10.1088/0965-0393/15/1/s09) [Google Scholar]
- 20.Johnson KL. 1997. Adhesion and friction between a smooth elastic spherical asperity and a plane surface. Proc. R. Soc. Lond. A 453, 163–179. (doi:10.1098/rspa.1997.0010) [Google Scholar]
- 21.Kim KS, McMeeking RM, Johnson KL. 1998. Adhesion, slip, cohesive zones and energy fluxes for elastic spheres in contact. J. Mech. Phys. Solids 46, 243–266. (doi:10.1016/s0022-5096(97)00070-7) [Google Scholar]
- 22.Xu X-P, Needleman A. 1993. Void nucleation by inclusion debonding in a crystal matrix. Model. Simul. Mater. Sci. Eng. 1, 111 (doi:10.1088/0965-0393/1/2/001) [Google Scholar]
- 23.Van der Giessen E, Needleman A. 1995. Discrete dislocation plasticity: a simple planar model. Model. Simul. Mat. Sci. Eng. 3, 689–735. (doi:10.1088/0965-0393/3/5/008) [Google Scholar]
- 24.Freund LB. 1994. The mechanics of dislocations in strain-layer semiconductor materials. Adv. Appl. Mech. 30, 1–66. (doi:10.1016/s0065-2156(08)70173-x) [Google Scholar]
- 25.Rice JR. 1987. Tensile crack tip fields in elastic-ideally plastic crystals. Mech. Mater. 6, 317–335. (doi:10.1016/0167-6636(87)90030-5) [Google Scholar]
- 26.Jennings AT, Li J, Greer JR. 2011. Emergence of strain-rate sensitivity in Cu nanopillars: transition from dislocation multiplication to dislocation nucleation. Acta Mater. 59, 5627–5637. (doi:10.1016/j.actamat.2011.05.038) [Google Scholar]
- 27.Philippon S, Sutter G, Molinari A. 2004. An experimental study of friction at high sliding velocities. Wear 257, 774–784. (doi:10.1016/j.wear.2004.03.017) [Google Scholar]
Associated Data
This section collects any data citations, data availability statements, or supplementary materials included in this article.
Data Availability Statement
The raw data for figures 4–12 are available in the electronic supplementary material ‘friction-rate-data-package.zip’.