

Summary
Bacterial macrocolony biofilms grow into intricate three‐dimensional structures that depend on self‐produced extracellular polymers conferring protection, cohesion and elasticity to the biofilm. In E scherichia coli, synthesis of this matrix – consisting of amyloid curli fibres and cellulose – requires CsgD, a transcription factor regulated by the stationary phase sigma factor RpoS, and occurs in the nutrient‐deprived cells of the upper layer of macrocolonies. Is this asymmetric matrix distribution functionally important or is it just a fortuitous by‐product of an unavoidable nutrient gradient? In order to address this question, the RpoS‐dependent csgD promoter was replaced by a vegetative promoter. This re‐wiring of csgD led to CsgD and matrix production in both strata of macrocolonies, with the lower layer transforming into a rigid ‘base plate’ of growing yet curli‐connected cells. As a result, the two strata broke apart followed by desiccation and exfoliation of the top layer. By contrast, matrix‐free cells at the bottom of wild‐type macrocolonies maintain colony contact with the humid agar support by flexibly filling the space that opens up under buckling areas of the macrocolony. Precisely regulated stratification in matrix‐free and matrix‐producing cell layers is thus essential for the physical integrity and architecture of E . coli macrocolony biofilms.
Introduction
Bacterial biofilms are multicellular aggregates of cells surrounded by a self‐produced matrix that provides cohesion and protection. Matrix components can include cell appendages such as adhesive pili and flagella, amyloid fibres, secreted proteins, exopolysaccharides (EPSs) and extracellular DNA (eDNA) (Flemming and Wingender, 2010). Although often depicted as rather unstructured heaps of matrix‐surrounded cells, biofilms in fact show an intricate and highly regulated supracellular architecture (Parsek and Tolker‐Nielsen, 2008; Serra and Hengge, 2014). Macrocolony biofilms that grow on agar‐solidified complex media for several days – thus mimicking biofilms on decaying organic materials in nature – even fold and buckle up to produce an intricate macroscopic morphology with intertwined wrinkles, elongated folds and ridges and/or concentric ring patterns (Serra et al., 2013a, 2013b; Okegbe et al., 2014).
This structural organization of macrocolony biofilms depends on the ability to produce an extracellular matrix (Römling, 2005; Romero et al., 2010; Serra and Hengge, 2014). Moreover, it is intimately associated with physiological stratification within biofilms, where zones of actively growing cells and highly stress‐resistant stationary phase cells are generated along gradients of nutrients and oxygen, which emerge as a function of consumption and diffusion (Rani et al., 2007; Lenz et al., 2008; Stewart and Franklin, 2008; Williamson et al., 2012; Serra et al., 2013a, 2013b). Whether zones of active growth are found in the top or bottom layers of macrocolonies, exquisitely depends on the specific metabolism of a given species, in particular whether oxygen (in the absence of other respiratory electron acceptors) is absolutely required for growth or not (see discussion in Serra and Hengge, 2014).
As an enteric bacterium, Escherichia coli can grow by fermentation when oxygen becomes limiting, which makes the nutrient supply the major determinant for entry into stationary phase. Therefore, the top layer of E. coli macrocolonies, which is most remote from the nutrient‐providing agar support, features small stationary phase cells that are tightly embedded in an extracellular matrix network, whereas the bottom layer contains elongated and dividing cells that produce flagella (Serra et al., 2013b). The matrix in the top layer consists of amyloid curli fibres and cellulose that together form a composite material that confers tissue‐like properties, i.e. strong cohesiveness and elasticity, which is a prerequisite for the very flat and large macrocolonies to buckle up into a pattern of ridges and wrinkles (Serra et al., 2013a). A similar stratification of matrix production has also been observed for a uropathogenic E. coli grown in pellicles on static liquid (Hung et al., 2013). Notably, the classical laboratory E. coli K‐12 strains are cellulose‐negative (due to a nonsense mutation in bcsQ in the cellulose biosynthesis operon) and therefore produce a curli‐only matrix in the top layer, which is brittle and during growth of the much thicker macrocolonies breaks into a pattern of concentric rings. However, a ‘de‐domesticated’ derivative of the E. coli K‐12 strain W3110, with bcsQ ‘repaired’ in the chromosome, has been generated and is used in the present study (strain AR3110) (Serra et al., 2013a).
Activation of curli and cellulose production depends on a hierarchical control network with RpoS (σS), the stationary phase sigma subunit of RNA polymerase (RNAP) acting as a master regulator. In addition, several diguanylate cyclases (DGCs) and phosphodiesterases (PDEs), which control the second messenger c‐di‐GMP, provide for decisive input into this network (Pesavento et al., 2008; Lindenberg et al., 2013). Moreover, various small regulatory RNAs play a modulatory role (summarized in Mika and Hengge, 2014). The output of this multiple signal‐integrating network is the control of expression of CsgD, a transcription factor, which directly drives the expression of the curli operon csgBAC and indirectly activates cellulose biosynthesis by driving the expression of YaiC, a DGC which is essential to activate cellulose synthase (summarized in Hengge, 2009; 2010). The overall result is a strong accumulation of CsgD and matrix components in the upper macrocolony layer, with a transition zone of slow growth between bottom and top layers, in which CsgD and matrix are produced heterogeneously (Serra and Hengge, 2014).
This asymmetric distribution of matrix components in macrocolony biofilms raises some questions. Is matrix production in the upper layer only just a fortuitous by‐product of RpoS dependency and the nutrient gradient that unavoidably builds up in these biofilms? But why then is the obviously energy‐intensive production of large amounts of extracellular protein and polysaccharide confined to the energy‐limited cells in the upper layer, with an underlying regulation that could hardly be more complex? This suggests that this kind of matrix stratification is functionally important – but for what?
Here, we demonstrate that genetically re‐wiring CsgD expression in a way that results in matrix production in both strata has striking consequences for macrocolony integrity, supracellular architecture and macroscopic morphology. These point to an essential spatial division of labour between matrix‐producing and matrix‐free cells in the building of an environmentally robust biofilm.
Results
Re‐wiring CsgD expression by promoter replacement
Using lambda red recombinase technology (Datsenko and Wanner, 2000), the strong stationary phase‐inducible RpoS‐dependent and c‐di‐GMP‐regulated promoter upstream of the chromosomal copy of the csgD gene of E. coli K‐12 was precisely replaced by a synthetic standard vegetative promoter (SynP2; see Experimental procedures for details). Flipping out the resistance cassette used for the replacement procedure (Datsenko and Wanner, 2000) also left behind a 75 bp sequence carrying the FRT site that is located directly upstream of the new promoter, which is therefore insulated from any putative regulatory regions further upstream. Downstream of the new −10 region, the sequence is the same as at the original locus, thus generating an identical transcript with a 148 nucleotide 5′‐untranslated region that is the target of several small RNAs, which negatively control CsgD expression (Mika and Hengge, 2014).
The biological activity of CsgD produced from this SynP2::csgD construct, i.e. its ability to drive curli expression, was tested using a single‐copy csgB::lacZ reporter fusion (csgB is the first gene in the curli structural operon). During growth in complex liquid medium, expression of this reporter was strongly activated at an optical density (OD578) of around 1.3 already (i.e. in the post‐exponential phase) and its expression lasted into the stationary phase (Fig. 1A). Thus, CsgD expression occurs about 3 h earlier when driven by SynP2 than under the control of its wild‐type promoter, where csgB::lacZ was expressed at an OD578 of > 2.5 only (Fig. 1B). SynP2::csgD‐driven csgB::lacZ was not expressed in rapidly, i.e. fully exponentially growing cells, which may be due to poor competition for RNAP of SynP2 with the very strong ribosomal promoters and/or due to sRNAs interfering with translation and/or stability of csgD mRNA under these conditions. About half of the output generated by SynP2::csgD was still RpoS‐dependent (Fig. 1A), consistent with previous findings that standard promoters not featuring any specific RpoD/RpoS discriminating elements are recognized by vegetative as well as RpoS‐containing RNAP (Gaal et al., 2001; Typas et al., 2007; Hengge, 2011). The SynP2::csgD construct is also uncoupled from regulation by c‐di‐GMP as shown with mutants lacking the DGCs (YdaM, YegE) and PDEs (YciR, YhjH) that strongly activate and inhibit wild‐type csgD transcription respectively (Pesavento et al., 2008; Lindenberg et al., 2013) (Fig. 1C).
Figure 1.
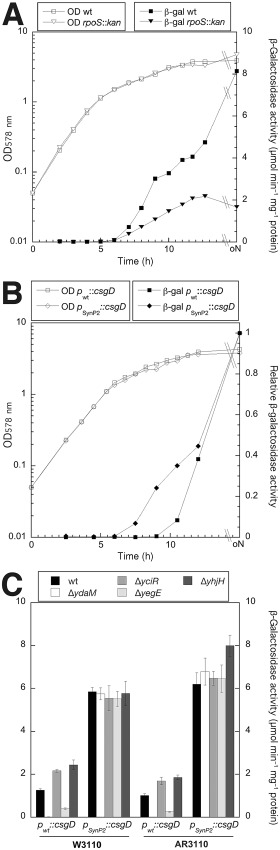
Comparison of the expression of curli genes under the control of CsgD expressed either from its natural promoter (P wt) or a synthetic vegetative standard promoter (PSynP2). Derivatives of E . coli K‐12 strains W3110 (A, B, C) and AR3110 (C) carrying a single‐copy csgB::lacZ reporter fusion as well as the mutations indicated directly on the figures were grown in LB medium at 28°C. Optical density at 578 nm (OD 578) was monitored (open symbols in A and B) and specific β‐galactosidase activities were determined. In (A) the csgB::lacZ expression pattern along the growth cycle and RpoS dependence was assayed in W3110 expressing CsgD under Synp2 control. In (B) the timing of induction of csgB::lacZ (expression normalized to 1.0) was compared in strains that express CsgD either under natural or Synp2 control. (C) Expression of CsgD under SynP2 control eliminates c‐di‐GMP dependence of csgB::lacZ, as tested using knockout mutations in the genes encoding the DGCs and PDEs that make up the central c‐di‐GMP switch that controls csg D in wild‐type E . coli K‐12 (Lindenberg et al., 2013).
Taken together, csgD under SynP2 control is expressed by the vegetative and stationary phase forms of RNAP and results in a curli expression that begins in the post‐exponential phase and lasts well into the stationary phase. Since growing cells in the bottom layer of macrocolony biofilms are in the post‐exponential state of growth (Serra et al., 2013b), the SynP2::csgD construct should be well suited for generating biofilm matrix in both strata of a macrocolony (see below).
CsgD expression from the vegetative SynP2 promoter alters macrocolony morphology
SynP2‐driven CsgD expression affected macrocolonial structure in a manner that was visible even to the naked eye (Fig. 2). The concentric ring pattern characteristic for strain W3110, which produces curli only as a matrix component, developed later and showed many small irregular breaks. In the macrocolonies of the curli‐ and cellulose‐producing strain AR3110, an initial concentric ring pattern became apparent after 24 h of growth. On the second day, the characteristic ridges began to emerge, but in contrast to the strain with CsgD under wild‐type control, these ridges were formed also in the central part of the macrocolony where they produced an intertwined pattern. On the third day of growth, the flat areas of the SynP2::csgD macrocolony displayed a ‘pavement’ pattern not found in wild‐type macrocolonies as if breaking into pieces. Overall, bypassing the normal regulation of CsgD by expressing it under the control of the standard vegetative promoter SynP2 has clear effects on the macroscopic appearance of these biofilms.
Figure 2.
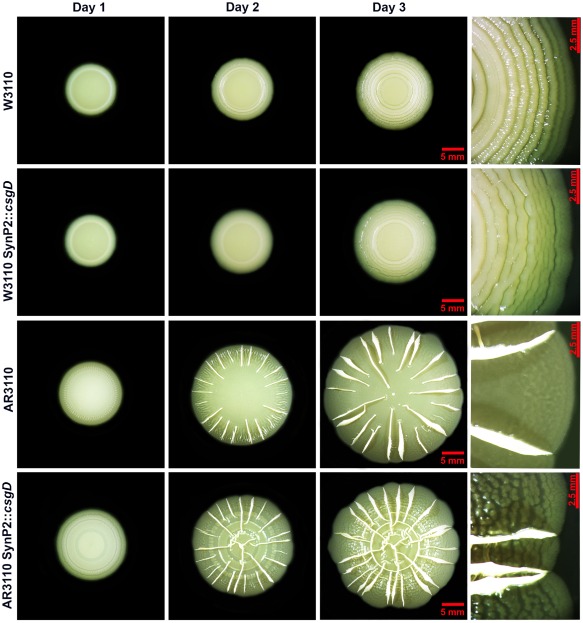
Macrocolony morphology is altered by expression of CsgD under the control of the SynP2 promoter. Time‐course of macrocolony formation in TS‐containing salt‐free LB plates of strains W3110, AR3110 and respective derivatives expressing CsgD under the control of the SynP2 promoter. Right panels show enlarged view of the respective macrocolonies at day 3.
CsgD expression from the vegetative SynP2 promoter drives matrix expression in both physiological layers of macrocolony biofilms
In order to visualize matrix production in different biofilm zones, macrocolonies, which express csgD either under wild‐type or SynP2 control, were grown in the presence of the amyloid‐ and cellulose‐binding fluorescent dye Thioflavin S (TS) (Serra et al., 2013b) and subject to cryomicrotomy and fluorescence microscopy. In addition, high‐resolution scanning electron microscopy (SEM) was used to visualize matrix production, cell shape and division at the cellular level within the macrocolonies. This analysis was performed for the curli‐only strain W3110 as well as for strain AR3110, which produces both curli and cellulose.
Also in vertical cryosections (Fig. 3), beginning ring formation of a 3 day old macrocolony of the W3110 derivative expressing csgD under SynP2 control was visible, but the rings were more irregular and – unlike in macrocolonies of the original W3110 – did not rise further into the typical domes of curli‐producing cells with matrix‐free cells filling the space underneath. Rather, also the lower layer of cells generated matrix which produced a distinct lower fluorescent line in the cryosections, with a tendency of the thick upper and thin lower layers to break apart. SEM close ups (Fig. 4) showed that this lower layer looked like a ‘base plate’ that was separate from the upper layer which had fragmented into a relatively flat ring pattern.
Figure 3.
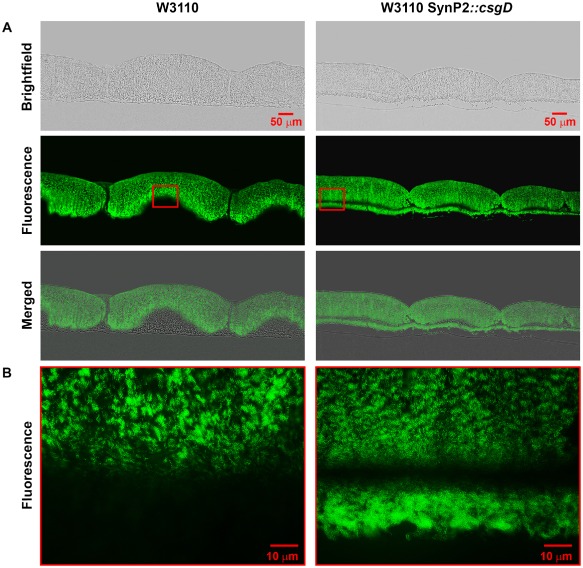
SynP2‐dependent CsgD expression results in production of a curli fibre matrix in the upper and lower layers of macrocolonies of strain W3110. Macrocolony biofilms of strain W3110 expressing CsgD either from its natural promoter or the SynP2 promoter were grown for 3 days on salt‐free LB medium supplemented with TS, then cryo‐embedded and sectioned perpendicular to the plane of the macrocolony at a thickness of 5 μm.
A. Macrocolony sections were visualized at low magnification with brightfield (top panels) and fluorescence (middle panels) and shown as merged images (bottom panels).
B. Enlarged views of TS fluorescence patterns in macrocolony areas boxed in red in panel A.
Figure 4.
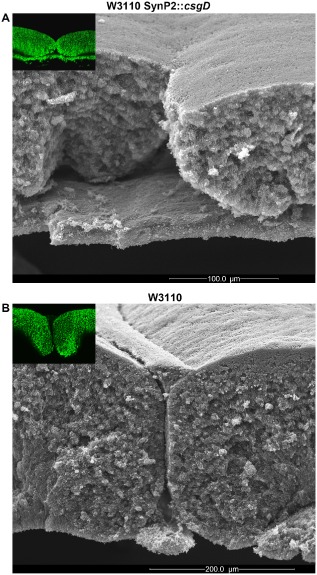
SynP2‐driven CsgD expression transforms the lower layer of growing cells in a W3110 macrocolony into a rigid ‘base plate’. Side‐view SEM images at low magnification showing a cross section of macrocolonies of strain W3110 expressing CsgD either from SynP2 (A) or its natural promoter (B). The upper‐left insets are low‐magnification fluorescence images of corresponding macrocolony regions showing the TS‐stained curli fibre matrix. A false‐coloured version of a section of the SEM image shown in (B) has previously been published (Serra and Hengge, 2014).
At larger magnification (Fig. 5) it became clear that cells at all positions within the macrocolony of W3110 SynP2::csgD were encased by a scaffold of dense curli matrix. Thus, the breaks between the rings formed by the upper layer did not open up since all cells produced the aggregative curli fibre network (Fig. 5A), which is very much in contrast to wild‐type W3110, where the breaks open up and elongated dividing cells from the lower layer are squeezed upwards through the breaks and to the surface (Fig. 5B, blue arrow), where they begin to produce curli and thereby ‘seal’ the breaks with a thin ‘secondary’ ring (Fig. 4B; for a detailed description of this wild‐type behaviour, see Serra et al., 2013a). Cells in the lower layer ‘base plate’ of W3110 SynP2::csgD macrocolonies massively produce a curli fibre network, even though these cells are clearly elongated, divide and produce flagella (which are visible as thicker and longer filaments entangled within the curli network in Fig. 5C and E; compare with the wild‐type W3110 shown in Fig. 5D and F).
Figure 5.
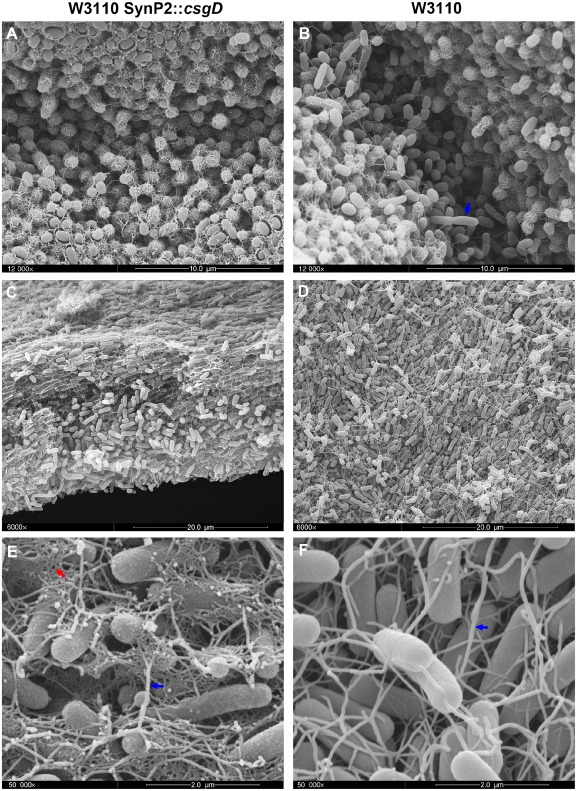
SynP2‐driven CsgD expression results in curli production by cells in all zones of macrocolonies of strain W3110. High‐resolution SEM images of macrocolonies of strain W3110 expressing CsgD either from its natural promoter (right panels) or the SynP2 promoter (left panels). SEM images offer detailed views of the macrocolony surface at the breaks between the rings (A and B) and the macrocolony interior at the lower layer (C and D). A blue arrow in panel B points to elongated dividing cells that are free of curli. (E) Magnified SEM view of the lower layer of W3110 SynP2::csg D macrocolony showing elongated flagellated cells surrounded by a dense network of curli fibres. (F) Magnified SEM view of the lower layer of W3110 macrocolony showing elongated cells interconnected by flagella. Blue arrows in panels E and F point to flagella filaments. A red arrow in panel E indicates the network of curli fibres.
A similarly altered matrix expression pattern was observed in cryosections through macrocolonies of the AR3110 strain with csgD under SynP2 control (Fig. 6). Also here a thin lower layer of growing cells synthesized the matrix and broke into large chunks of cells that correspond to the macroscopic ‘pavement’ pattern of the flat macrocolony areas (Fig. 2). These chunks of cells occasionally got trapped into the folding and upward‐pushing ridges (Fig. 7A), with a close‐up (Fig. 7B) showing these trapped aggregates to contain cells of longer shape than those present in the surrounding areas that originated in the top layer of the macrocolony.
Figure 6.
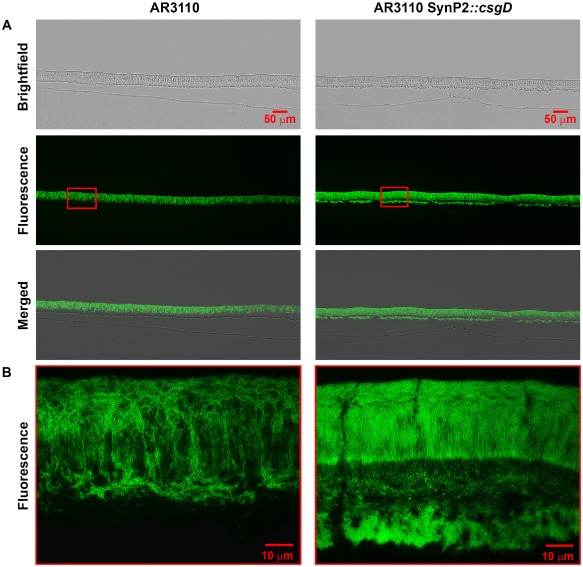
SynP2‐dependent CsgD expression occurs in both physiological layers and has a pronounced effect on supracellular architecture of macrocolonies of strain AR3110. Macrocolony biofilms of strain AR3110 expressing CsgD either from its natural promoter or the SynP2 promoter were grown for 3 days on salt‐free LB medium supplemented with TS, then cryo‐embedded and sectioned perpendicular to the plane of the macrocolony at a thickness of 5 μm.
A. Macrocolony sections were visualized at low magnification with brightfield (top panels) and fluorescence (middle panels) and shown as merged images (bottom panels).
B. Enlarged views of TS fluorescence pattern in macrocolony areas boxed in red in panel A.
Figure 7.
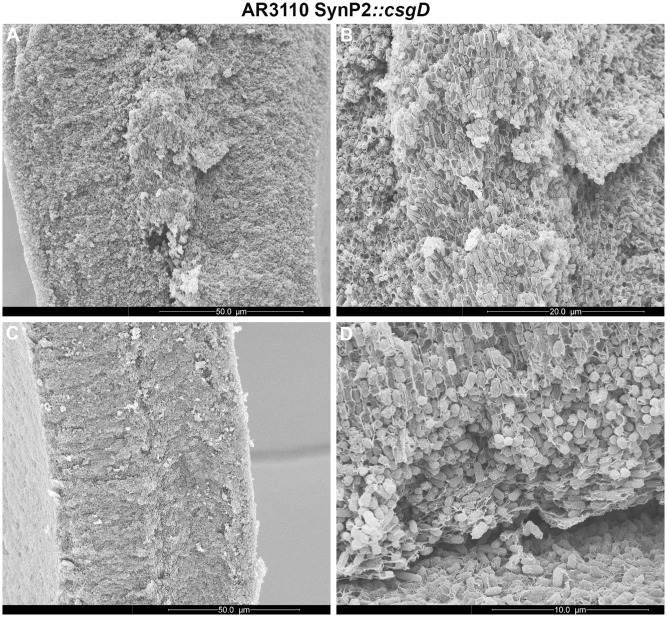
High‐resolution SEM analysis of altered supracellular architecture of macrocolonies of strain AR3110 expressing CsgD under SynP2 control. SEM images of representative cross‐sections at the tip (A) and middle body (C) of a macrocolony ridge of strain AR3110 SynP2 ::csg D. (B) Magnified SEM view of the central area of the ridge tip presented in A, offering details of a chunk of rod‐shaped cells tightly encased by matrix. (D) Magnified SEM view of the zone of transition between the lower and upper layers of an AR3110 SynP2::csg D macrocolony. The image offers detailed view of the spatial arrangement of cells and sheet‐like envelopes – distinctive of cellulose – in the lower part of the upper macrocolony layer.
Interesting changes in supracellular architecture were also seen in the upper layer of flat areas of the macrocolonies, i.e. in a zone where strain AR3110 shows much higher structural order than W3110 (compare left sides of Figs 3 and 6). As previously described (Serra et al., 2013a), the matrix‐generating upper layer of a wild‐type macrocolony can again be subdivided into three distinct zones (Fig. 6B, left): (i) cells forming small and rather horizontal chains in the lower part, (ii) cells that form vertical pillars stabilized by long filaments of cellulose in the middle zone and (iii) a surface zone with cells encased in a curli–cellulose composite matrix. Moreover, this highly ordered matrix production is heterogeneous, as indicated by the many non‐fluorescent dark patches in the matrix‐generating upper layer of the AR3110 macrocolony (in corresponding brightfield images, these dark areas are revealed to be filled with cells; Serra et al., 2013a). With CsgD expression driven by SynP2, these three zones of the matrix‐generating upper layer remained visually distinguishable, but the heterogeneity disappeared – now all cells in the ‘pillars/surface’ zones seemed to produce a matrix (Fig. 6B, right). A SEM close‐up (Fig. 7D) shows fuzzy matrix filaments along the horizontal chains and sheet‐like ‘envelopes’ around the cells forming the pillars that are clearly distinct from the fibrous network of the curli ‘baskets’ (compare with Fig. 5A), indicating that the matrix in this zone of AR3110 macrocolonies mainly consists of cellulose (Serra et al., 2013a).
In all these experiments (Figs 3, 4, 5, 6, 7), an altered production and localization of matrix was observed as a function of the matrix regulator CsgD being expressed from the synthetic vegetative promoter SynP2. In order to also directly visualize the activity of this artificial promoter, the strains containing SynP2::csgD were transformed with a low‐copy number plasmid carrying a similarly constructed SynP2::gfp fusion. The presence of this reporter plasmid did not affect macrocolony morphology (Fig. S1). Cryosections through these macrocolonies and fluorescence showed that SynP2 is indeed active in both the upper and lower layers of the colonies (Fig. S1). By contrast, Gfp expressed under the control of the wild‐type csgD promoter was previously shown to be expressed in the upper layer only (Serra et al., 2013b).
Taken together, the SynP2::csgD construct indeed drives CsgD and matrix expression in both physiological strata, no matter whether this matrix consists of curli fibres only (W3110) or of curli fibres and cellulose (AR3110). This altered spatial distribution of biofilm matrix has pronounced effects on biofilm microarchitecture and – by immobilizing the growing cells of the lower layer in a rigid base plate – seems to destabilize macrocolony biofilms: in the much higher and more compact macrocolonies of the W3110 derivative, the top and bottom layers tend to separate, whereas in the macrocolonies of the AR3110 derivative, which spread out horizontally into a much larger area and thus remain very flat, the lower layer disrupts into separate large chunks of matrix‐encased cell aggregates.
Matrix production in both physiological strata of macrocolonies causes disruption, desiccation and exfoliation of the air‐exposed top layer of this type of biofilm
The matrix scaffold in the lower layer of growing cells of AR3110 SynP2::csgD macrocolonies also led to a novel behaviour when macrocolonies were gently overlaid with liquid medium (Fig. 8A and Fig. S2): the very thin and even translucent, but strongly self‐coherent upper layer of the macrocolony just floated away with the big chunks of cells in the lower layer remaining bound to the agar surface. Moreover, the flat areas of the floating top layer rapidly stretched out thereby losing the ‘pavement’ pattern, which therefore is indeed due to the chunks of matrix‐encased cells in the bottom layer. This physical separation of the two colony layers also allowed to directly assay the presence of CsgD in both layers by immunoblot analysis (Fig. 8B and C).
Figure 8.
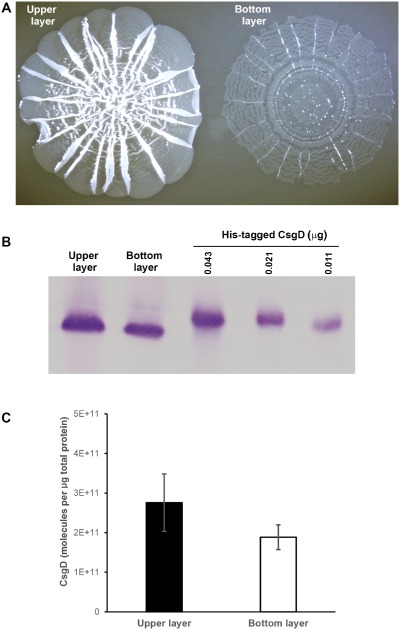
Physical separation of the integral upper and lower layers of macrocolonies of strain AR3110 expressing CsgD under SynP2 control. Three‐day‐old AR3110 SynP2::csg D macrocolonies grown on agar plates were gently overlaid with liquid medium, which results in the upper layer detaching and floating away. (A) The two macrocolony layers with the upper layer floating and the lower layer attached to the agar surface. (B) Immunoblot showing CsgD protein in the two layers, with purified His6‐tagged CsgD used for the quantification shown in (C).
Finally, a novel macrocolony morphotype was observed when AR3110 SynP2::csgD was grown on agar plates for extended times (10 days; Fig. 9): the air‐exposed upper layer of nutrient‐deprived cells ruptured along multiple irregular lines indicating a detachment from the lower layer on the agar surface and desiccation. Along the breaking lines, the edges folded upwards (thereby also revealing the very constant height of the upper layer as characteristic double lines), which finally led to exfoliation of large areas of the upper macrocolony layer (Fig. 9A and B).
Figure 9.
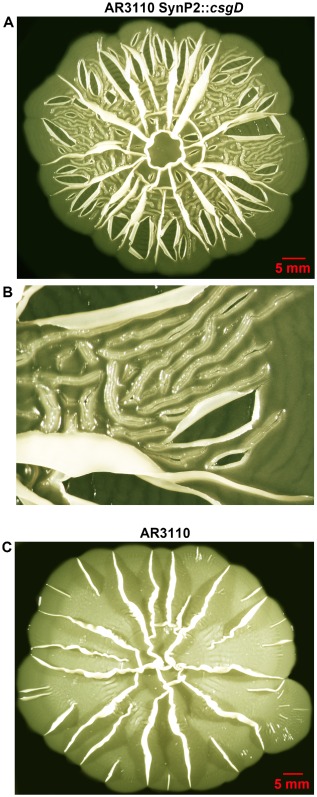
Long‐term desiccation and exfoliation of the upper layer of macrocolonies of strain AR3110 expressing CsgD under SynP2 control.
A. Top view image of an AR3110 SynP2::csg D macrocolony grown on agar plates for 10 days. The image shows severe disruption of the upper macrocolony layer with multiple irregular breakages, some of which give rise to an exfoliation pattern.
B. Magnified view of a region of the AR3110 SynP2::csg D macrocolony presented in A, offering details of breakages and exfoliated sectors of the upper macrocolony layer.
C. Top view image of a macrocolony biofilm of strain AR3110 grown on agar plates for 10 days.
By contrast, macrocolonies of AR3110 with wild‐type CsgD expression did not disrupt, with the entire macrocolony remaining in tight contact with the humid agar support (Fig. 9C). Even during the structurally very dynamic early phase of macrocolony formation, where the buckling begins (Fig. 10A and B), the growing matrix‐free cells of the lower layer manage to constantly fill the space between the folding upper layer and the moist agar surface, thus preventing a disruption of capillary action (Fig. 10C and D).
Figure 10.
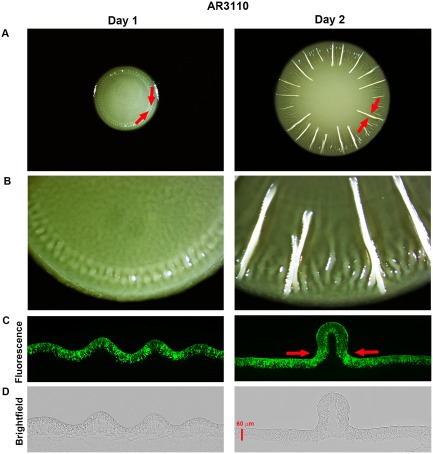
Matrix‐free cells of the lower layer maintain tight contact of the colony to the agar surface when young AR3110 macrocolonies buckle up into ridges. (A) Images of a representative AR3110 macrocolony after 1 and 2 days of growth on TS‐containing salt‐free LB plates. Red arrows indicate areas under particular mechanical tension generated by the increasingly constrained space that cells already connected by the elastic curli‐cellulose matrix can enter (Serra et al., 2013a). (B) Enlarged views of the respective macrocolonies offering details of emerging ridges. (C) Fluorescence and (D) brightfield images of vertical cross‐sections of corresponding macrocolonies presented in A. Red arrows in D represent convergent mechanical forces that promote colony buckling up.
We conclude that matrix production in the upper layer only of E. coli macrocolonies is an architectural feature that is essential to preserve long‐term integrity of this highly structured type of biofilm at the air–solid medium interface.
Discussion
Macrocolony biofilms of E. coli exhibit a clear physiological stratification with vegetatively growing cells in the bottom layer and the outer edges of the expanding colony and slowly growing and finally stationary phase cells in the upper layer where an extracellular scaffold of curli fibres and cellulose is produced that is arranged in a highly distinct architecture (Serra and Hengge, 2014). This matrix confers strong cohesiveness and high elasticity, i.e. tissue‐like properties to the macrocolonies which therefore fold and buckle up vertically as a result of tension building up by cellular proliferation and crowding (Serra et al., 2013a). The result can be rather spectacular macrocolony morphologies – in fact a trait that is ubiquitous among microbes, with even yeasts growing into similar colony patterns (see Okegbe et al., 2014 for a multispecies collection of macrocolony images).
In E. coli, the asymmetric matrix production in the upper macrocolony layer only is a consequence of (i) the nutrient gradient building up in this biofilm which leads to physiological stratification and (ii) CsgD, the master regulator of matrix biosynthesis, being under control of the stationary phase sigma factor RpoS (Serra et al., 2013b). Re‐wiring CsgD expression in a manner which resulted in matrix production in the upper and lower strata of the macrocolonies allowed us to address the question whether the vertical stratification of matrix production is physiologically important. Thus, artificially engineered matrix production in both layers resulted in perturbation of the supracellular architecture and macroscopic morphology and, in the longer run, in detachment, desiccation, breakage and exfoliation of the upper macrocolony layer. Thus, matrix production in the upper layer only is essential for physical integrity of E. coli macrocolony biofilms. Moreover, these phenotypes also directly indicate why this matrix stratification is essential: trapping the growing cells of the lower stratum in a scaffold of dense matrix – in fact a rigid base plate‐like structure – no longer allows these cells to flexibly invade the space that opens up when the upper layer buckles into ridges and wrinkles or – if curli only is produced – into dome‐like ring patterns. As a consequence, the upper layer detaches and can no longer maintain its water content via capillary action, therefore drying out and exfoliating like paper (after all, paper is the technical equivalent of desiccated cellulose).
Overall, the necessity for matrix production in the upper layer only is thus a consequence of the physical properties conferred by the hydrated curli‐cellulose composite matrix, which make the macrocolony react like a soft elastic sheet under mechanical tension (Cerda and Mahadevan, 2003). Similar properties have recently also been described for pellicle biofilms (Trejo et al., 2013). However, what is the benefit of such tissue‐like behaviour, especially since it entails the difficult task of energy‐intensive production of large amounts of extracellular polymers in the energy‐deprived cells of the upper macrocolony layer? An extensive matrix that essentially encloses cells at the surface of the macrocolony biofilm (Serra et al., 2013a) clearly protects against abiotic or biotic stresses, such as toxic chemicals or predation (Branda et al., 2005; Flemming and Wingender, 2010; DePas et al., 2014). Moreover, cellulose, which is the matrix component that can bind large amounts of water and confers elasticity to the macrocolony (Zogaj et al., 2001), is arranged in vertical filaments, sheets and sheaths that give rise to the vertical ‘pillars’ of cells in the lower region of the matrix‐producing layer (Figs 6 and 7) (Serra et al., 2013a). These long‐range connections seem to connect the lower and upper colony layers, which forces growing cells to spread out laterally and thus produces very flat macrocolonies of a very even height of approximately 60–65 μm (by contrast, the ring‐forming macrocolonies of curli‐only producing E. coli grow 200 μm and higher; compare Figs 3 and 6). This pronounced flatness as well as the buckling up of the flat elastic macrocolonies increases the surface‐to‐volume ratio of the biofilm and thus clearly optimizes access to oxygen (Dietrich et al., 2013; Serra et al., 2013a; Kempes et al., 2014). These advantages are obviously significant enough to outweigh the price of having to deal with the topological consequences, i.e. the necessity of a complex regulation that ensures (i) the absence of matrix in the lower layer of cells that have to be flexible enough to spread into openings below the folds and thus maintain contact and capillary action between the vertically folding layer of matrix‐immobilized cells and the humid support and (ii) the (still unknown) logistics of providing the already carbon‐ and energy‐limited cells in the upper layer with sufficient resources to produce the massive amount of extracellular matrix.
This interplay between metabolic and matrix stratification and biophysical properties that shape E. coli macrocolonies invites a comparison with other bacterial species. While wrinkles and ridges are rather ubiquitous features of macrocolony morphology, metabolic requirements – in particular the dependence on oxygen for growth – are very different and represent an adaptation to the primary niches of different species. This has consequences for the physiological stratification of macrocolony biofilms, which in turn should affect the regulation of extracellular matrix production. Thus, Pseudomonas aeruginosa – another well‐studied Gram‐negative biofilm model bacterium – depends on oxygen for metabolic activity and growth (if not provided with an electron acceptor for anaerobic respiration). As a consequence, metabolically active cells, which are in a state of post‐exponential growth, populate the upper layer of a macrocolony, where they find sufficient oxygen as well as nutrients, which can diffuse upwards through the lower layer of metabolically inert cells (Lenz et al., 2008; Williamson et al., 2012; Zhang et al., 2013). What does this mean for the regulation of synthesis of the biofilm matrix, which in the case of P. aeruginosa contains the EPSs Psl and Pel as well as eDNA? Unfortunately, the regulation of these genes is not fully understood and, to our knowledge, the localization of their expression or of the matrix itself within macrocolony biofilms has not been studied. However, in order to benefit from protection by a matrix and to generate the intricate macrocolony morphology with wrinkles and high ridges (Dietrich et al., 2013; Kempes et al., 2014; Okegbe et al., 2014), which is very similar to that of E. coli, one has to assume that matrix is produced by the post‐exponentially growing cells in the upper layer of P. aeruginosa macrocolonies. This would not only facilitate the energy‐intensive matrix production (in comparison with E. coli), but is consistent with the expression of rpoS and the quorum sensing regulator gene rhlR in this layer (Pérez‐Osorio et al., 2010), since psl genes are activated by RpoS (Irie et al., 2010) and three interconnected quorum sensing systems (Las, Rhl, Pqs) play multiple regulatory roles in the production of Psl, Pel and eDNA (Davies et al., 1998; Davey et al., 2003; Allesen‐Holm et al., 2006; Gupta and Schuster, 2012). The inverse physiological stratification of macrocolonies of P. aeruginosa and E. coli – with the latter not even possessing acyl‐homoserine lactone‐based quorum sensing – could thus provide an explanation for the striking differences in biofilm regulation in these two gammaproteobacteria. In addition, the question arises, how much matrix is present in the lower layer and how P. aeruginosa macrocolonies remain in tight contact with the moist agar surface in areas where they buckle up? Future studies should therefore investigate amounts and spatial distribution of the various matrix components in P. aeruginosa macrocolonies.
Bacillus subtilis, a model organism for biofilm formation by Gram‐positive bacteria, demonstrates an intriguingly different solution to the problem of buckling macrocolony desiccation. Bacillus subtilis macrocolonies also form complex patterns with wrinkles and elongated elevated structures that depend on the amyloid fibre protein TasA, an EPS and the BslA protein as matrix components (Aguilar et al., 2007; Romero et al., 2010; Kobayashi and Iwano, 2012; Hobley et al., 2013; Vlamakis et al., 2013). Whereas flagella genes are expressed at the outer edges, matrix genes are active in principle everywhere else in macrocolonies, with sporulation genes finally turning on in cells close to the air‐exposed surface, i.e. farthest away from the nutrient‐providing agar (Vlamakis et al., 2008). In these macrocolonies, which apparently do not show matrix stratification, localized cell death precedes, facilitates and possibly determines the site of buckling (Asally et al., 2012). In contrast to E. coli or P. aeruginosa macrocolonies, which fold into ridges with a thin bilayer structure that are pushed higher and higher (Serra et al., 2013a), the entire B. subtilis macrocolony (which is about 200 μm thick) buckles up into broader openings that can close at the bottom (either by growth or by the flat parts of the growing biofilm pushing together). This results in the formation of tube‐like channels, which are filled with liquid due to water flow that arises from evaporation from the colony surface (Wilking et al., 2013). While it has been pointed out that this network of horizontal channels facilitates nutrient transport (Wilking et al., 2013), it is obviously also a system that keeps the macrocolony hydrated. Moreover, with the channels closing at the bottom, the lower part of the macrocolony is flat again and remains in tight contact with the moist agar surface.
In conclusion, the extracellular matrix which tightly surrounds the cells in bacterial biofilms is not only protective and cohesive but it confers elastic tissue behaviour to macrocolony biofilms. As a consequence, cellular proliferation and crowding require flat macrocolonies to buckle up into wrinkles and ridges. As pointed out in our study this behaviour comes at the risk of losing contact to the humid support followed by desiccation and potential exfoliation of large parts of the air‐exposed biofilm. Different species of bacteria have found different solutions to this problem that are intimately connected to their specific metabolic properties, which dictates physiological stratification of these biofilms, which in turn impacts on regulatory mechanisms of matrix biosynthesis. Insight into these mechanisms also has implications for any attempts by synthetic biology to produce and ‘shape’ bacterial communities with specific properties.
Experimental procedures
Bacterial strains
The strains used are derivatives of the E. coli K‐12 strains W3110 (Hayashi et al., 2006) or AR3110 (Serra et al., 2013a), with the latter being a direct derivative of W3110, in which codon 6 in the chromosomal copy of bcsQ (which in the cellulose‐negative W3110 is the stop codon TAG) was changed to the sense codon TTG (Serra et al., 2013a). Where required, this intact copy of bcsQ was transferred using a nearby insertion of a kanamycin resistance cassette (kan; inserted between dppF and yhjV), which is > 90% P1‐co‐transducible with bcsQwt (A. Richter and R. Hengge, unpublished) and which can be flipped out using FLP recombinase (Datsenko and Wanner, 2000). The rpoS::kan, ydaM::cat, yciR::kan, yegE::kan, yhjH::cat and yhjH::kan are full orf deletion/resistance cassette insertions previously described (Weber et al., 2006; Pesavento et al., 2008). These mutations were transferred by P1 transduction (Miller, 1972).
Replacement of the wild‐type promotor of csgD by the standard vegetative promoter Synp2
The original csgD promoter in the chromosome of strain W3110, which is recognized by RpoS‐containing RNAP, was replaced by a 104 bp sequence including a FLP recombination target (FRT) site and the −35 to −10 sequence of a consensus promoter closely related to the tac promoter (TTGACAATTAATCATCCGGCTCGTATAAT‐GTGTGGA(+1), with the −35 and −10 regions underlined; here referred to as SynP2::csgD). Using pKD13 (Datsenko and Wanner, 2000) as a template, a DNA fragment carrying a kan cassette followed by the SynP2 sequence and flanked by sequences homologous to the csgD regulatory region was obtained by polymerase chain reaction (PCR) (the oligonucleotide primers used were: 5′‐GTTAACATTTTAATATAACGAGTTACATTTAGTTACATGTTTAACACGTGTAGGCTGGAGCTGCTTC‐3′ and 5′‐AATGGGTAAAATATAAAACTAATGGATTACATCTGATTTCATTATACGAGCCGGATGATTAATTGTCAAGGATCCGTCGACCTGCAGTTCG‐3′, with the reverse‐complementary −10 and −35 regions of SynP2 underlined). This fragment was used for the replacement procedure following the one‐step inactivation protocol (Datsenko and Wanner, 2000). After P1 transduction into the required strains, the kan cassette was flipped out as described (Datsenko and Wanner, 2000). The correct flip out and resulting sequence was confirmed by sequencing of appropriate PCR fragments (GATC Biotech).
Construction of a SynP2::gfp reporter fusion on a low‐copy number vector
The vector backbone and the ‘superfolder gfp’ (SFgfp) allele used here originates from plasmid pXG10‐SF (Corcoran et al., 2012). In a previous study (Typas and Hengge, 2005), the original chloramphenicol resistance cassette on pXG10‐SF had already been replaced by an ampicillin resistance cassette followed by the synthetic promoter SynP21 (which differs from SynP2 by one base pair in the −35 region). In addition, the original PLtetO‐1‐lacZ186 region (upstream of SFgfp) on pXG10‐SF had been replaced by an artificial 5′‐untranslated region, such that SFgfp was expressed under SynP21 control. In order to introduce SynP2 instead of SynP21, an appropriate fragment flanked by NruI and XhoI restriction sites was replaced by an almost identical PCR fragment, in which SynP21 was changed to SynP2 (the oligonucleotide primers used to generate this fragment were 5′‐GATCCTTTATTTAAATTCGCGAGGTCTGACGCTCAGTGGAACG‐3′ and 5′‐CTCACTCGAGAGTCGACGTGATTTCATTATACGAGCCGGATGATTAATTGTCAAGGATCCCC‐3′, with restriction sites in boldface and the reverse‐complementary −10 and −35 regions of SynP2 underlined).
Growth of bacterial macrocolonies
Cells were grown overnight in liquid Luria–Bertani (LB) medium (Miller, 1972) under aeration at 37°C. Five microlitres of the overnight cultures were spotted on salt‐free LB agar plates (in order to achieve reproducible colony morphology, these plates always have to contain exactly the same volume of medium and have to be prepared under exactly identical conditions). Where indicated, these plates were supplemented with TS (40 μg ml−1), which binds to curli fibres and cellulose but does not affect colony morphology (Serra et al., 2013b). Plates with macrocolonies were incubated at 28°C for up to 10 days. Growth below 30°C is required for matrix production since expression of CsgD is temperature sensitive in E. coli K‐12 strains (Weber et al., 2006).
Stereomicroscopy
Escherichia coli macrocolony biofilms were visualized at 10× magnification with a Stemi 2000‐C stereomicroscope (Zeiss; Oberkochen, Germany). Digital photographs were taken with an AxioCamICC3 digital camera coupled to the stereomicroscope, operated via the AxioVision 4.8 software (Zeiss).
Cryosectioning of macrocolony biofilms and fluorescence microscopy
The procedure and materials used for cryomicrotomy of macrocolony biofilms and to examine and visualize TS fluorescence in cryosections were as described before (Serra et al., 2013b).
SEM of bacterial macrocolonies
Preparation and subsequent SEM analysis of macrocolony biofilm samples were performed as described before (Serra et al., 2013b).
Determination of cellular CsgD levels in macrocolonies by immunoblot analysis
Upper and lower layers of macrocolonies of strain AR3110 carrying SynP2::csgD both represent rigid macrostructures that were separated physically by gently overlaying the colonies with PBS buffer, which results in the upper layer floating off as a single self‐coherent aggregate. This upper layer as well as the agar‐adherent bottom layer were recovered, cell aggregates were gently washed twice and subject to SDS‐PAGE and immunoblot analysis as described previously (Lange and Hengge‐Aronis, 1994). A polyclonal serum against CsgD (custom‐made by Pineda‐Antikörper‐Service, Berlin) was used. Detection and quantification of CsgD was performed as described by Richter and colleagues (2014).
Determination of β‐galactosidase activity
β‐Galactosidase activity was assayed by use of o‐nitrophenyl‐β‐D‐galactopyranoside as a substrate and is reported as μmol of o‐nitrophenol per min per mg of cellular protein (Miller, 1972). All experiments were done as three independent replicates. In single data point experiments, the data were averaged. For experiments showing the expression of lacZ fusions along the entire growth cycle, a representative experiment is shown.
Author contributions
Concept of the study: RH; design of experiments: DOS, GK, RH; experiments were performed by DOS and GK; interpretation of data: all authors; the paper was written by RH with input from the other authors.
Supporting information
Fig. S1. Patterns of SynP2‐driven GFP expression in vertical cryosections through macrocolonies of strains W3110 and AR3110 also carrying SynP2::csgD. Macrocolony biofilms of strains W3110 and AR3110 expressing the chromosomal copy of csgD from the SynP2 promoter and harbouring a low‐copy number vector containing the SynP2::gfp reporter fusion (pSynP2::gfp) were grown on salt‐free LB medium supplemented with ampicillin at 28°C.
A. Images show respective macrocolonies at day 3. The presence of the plasmid carrying SynP2::gfp did not alter the morphology of W3110 and AR3110 SynP2::csgD macrocolonies (compare with Fig. 2). These macrocolonies were cryo‐embedded and sectioned perpendicular to the plane of the macrocolony.
B. Thin macrocolony sections were visualized at low magnification with brightfield (top panels) and fluorescence (middle panels) and are also shown as merged images (bottom panels).
C. Enlarged views of GFP expression pattern in macrocolony areas boxed in red in respective fluorescence images presented in B.
Fig. S2. Floating off the integral upper layer of macrocolonies of strain AR3110 expressing CsgD under SynP2 control. Three‐day‐old AR3110 SynP2::csgD macrocolonies grown on salt‐free LB agar plates were gently overlaid with liquid medium (PBS). Immediately after that, the strongly self‐coherent upper layer of the macrocolonies detached and floated away. The image shows the entire upper macrocolony layer separated from the lower layer, which remained attached to the agar surface. The bottom layer consists of big chunks of matrix‐encased cells that give rise to the ‘pavement’ pattern observed in intact AR3110 SynP2::csgD macrocolonies (Fig. 2). Note that the flat areas of the upper layer are only approximately 60 μm thick and therefore appear translucent.
Acknowledgements
We thank Jens Rolff (Freie Universität Berlin) for the possibility to use the scanning EM in his laboratories.
Financial support was provided by the European Research Council under the European Union's Seventh Framework Programme (ERC‐AdG 249780 to RH).
The authors declare that they do not have any conflict of interests.
References
- Aguilar, C. , Vlamakis, H. , Losick, R. , and Kolter, R. (2007) Thinking about Bacillus subtilis as a multicellular organism. Curr Opin Microbiol 10: 638–643. [DOI] [PMC free article] [PubMed] [Google Scholar]
- Allesen‐Holm, M. , Barken, K.B. , Yang, L. , Klausen, M. , Webb, J.S. , Kjelleberg, S. , et al (2006) A characterization of DNA release in Pseudomonas aeruginosa cultures and biofilms. Mol Microbiol 59: 1114–1128. [DOI] [PubMed] [Google Scholar]
- Asally, M. , Kittisopikul, M. , Rué, P. , Du, Y. , Hu, Z. , Cagatay, T. , et al (2012) Localized cell death focuses mechanical forces during 3D patterning in a biofilm. Proc Natl Acad Sci U S A 109: 18891–18896. [DOI] [PMC free article] [PubMed] [Google Scholar]
- Branda, S.S. , Vik, A. , Friedman, L. , and Kolter, R. (2005) Biofilms: the matrix revisited. Trends Microbiol 13: 20–26. [DOI] [PubMed] [Google Scholar]
- Cerda, E. , and Mahadevan, L. (2003) Geometry and physics of wrinkling. Phys Rev Lett 90: 074302. [DOI] [PubMed] [Google Scholar]
- Corcoran, C.P. , Podkaminski, D. , Papenfort, K. , Urban, J.H. , Hinton, J.C. , and Vogel, J. (2012) Superfolder GFP reporters validate diverse new mRNA targets of the classic porin regulator, MicF RNA. Mol Microbiol 84: 428–445. [DOI] [PubMed] [Google Scholar]
- Datsenko, K.A. , and Wanner, B.L. (2000) One‐step inactivation of chromosomal genes in Escherichia coli K‐12 using PCR products. Proc Nat Acad Sci USA 97: 6640–6645. [DOI] [PMC free article] [PubMed] [Google Scholar]
- Davey, M.E. , Caiazza, N.C. , and O'Toole, G.A. (2003) Rhamnolipid surfactant production affects biofilm architecture in Pseudomonas aeruginosa PAO1. J Bacteriol 185: 1027–1036. [DOI] [PMC free article] [PubMed] [Google Scholar]
- Davies, D.G. , Parsek, M.R. , Pearson, J.P. , Iglewski, B.H. , Costerton, J.W. , and Greenberg, E.P. (1998) The involvement of cell‐to‐cell signals in the development of a bacterial biofilm. Science 280: 295–298. [DOI] [PubMed] [Google Scholar]
- DePas, W.H. , Syed, A.K. , Sifuentes, M. , Lee, J.S. , Warshaw, D. , Saggar, V. , et al (2014) Biofilm formation protects Escherichia coli against killing by Caenorhabditis elegans and Myxococcus xanthus . Appl Environ Microbiol 80: 7079–7087. [DOI] [PMC free article] [PubMed] [Google Scholar]
- Dietrich, L.E. , Okegbe, C. , Price‐Whelan, A. , Sakhtah, H. , Hunter, R.C. , and Newman, D.K. (2013) Bacterial community morphogenesis is intimately linked to the intracellular redox state. J Bacteriol 195: 1371–1380. [DOI] [PMC free article] [PubMed] [Google Scholar]
- Flemming, H.‐C. , and Wingender, J. (2010) The biofilm matrix. Nat Rev Microbiol 8: 623–633. [DOI] [PubMed] [Google Scholar]
- Gaal, T. , Ross, W. , Estrem, S.T. , Nguyen, L.H. , Burgess, R.R. , and Gourse, R.L. (2001) Promoter recognition and discrimination by EσS RNA polymerase. Mol Microbiol 42: 939–954. [DOI] [PubMed] [Google Scholar]
- Gupta, R. , and Schuster, M. (2012) Quorum sensing modulates colony morphology through alkyl quinolones in Pseudomonas aeruginosa . BMC Microbiol 12: 30. [DOI] [PMC free article] [PubMed] [Google Scholar]
- Hayashi, K. , Morooka, N. , Yamamoto, Y. , Fujita, K. , Isono, K. , Choi, S. , et al (2006) Highly accurate genome sequences of Escherichia coli K‐12 strains MG1655 and W3110. Mol Syst Biol 2: 2006.0007. [DOI] [PMC free article] [PubMed] [Google Scholar]
- Hengge, R. (2009) Principles of cyclic‐di‐GMP signaling. Nat Rev Microbiol 7: 263–273. [DOI] [PubMed] [Google Scholar]
- Hengge, R. (2010) Role of c‐di‐GMP in the regulatory networks of Escherichia coli In The Second Messenger Cyclic‐di‐GMP. Wolfe A.J., and Visick K.L. (eds). Washington, DC: ASM Press, pp. 230–252. [Google Scholar]
- Hengge, R. (2011) The general stress response in Gram‐negative bacteria In Bacterial Stress Responses. Storz G., and Hengge R. (eds). Washington, DC: ASM Press, pp. 251–289. [Google Scholar]
- Hobley, L. , Ostrowski, A. , Rao, F.V. , Bromley, K.M. , Porter, M. , Prescott, A.R. , et al (2013) BslA is a self‐assembling bacterial hydrophobin that coats the Bacillus subtilis biofilm. Proc Natl Acad Sci U S A 110: 13600–13605. [DOI] [PMC free article] [PubMed] [Google Scholar]
- Hung, C.S. , Zhou, Y. , Pinkner, J.S. , Dodson, K.W. , Crowley, J.R. , Heuser, J. , et al (2013) Escherichia coli biofilms have an organized and complex extracellular matrix structure. mBio 4: e00645‐13. [DOI] [PMC free article] [PubMed] [Google Scholar]
- Irie, Y. , Starkey, M. , Edwards, A.N. , Wozniak, D.J. , Romeo, T. , and Parsek, M.R. (2010) Pseudomonas aeruginosa biofilm matrix polysaccharide Psl is regulated transcriptionally by RpoS and post‐transcriptionally b RsmA. Mol Microbiol 78: 158–172. [DOI] [PMC free article] [PubMed] [Google Scholar]
- Kempes, C.P. , Okegbe, C. , Mears‐Clarke, Z. , Follows, M.J. , and Dietrich, L.E. (2014) Morphological optimization for access to dual oxidants in biofilms. Proc Natl Acad Sci U S A 111: 208–213. [DOI] [PMC free article] [PubMed] [Google Scholar]
- Kobayashi, K. , and Iwano, M. (2012) BslA(YuaB) forms a hydrophobic layer on the surface of Bacillus subtilis biofilms. Mol Microbiol 85: 51–66. [DOI] [PubMed] [Google Scholar]
- Lange, R. , and Hengge‐Aronis, R. (1994) The cellular concentration of the σS subunit of RNA‐polymerase in Escherichia coli is controlled at the levels of transcription, translation and protein stability. Genes Dev 8: 1600–1612. [DOI] [PubMed] [Google Scholar]
- Lenz, A.P. , Williamson, K.S. , Pitts, B. , Stewart, P.S. , and Franklin, M.J. (2008) Localized gene expression in Pseudomonas aeruginosa biofilms. Appl Environ Microbiol 74: 4463–4471. [DOI] [PMC free article] [PubMed] [Google Scholar]
- Lindenberg, S. , Klauck, G. , Pesavento, C. , Klauck, E. , and Hengge, R. (2013) The EAL domain phosphodiesterase YciR acts as a trigger enzyme in a c‐di‐GMP signaling cascade in E. coli biofilm control. EMBO J 32: 2001–2014. [DOI] [PMC free article] [PubMed] [Google Scholar]
- Mika, F. , and Hengge, R. (2014) Small RNAs in the control of RpoS, CsgD and biofilm architecture of Escherichia coli . RNA Biol 11: 494–507. [DOI] [PMC free article] [PubMed] [Google Scholar]
- Miller, J.H. (1972) Experiments in molecular genetics. Cold Spring Harbor, NY: Cold Spring Harbor Laboratory. [Google Scholar]
- Okegbe, C. , Price‐Whelan, A. , and Dietrich, L.E. (2014) Redox‐driven regulation of microbial community morphogenesis. Curr Opin Microbiol 18: 39–45. [DOI] [PMC free article] [PubMed] [Google Scholar]
- Parsek, M.R. , and Tolker‐Nielsen, T. (2008) Pattern formation in Pseudomonas aeruginosa biofilms. Curr Opin Microbiol 11: 560–566. [DOI] [PubMed] [Google Scholar]
- Pérez‐Osorio, A.C. , Williamson, K.S. , and Franklin, M.J. (2010) Heterogeneous rpoS and rhlR mRNA levels and 16S rRNA/rDNA (rRNA gene) ratios within Pseudomonas aeruginosa biofilms, sampled by Laser Capture Microdissection. J Bacteriol 192: 2991–3000. [DOI] [PMC free article] [PubMed] [Google Scholar]
- Pesavento, C. , Becker, G. , Sommerfeldt, N. , Possling, A. , Tschowri, N. , Mehlis, A. , and Hengge, R. (2008) Inverse regulatory coordination of motility and curli‐mediated adhesion in Escherichia coli . Genes Dev 22: 2434–2446. [DOI] [PMC free article] [PubMed] [Google Scholar]
- Rani, S.A. , Pitts, B. , Beyenal, H. , Veluchamy, R.A. , Lewandowski, Z. , Davison, W.M. , et al (2007) Spatial patterns of DNA replication, protein synthesis, and oxygen concentration within bacterial biofilms reveal diverse physiological states. J Bacteriol 189: 4223–4233. [DOI] [PMC free article] [PubMed] [Google Scholar]
- Richter, A. , Povolotsky, T.L. , Wieler, L.H. , and Hengge, R. (2014) C‐di‐GMP signaling and biofilm‐related properties of the Shiga toxin‐producing German outbreak Escherichia coli O104:H4. EMBO Mol Med 6: 1622–1637. [DOI] [PMC free article] [PubMed] [Google Scholar]
- Romero, D. , Aguilar, C. , Losick, R. , and Kolter, R. (2010) Amyloid fibres provide structural integrity to Bacillus subtilis biofilms. Proc Natl Acad Sci U S A 107: 2230–2234. [DOI] [PMC free article] [PubMed] [Google Scholar]
- Römling, U. (2005) Characterization of the rdar morphotype, a multicellular behaviour in Enterobacteriaceae. Cell Mol Life Sci 62: 1234–1246. [DOI] [PMC free article] [PubMed] [Google Scholar]
- Serra, D.O. , and Hengge, R. (2014) Stress responses go three‐dimensional – the spatial order of physiological differentiation in bacterial macrocolony biofilms. Environ Microbiol 16: 1455–1471. [DOI] [PMC free article] [PubMed] [Google Scholar]
- Serra, D.O. , Richter, A.M. , and Hengge, R. (2013a) Cellulose as an architectural element in spatially structured Escherichia coli biofilms. J Bacteriol 195: 5540–5554. [DOI] [PMC free article] [PubMed] [Google Scholar]
- Serra, D.O. , Richter, A.M. , Klauck, G. , Mika, F. , and Hengge, R. (2013b) Microanatomy at cellular resolution and spatial order of physiological differentiation in a bacterial biofilm. mBio 4: e103–e113. [DOI] [PMC free article] [PubMed] [Google Scholar]
- Stewart, P.S. , and Franklin, M.J. (2008) Physiological heterogeneity in biofilms. Nat Rev Microbiol 6: 199–210. [DOI] [PubMed] [Google Scholar]
- Trejo, M. , Douarche, C. , Bailleux, V. , Poulard, C. , Mariot, S. , Regeard, C. , and Raspaud, E. (2013) Elasticity and wrinkled morphology of Bacillus subtilis pellicles. Proc Natl Acad Sci U S A 110: 2011–2016. [DOI] [PMC free article] [PubMed] [Google Scholar]
- Typas, A. , and Hengge, R. (2005) Differential ability of σS and σ70 of Escherichia coli to utilize promoters containing half or full UP‐element sites. Mol Microbiol 55: 250–260. [DOI] [PubMed] [Google Scholar]
- Typas, A. , Becker, G. , and Hengge, R. (2007) The molecular basis of selective promoter activation by the σS subunit of RNA polymerase. Mol Microbiol 63: 1296–1306. [DOI] [PubMed] [Google Scholar]
- Vlamakis, H. , Aguilar, C. , Losick, R. , and Kolter, R. (2008) Control of cell fate by the formation of an architecturally complex bacterial community. Genes Dev 22: 945–953. [DOI] [PMC free article] [PubMed] [Google Scholar]
- Vlamakis, H. , Chai, Y. , Beauregard, P. , Losick, R. , and Kolter, R. (2013) Sticking together: building a biofilm the Bacillus subtilis way. Nat Rev Microbiol 11: 157–168. [DOI] [PMC free article] [PubMed] [Google Scholar]
- Weber, H. , Pesavento, C. , Possling, A. , Tischendorf, G. , and Hengge, R. (2006) Cyclic‐di‐GMP‐mediated signaling within the σS network of Escherichia coli . Mol Microbiol 62: 1014–1034. [DOI] [PubMed] [Google Scholar]
- Wilking, J.N. , Zaburdaev, V. , De Volder, M. , Losick, R. , Brenner, M.P. , and Weitz, D.A. (2013) Liquid transport facilitated by channels in Bacillus subtilis biofilms. Proc Natl Acad Sci U S A 110: 848–852. [DOI] [PMC free article] [PubMed] [Google Scholar]
- Williamson, K.S. , Richards, L.A. , Perez‐Osorio, A.C. , Pitts, B. , McInnerney, K. , Stewart, P.S. , and Franklin, M.J. (2012) Heterogeneity in Pseudomonas aeruginosa biofilms includes expression of ribosome hibernation factors in the antibiotic‐tolerant subpopulaton and hypoxia‐induced stress response in the metabolically active population. J Bacteriol 194: 2062–2073. [DOI] [PMC free article] [PubMed] [Google Scholar]
- Zhang, T. , Pabst, B. , Klapper, I. , and Stewart, P.S. (2013) General theory for integrated analysis of growth, gene and protein expression in biofilms. PLoS ONE 8: e83626. [DOI] [PMC free article] [PubMed] [Google Scholar]
- Zogaj, X. , Nimtz, M. , Rohde, M. , Bokranz, W. , and Römling, U. (2001) The multicellular morphotypes of Salmonella typhimurium and Escherichia coli produce cellulose as the second component of the extracellular matrix. Mol Microbiol 39: 1452–1463. [DOI] [PubMed] [Google Scholar]
Associated Data
This section collects any data citations, data availability statements, or supplementary materials included in this article.
Supplementary Materials
Fig. S1. Patterns of SynP2‐driven GFP expression in vertical cryosections through macrocolonies of strains W3110 and AR3110 also carrying SynP2::csgD. Macrocolony biofilms of strains W3110 and AR3110 expressing the chromosomal copy of csgD from the SynP2 promoter and harbouring a low‐copy number vector containing the SynP2::gfp reporter fusion (pSynP2::gfp) were grown on salt‐free LB medium supplemented with ampicillin at 28°C.
A. Images show respective macrocolonies at day 3. The presence of the plasmid carrying SynP2::gfp did not alter the morphology of W3110 and AR3110 SynP2::csgD macrocolonies (compare with Fig. 2). These macrocolonies were cryo‐embedded and sectioned perpendicular to the plane of the macrocolony.
B. Thin macrocolony sections were visualized at low magnification with brightfield (top panels) and fluorescence (middle panels) and are also shown as merged images (bottom panels).
C. Enlarged views of GFP expression pattern in macrocolony areas boxed in red in respective fluorescence images presented in B.
Fig. S2. Floating off the integral upper layer of macrocolonies of strain AR3110 expressing CsgD under SynP2 control. Three‐day‐old AR3110 SynP2::csgD macrocolonies grown on salt‐free LB agar plates were gently overlaid with liquid medium (PBS). Immediately after that, the strongly self‐coherent upper layer of the macrocolonies detached and floated away. The image shows the entire upper macrocolony layer separated from the lower layer, which remained attached to the agar surface. The bottom layer consists of big chunks of matrix‐encased cells that give rise to the ‘pavement’ pattern observed in intact AR3110 SynP2::csgD macrocolonies (Fig. 2). Note that the flat areas of the upper layer are only approximately 60 μm thick and therefore appear translucent.