Abstract
Mass transport in multi-species porous media is through molecular diffusion and plume dynamics. Predicting the rate of mass transport has application in determining the efficiency of the storage and sequestration of carbon dioxide. We study a water and propylene–glycol system enclosed in a Hele-Shaw cell with variable permeability that represents a laboratory analogue of the general properties of porous media convection. The interface between the fluids, tracked using an optical shadowgraph technique, is used to determine the mass transport rate, the spatial separation of solutal plumes, and the velocity and width characteristics of those plumes. One finds that the plume dynamics are closely related to the mass transport rate.
This article is part of the themed issue ‘Energy and the subsurface’.
Keywords: porous media, convection, plume dynamics
1. Introduction
The transport of variable density fluids in a porous medium is an important aspect of understanding and predicting the convective mixing of CO2 sequestered in deep saline aquifers [1]. When CO2 is injected into such aquifers, its lower density relative to the brine solution causes it to rise until it is trapped by cap rock structures. In this state, the CO2 may escape back to the surface and defeat the purpose of the sequestration process. Diffusion of CO2 into the brine would eventually yield a stable situation but molecular diffusion alone is prohibitively slow, so one needs to consider other processes. Gravitationally driven convection is possible because the density of the brine increases as CO2 is incorporated across the fluid interface; CO2 is partially immiscible with respect to the brine. We consider here an analogue system that displays some of the same features of CO2 sequestration without many of the complications of the real system.
The hydrodynamic instability of two-phase porous media convection is similar to the thickening and instability of thermal layers in thermal convection [2], although in that case the flow rapidly becomes fully nonlinear whereas the porous media allow for a simpler formulation. Analytic calculations and numerical simulations have been performed [3–10] to evaluate the time to instability and the resulting mass transport efficiency. Laboratory experiments, however, have not been able to capture the main features of instability and mass transfer in realistic high-pressure supercritical CO2 brine systems. Thus, researchers have explored analogue experiments that capture the main features of buoyancy-driven porous media convection [11–15]. Here, we describe details of our analogue approach [13] and concentrate on properties of our system rather than upon justifying the analogy or reviewing other work in this area (see, for example, [16] for an analysis of the limitations of this analogy). Of particular interest in this short report is the theoretical and experimental analysis of Hele-Shaw flows [10,15].
In our earlier work [13], we used the fluid height H as the natural length scale in the problem. Another choice is to use the advection–diffusion balance length scale [10,15], L=D/U, where the free fall velocity is given by U=g(Δρ/ρ)K/ν with acceleration of gravity g, fractional density difference between the two fluids Δρ/ρ, porous media permeability K, fluid mass diffusivity D and fluid viscosity ν (the porosity is 1 for Hele-Shaw flow). Using L as the scale of length, one obtains time scale τL=L/U=D/U2. Alternatively, using H for length, one has τc=H/U. The time scales are related: τL=(L/H)τc. As discussed in [10,15], the Rayleigh number Ra=g(Δρ/ρ)KH/(Dν) only becomes important when the plumes reach the bottom, and during the time interval of study mass flux is predicted to be independent of Ra in the ideal two-dimensional limit. We will discuss aspects of these ideas in the context of our velocity and mass transport measurements.
2. Experiment
The experimental apparatus is a Hele-Shaw cell (figure 1a) made from two 1.2 cm thick polycarbonate sheets separated by stainless steel shims of thickness b. The lateral dimension of the fluid region is 7.6 cm and the initial height H of the bottom fluid region ranges from 1.2 to 5 cm. The flow in the gap satisfies, to first approximation, Darcy’s Law with an isotropic permeability K=b2/12 and a porosity of 1. For our experiments, the values 0.25<b<0.48 mm yield permeabilities in the range 0.54×10⁻⁴≤K≤1.94×10⁻⁴ cm2 (5000–20 000 Darcy). Water with density ρw=1.000 g cm−3 fills the top section of the cell and is initially separated from the lower section fluid, propylene glycol (PPG), with density ρppg=1.035 g cm−3,1 by two thin metal shims of thickness less than 0.1 mm. A 0.0076 cm thick shutter shim is then removed horizontally from between the two fluids, leaving behind the 0.01 cm thick frame shim to ensure a liquid-tight seal. The shutter shim is removed so as to minimize disturbances of the interface, but occasionally perturbations were observed. These small effects did not influence the flow appreciably for the types of measurements presented here. The removal of the shutter shim opens up a 0.01 cm thick horizontal gap at the interface between the polycarbonate sheets of the upper and lower cells, i.e. at the initial miscible interface between the fluids. Our cell-filling method ensures that this pocket is occupied by water after the shim removal.2
Figure 1.
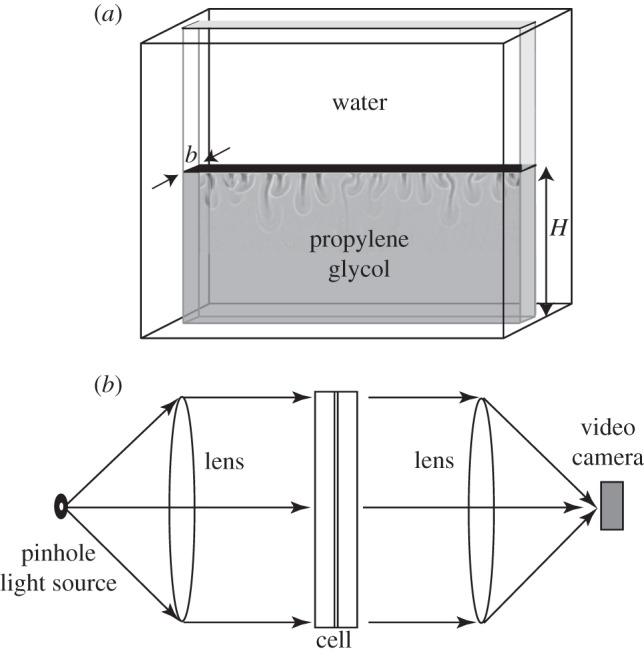
(a) Schematic of the Hele-Shaw convection apparatus with width b and height H indicated. The top fluid is water and the bottom fluid is propylene glycol. The two fluids are separated by a thin metal shim which is withdrawn horizontally to begin an experimental run. (b) A side view of the shadowgraph measurement is indicated schematically (not to scale). The sensitivity of the shadowgraph is adjusted by varying the distance from the fluid layer to the focusing lens.
As the fluids mix, the resultant mixture, for water mass fraction x between 0% and 50%, has the property of becoming heavier than the pure PPG fluid, i.e. ρx≥ρppg. After a period of molecular diffusion, the interface becomes gravitationally unstable and solutal plumes are formed. In contrast to a CO2/brine system, the viscosity and mass diffusivity of the water/PPG system are highly dependent on concentration. When computing experimental parameters or making comparisons with calculations or simulations, we use the transport properties of a 30% water/70% PPG mixture, i.e. ν=0.1 cm2 s−1 and (see footnote 1) D=1×10⁻⁶ cm2 s−1 (estimated using data from [17]), which corresponds to the mixture of maximum density ρ=1.044 g cm−3 or the maximum density difference of Δρ=0.009 g cm−3 relative to the underlying PPG.
The flow is visualized using an optical shadowgraph technique (figure 1b) in which the curvature (second derivative) of the index of refraction (proportional to the mixture concentration) of the inhomogeneous fluid mixture causes concentration (brighter) or dispersion (darker) in the optical signal. Although the shadowgraph technique can be made quantitative, here we use it as a qualitative visualization tool. The images resolve an area of lateral size W=3.0 cm and height 2.4 cm with resolutions of 1280×1024 pixels in the horizontal and vertical directions, respectively. Approximately 2000 frames are gathered during each run with a camera frame rate that depends on K: runs at the highest and lowest permeability last 2.5 h and 10 h, respectively. After an initial period in which PPG preferentially diffuses into the water owing to an asymmetric dependence of D(x) [17] (D is larger for PPG diffusing into water than for water diffusing into PPG), the diffusion layer thickens, the influence of buoyancy overcomes lateral diffusion, and hydrodynamic instability occurs as small perturbations in the dense diffusive interface grow into downward moving plumes. Figure 2 shows this evolution of a typical experimental run at various times after initiation. The dashed line and box in figure 2c show the horizontal line used to create a space–time plot of the plume dynamics and the region used to zoom in on the motion of a single well-defined plume, respectively.
Figure 2.
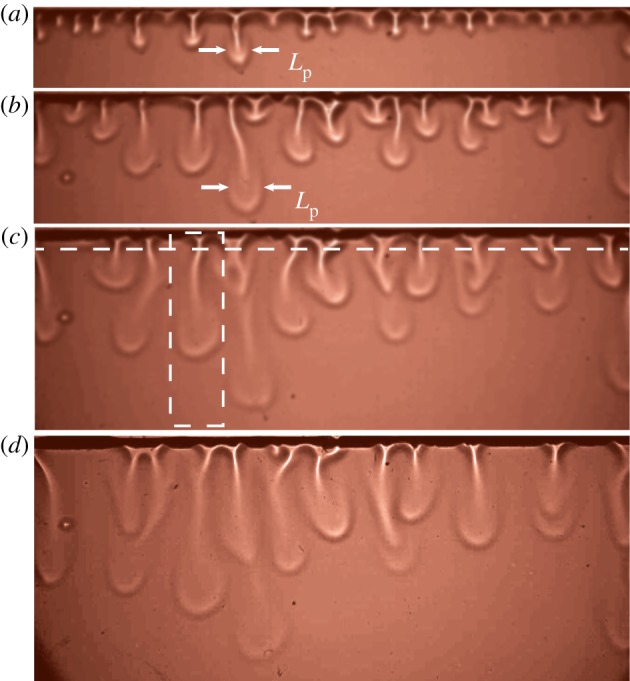
Shadowgraph images (false colour) for t/τc: (a) 1.0, (b) 2.0, (c) 3.0 and (d) 4.0. Conditions: U=0.0046 cm s−1, L=2.2×10⁻⁴ cm= 2.2 μm, H=2.54 cm, τc=550 s, τL=0.043 s and Ra=11 700. Plume width Lp is indicated in (a,b). Dashed line in (c) indicates the line for creating the space–time plot. Dashed box in (c) indicates the approximate area for illustrating single plume evolution. (Online version in colour.)
3. Plume characteristics
The characteristics of the 15 experimental runs are tabulated in table 1. There are three runs for each value of the gap thickness b, which ranges from 0.0254 to 0.0483 cm. The gap b sets the permeability 0.54×10⁻⁴<K<1.94×10⁻⁴ cm2, the convective velocity U, the length scale L, and the time scale τL, whereas Ra and τc depend on both b and H. We report the velocity of plumes in terms of the scaled velocity  .
.
Table 1.
Tabulated data for different experimental runs. Gap thickness b, permeability K, bottom fluid height H, convective velocity U, length scale L, convective time τc, advection–diffusion time τL, Rayleigh number Ra, and average scaled velocity  . Units are indicated.
| b (cm) | K (10−4 cm2) | H (cm) | U (cm s−1) | L (μm) | τc (s) | τL (s) | Ra |  |
|---|---|---|---|---|---|---|---|---|
| 0.0254 | 0.54 | 5.08 | 0.0046 | 2.2 | 1100 | 0.043 | 23 400 | 0.059 |
| 0.0254 | 2.54 | 550 | 11 700 | 0.054 | ||||
| 0.0254 | 1.27 | 275 | 5800 | 0.081 | ||||
| 0.0305 | 0.77 | 5.08 | 0.0066 | 1.5 | 770 | 0.023 | 33 300 | no data |
| 0.0305 | 2.54 | 385 | 16 700 | 0.040 | ||||
| 0.0305 | 1.27 | 193 | 8300 | 0.058 | ||||
| 0.0356 | 1.05 | 5.08 | 0.0089 | 1.1 | 571 | 0.012 | 45 500 | 0.047 |
| 0.0356 | 2.54 | 286 | 23 400 | 0.059 | ||||
| 0.0356 | 1.27 | 143 | 11 700 | 0.054 | ||||
| 0.0406 | 1.38 | 5.08 | 0.0118 | 0.85 | 430 | 0.0072 | 59 700 | 0.026 |
| 0.0406 | 2.54 | 215 | 29 900 | 0.038 | ||||
| 0.0406 | 1.27 | 108 | 14 900 | 0.037 | ||||
| 0.0483 | 1.94 | 5.08 | 0.0165 | 0.61 | 308 | 0.0037 | 83 100 | 0.041 |
| 0.0483 | 2.54 | 154 | 41 550 | 0.037 | ||||
| 0.0483 | 1.27 | 77 | 20 800 | 0.072 |
The properties of the solutal plumes that we address here are the lateral plume spacing, the evolution of plume width and the vertical convective velocity. A useful representation of the data are a space–time plot of the dynamics through a horizontal line parallel (figure 2c) to the initial interface as shown in figure 3a. Time increases upwards and is measured in t/τc (left) or t/τL (right) increasing upwards, and lateral distance is scaled by H (bottom) or L (top). There are initially a larger number of plumes Np in the horizontal frame L but the plumes coarsen through merger of nearby plumes [9,10,13,15] before reaching a steady state where the coarsening is balanced by the creation of new plumes at the wider, relatively unperturbed sections of the moving interface. The merger of plumes is shown in figure 3a as space–time dislocations—two lines become one. In figure 3b, the number of plumes at the interface Np is shown as a function of scaled time with time increasing upwards. Owing to coarsening that occurs between the interface and the line defining the space–time evolution, the number in the space–time plot is less than Np.
Figure 3.
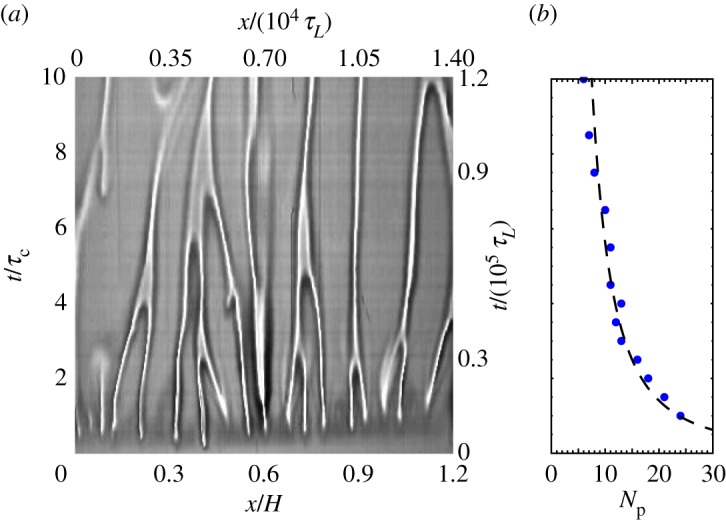
(a) Space–time plot with vertical axis t/τc (left) or t/(105τL) (right) and horizontal axis x/H (bottom) or t/(104τL) (top). Conditions as in figure 2. (b) Time evolution of the number of plumes Np at the fluid interface. (Online version in colour.)
The vertical plume velocity is determined from video images as the vertical displacement of the plume tip as illustrated in figure 4. The velocity is fairly constant for an individual plume that does not merge, although typically the plume slows as it spreads out. We show some typical trajectories in figure 5 for a single experimental run (same conditions as in figure 2). The first one starts as plumes begin to form, whereas the later ones experience more complex conditions involving plume merger and renucleation (the formation of new plumes in undisturbed sections of the interface). The variety of conditions into which the plumes propagate and the effects of plume interactions suggest the origins of the significant spread in plume velocities.
Figure 4.
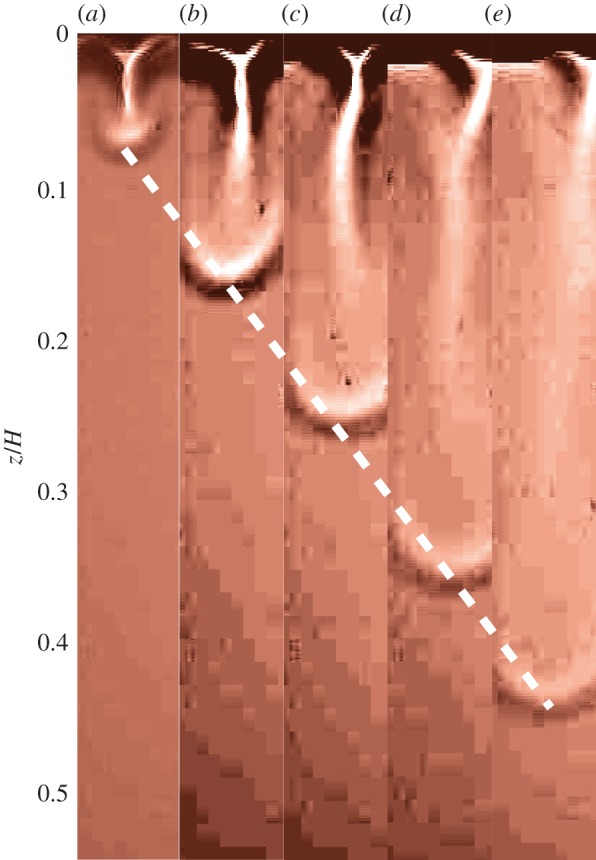
Shadowgraph images (false colour) for t/τc: (a) 1.0, (b) 2.0, (c) 3.0, (d) 4.0 and (e) 5.0. Conditions as for figure 2. Vertical axis is the distance from the initial interface position in units z/H. Dashed line indicates the uniform velocity propagation of a plume as defined by its furthermost position from the initial interface. The first plume encounters undisturbed conditions, whereas the later ones encounter plume interactions and plume renucleation phenomena. (Online version in colour.)
Figure 5.
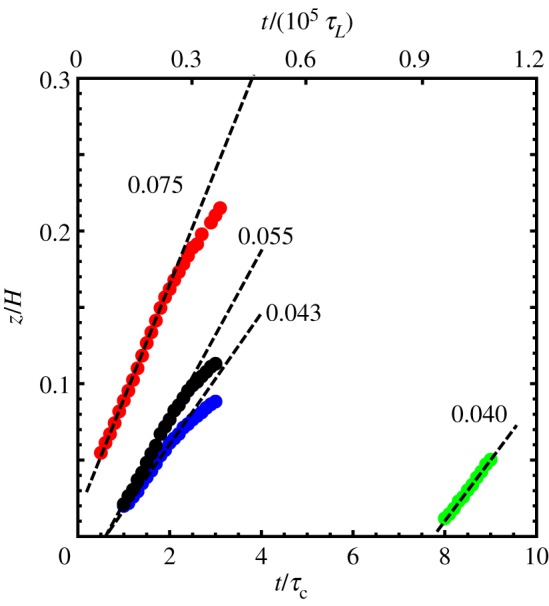
The vertical position z/H versus t/τc (bottom axis) or t/τL (top axis) for four different plumes in the same run at different times—conditions as for figure 2. The labelled dashed lines indicate constant velocity where the values of  are indicated. At depths of order z/H∼0.1, the plumes slow slightly as they spread out. (Online version in colour.)
One final characteristic of the plume dynamics is the plume width Lp as a function of propagation time shown in figure 6. Choosing an initially large plume for conditions with (b=0.028 cm and Ra=11 700), we plot the scaled plume width Lp/λc (λc is the early time pattern wavelength and the width is the full-width half-maximum of the plume profile) versus t/τc (bottom axis) and t/τL (top axis). There is some uncertainty in this measurement owing to nonlinear distortions in the shadowgraph measurements but the transition to more rapidly widening plumes is associated with the formation of the mushroom-shaped plume head arising from the shear with the slowly upwelling fluid.
Figure 6.
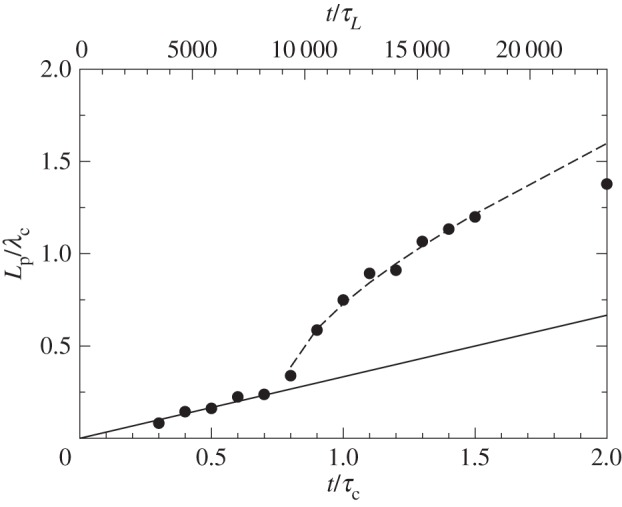
The scaled plume width Lp/λc versus scaled time t/τc (bottom axis) and t/τL (top axis). The solid line is a linear fit at short times t/τL<9000 (t/τc<0.75) and the dashed line is a combined linear (from short times) and square root fit for t/τL>9000 (t/τc>0.75).
(a). Wavelength and coarsening
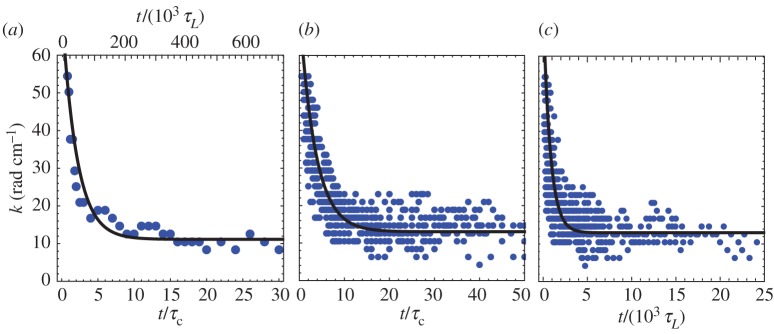
The plumes coarsen as they grow downwards through the process of merger. This leads to a smaller number of plumes at a later time. Eventually, new plumes are created, which leads to an approximately steady number of plumes per lateral distance. We first consider the wavenumber k(t)=2πNp(t)/W for a single experimental run in figure 7a versus scaled times t/τc (bottom) and t/τL (top) where there is an initial rapid decrease followed by a gradual equilibration. The total number at long time is Np≈6 (k≈12) with fluctuations of ±1, i.e. of order 10%. The evolution of k is complicated with various regions of behaviour such that a single function is unlikely to capture the dynamics. Nevertheless, an exponential function captures the general trend: k=11+60 e−(t/τc)/2.0 (the corresponding characteristic time when scaling by τL is about 64 000). When all the different runs are concatenated together (figure 7b), one obtains a similar result with an overall trend consistent with k=13+60 e−(t/τc)/3.5. Thus, the overall coarsening process seems to be consistent with a characteristic coarsening time of about 2.7 τc with little dependence on H (and thereby on Ra). If one collapses the curves by scaling with τL as in figure 7c, one gets better collapse (less lateral spread) at early times t/τL<10 000 but larger variation at intermediate times 10 000<t/τL<800 000. This is consistent with the idea that the flow does not feel the bottom for early times, of order 20 τc (time for a plume to reach the bottom is  —see below).
Figure 7.
Plume wavenumber k versus scaled time. (a) Single experimental run (b= 0.0254 cm, Ra=23 400); solid line is 11+60 e−t/(2.0τc). Bottom axis is scaled t/τc and top axis is scaled t/(103 τL). (b) All runs using scaled t/τc. Solid line is 13+60 e−t/(3.5τc). (c) All runs using scaled t/τL; solid line is 13+60 e−t/(8×104τL). (Online version in colour.)
(b). Velocity statistics
Individual plume velocities are obtained from the images of the evolving plume dynamics as illustrated in figure 2. An emphasis is on plumes that are well separated from others and on early times although a fraction are for conditions where strong mergers and renucleation phenomena occur. For each experimental run, the average of about 50 plumes was measured (there was only one run per set of experimental conditions). Several examples are shown in figure 4 with scaled displacements (units of H) versus scaled time t/τc. We present the velocity scaled by U,  . One has a roughly constant slope for a time interval of order τc, after which plumes tend to slow slightly. The mean velocity
  is weakly dependent on Ra number as shown in figure 8, following 1.2Ra−0.33, and the standard deviation
  has the same dependence on Ra but with a smaller constant coefficient 0.45Ra−0.33. In other words, one has
  .
.
Figure 8.
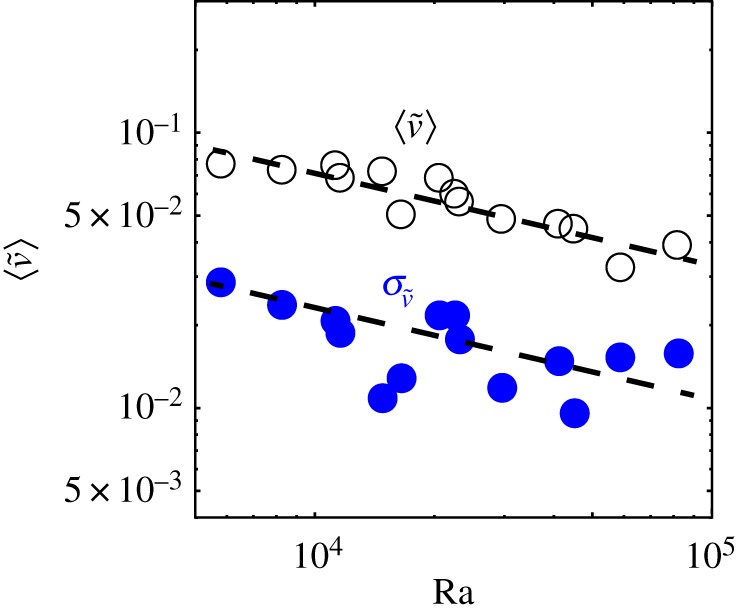
Plume velocity: mean  and standard deviation
  versus Ra. Dashed lines are 1.2Ra−0.33 and 0.45Ra−0.33 for mean and standard deviation. (Online version in colour.)
If one computes the probability distribution function (PDF), where one subtracts the mean and divides by the standard deviation, i.e.  , one obtains the PDF for all the data as presented in figure 9, which has Gaussian form and unit width. There is possibly a bit of negative skewness to the distribution, indicating an enhanced tendency for the plumes to slow down as in figure 5. The mean value of the plume velocity is roughly consistent with the numerical simulation value for two-dimensional porous media solutal convection at a rigid horizontal interface of 0.1 [10] although our values are somewhat less, in the range
  .
.
Figure 9.
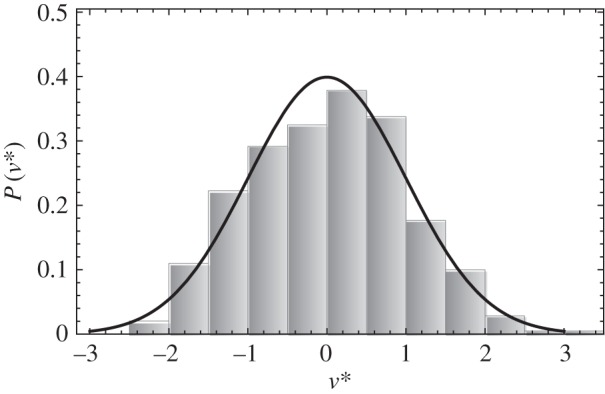
Probability distribution P(v*). Solid curve is Gaussian with zero mean and unit standard deviation.
4. Mass transport
The plume dynamics evolve to produce a steady-state mass flux across the two-fluid interface in which the action of the plumes scours the interface keeping it, on average, of uniform thickness. Relative to the standard conditions of Rayleigh–Bénard convection where there is a fixed horizontal boundary, the boundary conditions for either a miscible or immiscible interface allow the interface to distort. This distortion results in enhanced mass transport relative to a flat interface [9,16]. The steady flux regime represents the balance of plume transport and merger with the nucleation of new plumes in the boundary-layer regime between major plumes [9,10,13,15]. From numerical simulations [10], one gets a constant dimensionless mass transport of Sh=0.017 (note that the Nusselt number, the ratio of the mass flux to the steady state, i.e. linear profile, diffusive mass flux across a height H is related to Sh by Nu=Sh Ra), whereas the results for our PPG/water system show a weak Ra dependence: 0.045Ra−0.24. For Ra=104, one has Sh=0.0045 and a total range 0.003<Sh<0.006. The correspondence between the mass transport and the average plume velocity is shown in figure 10. The dependence on Ra is about the same with  . The variation with Ra is approximately Ra0.25 (the difference between the −1/3 power for the mean velocity and the −1/4 power for Sh is within the uncertainty of the data). From the perspective of CO2 sequestration, mass transport in miscible interfaces with non-monotonic density dependence for the water/PPG may be slightly less than for the partially miscible CO2 system [16].
Figure 10.
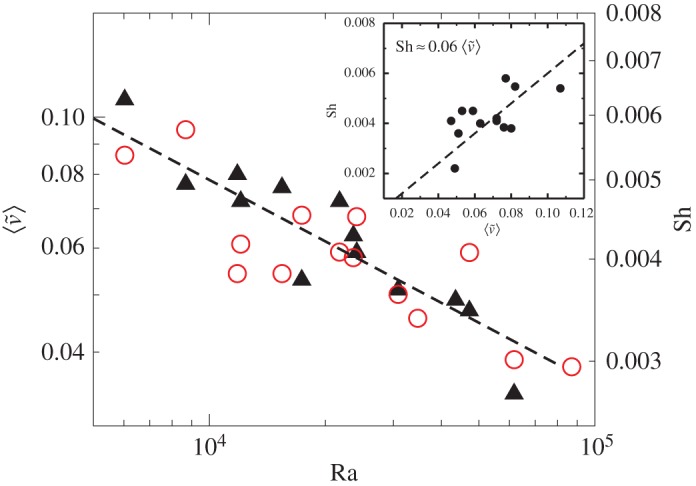
 (left axis, solid triangles) and Sh (right axis, open circles) versus Ra. Dashed line is 0.05Ra−0.25 consistent with the Sh data. Inset shows Sh versus
  . (Online version in colour.)
5. Conclusion
The analogue system of porous media using PPG and water [13] yields a simple system to quantitatively probe properties of mass transport resulting from solutal plumes. Using shadowgraph imaging, we have characterized the plume dynamics and mass transport of single interface solutal convection. In particular, the rapid decrease and approach to a steady state of the pattern wavenumber k is collapsed well using either τc or τL to scale time although the latter is slightly better at earlier times. The measured plume velocities are consistent with the mass transport measurements with the variability of plume velocities arising primarily from the merger and renucleation process. Both the mass transport and plume velocity data show a weak Ra dependence. These results are slightly different from the strictly two-dimensional simulations [10], perhaps pointing to quantitative issues such as the miscible versus partially immiscible interface or the horizontal versus deformable interface [16]. A further difference may arise from the larger impact of Taylor dispersion, which is not negligible for our set-up (see discussion in [15]).
Nevertheless, these analogue systems have proved useful in visualizing plume dynamics and in stimulating more quantitative simulations and better understanding of the limitations of such approaches to the CO2/brine mixing that underpins attempts at sequestering large quantities of CO2. The real system is, of course, three-dimensional and measurements of the three-dimensional version of these results will be presented elsewhere.
Acknowledgements
We acknowledge useful conversations with C. Doering.
Footnotes
Density and dynamic viscosity data for PPG are taken from the manufacturer’s data (http://dow-answer.custhelp.com/).
The addenda shim volume produces a delay in the motion of the interface estimated to be of the order of several τc.
Authors' contributions
S.B. designed the study and carried out the experiments. R.E.E. performed the data analysis and drafted the manuscript. Both authors read and approved the manuscript.
Competing interests
The authors declare that they have no competing interests.
Funding
This work was carried out under the auspices of the National Nuclear Security Administration of the US Department of Energy at Los Alamos National Laboratory under contract no. DE-AC52-06NA25396.
References
- 1.Metz D, Davidson O, de Coninck H, Loos M, Meyer L. 2005. IPCC special report on carbon dioxide capture and storage, ch. 5. New York, NY: Cambridge University Press; (Prepared by Working Group III of the Intergovernmental Panel on Climate Change.) [Google Scholar]
- 2.Foster TD. 1965. Stability of a homogeneous fluid cooled uniformly from above. Phys. Fluids 8, 1249–1257. ( 10.1063/1.1761393) [DOI] [Google Scholar]
- 3.Ennis-King J, Preston I, Paterson L. 2005. Onset of convection in anisotropic porous media subject to a rapid change in boundary conditions. Phys. Fluids 17, 084107 ( 10.1063/1.2033911) [DOI] [Google Scholar]
- 4.Xu X, Chen S, Zhang D. 2006. Convective stability analysis of the long-term storage of carbon dioxide in deep saline aquifers. Adv. Water Resour. 29, 397–407. ( 10.1016/j.advwatres.2005.05.008) [DOI] [Google Scholar]
- 5.Riaz A, Hesse M, Tchelepi HA, Orr FM. 2006. Onset of convection in a gravitationally unstable diffusive boundary layer in porous media. J. Fluid Mech. 548, 87–111. ( 10.1017/S0022112005007494) [DOI] [Google Scholar]
- 6.Ennis-King J, Paterson L. 2007. Coupling of geochemical reactions and convective mixing in the long-term geological storage of carbon dioxide. Int. J. Greenhouse Gas Control 1, 86–93. ( 10.1016/S1750-5836(07)00034-5) [DOI] [Google Scholar]
- 7.Rapaka S, Chen S, Pawar RJ, Stauffer PH, Zhang D. 2008. Non-modal growth of perturbations in density-driven convection in porous media. J. Fluid Mech. 609, 285–303. ( 10.1017/S0022112008002607) [DOI] [Google Scholar]
- 8.Rapaka S, Pawar RJ, Stauffer PH, Zhang D, Chen S. 2009. Onset of convection over a transient base-state in anisotropic and layered porous media. J. Fluid Mech. 641, 227–244. ( 10.1017/S0022112009991479) [DOI] [Google Scholar]
- 9.Hewitt DR, Neufeld JA, Lister JR. 2013. Convective shutdown in a porous medium at high Rayleigh number. J. Fluid Mech. 719, 551–586. ( 10.1017/jfm.2013.23) [DOI] [Google Scholar]
- 10.Slim AC. 2014. Solutal-convection regimes in a two-dimensional porous medium. J. Fluid Mech. 741, 461–491. ( 10.1017/jfm.2013.673) [DOI] [Google Scholar]
- 11.Backhaus S. 2010. Laboratory measurements of large-scale carbon sequestration flows in saline reservoirs. In Ninth Annual Conf. on Carbon Capture and Sequestration, Pittsburgh, PA, 10–13 May 2010. Washington, DC, USA: Exchange Monitor Publications and Forums. [Google Scholar]
- 12.Neufeld JA, Hesse MA, Riaz A, Hallworth MA, Tchelepi HA, Huppert HE. 2004. Convective dissolution of carbon dioxide in saline aquifers. J. Fluid Mech. 500, 263–281. ( 10.1017/S0022112003007298) [DOI] [Google Scholar]
- 13.Backhaus S, Turitsyn K, Ecke RE. 2011. Convective instability and mass transport of diffusion layers in a Hele-Shaw geometry. Adv. Water Resour. 106, 104501 ( 10.1103/physrevlett.106.104501) [DOI] [PubMed] [Google Scholar]
- 14.Hidalgo J, Fe J, Cuetao-Felgueroso L, Juanes R. 2012. Scaling of convective mixing in porous media. Phys. Rev. Lett. 109, 264503 ( 10.1103/PhysRevLett.109.264503) [DOI] [PubMed] [Google Scholar]
- 15.Slim AC, Bandi MM, Miller JC, Mahadevan L. 2013. Dissolution-driven convection in a Hele-Shaw cell. Phys. Fluids 25, 024101 ( 10.1063/1.4790511) [DOI] [Google Scholar]
- 16.Raad SMJ, Hassanzadeh H. 2015. Onset of dissolution-driven instabilities in fluids with non monotonic density profile. Phys. Rev. E 92, 053023 ( 10.1103/PhysRevE.92.053023) [DOI] [PubMed] [Google Scholar]
- 17.Hubel A, Bidault N, Hammer B. 2002. Transport characteristics of glycerol and propylene glycol in an engineered dermal replacement. In Proc. ASME 2002 Int. Mechanical Engineering Congress and Exposition, New Orleans, LA, 17–22 November 2002, pp. 121–122. New York, NY: American Society of Mechanical Engineers.


