

Abstract
Despite the impact that hydraulic fracturing has had on the energy sector, the physical mechanisms that control its efficiency and environmental impacts remain poorly understood in part because the length scales involved range from nanometres to kilometres. We characterize flow and transport in shale formations across and between these scales using integrated computational, theoretical and experimental efforts/methods. At the field scale, we use discrete fracture network modelling to simulate production of a hydraulically fractured well from a fracture network that is based on the site characterization of a shale gas reservoir. At the core scale, we use triaxial fracture experiments and a finite-discrete element model to study dynamic fracture/crack propagation in low permeability shale. We use lattice Boltzmann pore-scale simulations and microfluidic experiments in both synthetic and shale rock micromodels to study pore-scale flow and transport phenomena, including multi-phase flow and fluids mixing. A mechanistic description and integration of these multiple scales is required for accurate predictions of production and the eventual optimization of hydrocarbon extraction from unconventional reservoirs. Finally, we discuss the potential of CO2 as an alternative working fluid, both in fracturing and re-stimulating activities, beyond its environmental advantages.
This article is part of the themed issue ‘Energy and the subsurface’.
Keywords: hydraulic fracturing, shale gas, subsurface flow and transport, discrete fracture network, lattice Boltzmann, microfluidics
1. Introduction
Hydraulic fracturing in combination with horizontal drilling has had a profound impact on the energy sector by providing access to hydrocarbons in low permeability (nanoDarcy–microDarcy) formations that were previously inaccessible. Despite being a widely deployed technology, current extraction efficiencies are low and can pose threats to the environment [1–3]. Recovery rates from hydraulic fracturing operations leave 70–80% of the estimated gas in place behind [4]. Increasing and sustaining production while decreasing environmental impacts depends on understanding the physical mechanisms that determine extraction. One of the reasons that hydraulic fracturing is poorly understood is because length scales from nanometres to kilometres are involved as hydrocarbon makes its way from nanometre-sized pores to millimetre cracks to large fractures (10–100 m) and eventually to the well [5,6].
Figure 1 shows a characteristic shale gas production curve. The key features of the curve are a high initial peak followed by a rapid decline that develops into sustained low level production. It has been hypothesized that different parts of the production curve are governed by different physical mechanisms [2,7]. However, there is no consensus of which physical mechanism controls which part of the curve. There is concurrence that fractures play a critical role in the production rate of wells [7–13], but beyond that little is firmly established. Although there are studies that focus on the tail of the production rate curve, the key processes that control long-term production remain a relative mystery. It is probably a combination of numerous mechanisms allowing migration of hydrocarbon into the primary fracture network that may include enhanced diffusion due to near-fracture damage zones, desorption of hydrocarbons from organics in the shale, microdamage and extended microfractures caused by over-pressurized pores in kerogen [14], microseismic activity induced by production pressure variations [13,15], slip flow due to Klinkenberg effects in nanometre sized pores [16,17], the continued evolution of rubbelization and matrix diffusion [9], and continued linkage to natural fractures during production [10,11].
Figure 1.
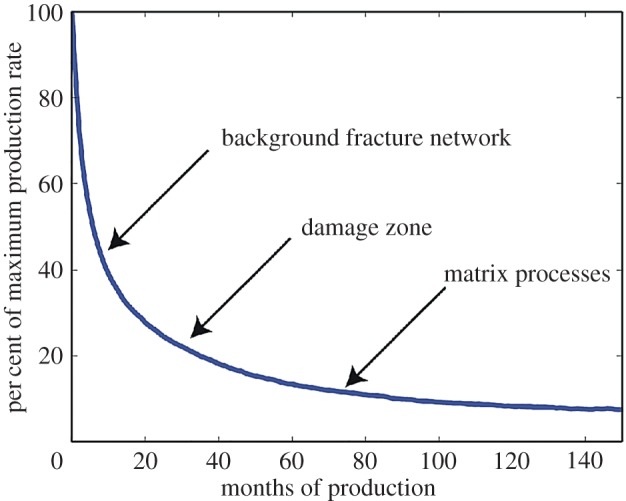
Hypothesized breakdown of physical mechanisms governing shale gas production. The key features of the curve are a high initial peak followed by a rapid decline that develops into a sustained low level of production. Plotted along with the curve are regimes corresponding to our hypothesis that different pieces of the production curve are governed by different length scales. At early times, large background fractures in the connected network full of gas are flushed, which leads to the rapid initial decline in production. Next, smaller damage zones around these natural fractures induced by hydraulic fracturing increase surface area with the matrix and sustain production for intermediate times. Matrix processes, such as diffusion and desorption, contribute to and control late production. (Online version in colour.)
Along with the curve shown in figure 1, we include arrows corresponding to our hypothesis that different pieces of the production curve are governed by different physical mechanisms at multiple length scales. At early times, large fractures in the connected network full of hydrocarbon are flushed out, which leads to the rapid initial decline in production. Next, smaller damage zones surrounding induced and natural fractures increase connectivity with the matrix and sustain production at intermediate times. Matrix processes, such as diffusion and desorption, contribute to and control late production.
To understand hydrocarbon release and transport mechanisms at these spatio-temporal scales, we have been developing experiments and models to characterize the key phenomena involved in fracking and subsequent production. As these processes take place kilometres underground, we have developed microfluidic and triaxial experiments that can be operated under high pressures, temperatures and stresses to mimic in situ reservoir conditions. We have developed lattice Boltzmann models to simulate pore-scale multi-phase flow and have benchmarked these models with the microfluidic experiments. A finite-discrete element fracture propagation model with a coupled fluid solver has been benchmarked against core-scale triaxial fracture experiments. At the field scale, we have developed a new reservoir simulation tool to predict hydrocarbon production using discrete fracture networks. We believe that a mechanistic description of these multiple scales is required to make accurate predictions and eventually optimize hydrocarbon extraction from these unconventional reservoirs. The tools we have developed can also be used to explore the use of CO2 as an alternative working fluid, as it exhibits highly favourable properties for extracting hydrocarbon (e.g. preventing flow blocking and exchanging with hydrocarbon adsorbed to organics in the shale), it may also be more effective fracturing the rock, as well as reducing the amount of water required while sequestering CO2 [1]. In this paper, we summarize our key experimental and modelling results at the field, core and pore scales as stages in a progression towards a fully integrated simulation of hydrocarbon production from hydraulic fracturing operations.
2. Field scale
The permeability of shale is so small, of the order of nanoDarcies, that flow and transport through the undisturbed matrix is too slow for feasible production. In such formations, fractures act as the principal pathway for flow and transport. One of the goals of hydraulic fracturing is to increase the connectivity and permeability of the reservoir rock (i.e. pre-existing fracture network) to a level where production is feasible. We hypothesize that production at early times is controlled by the initial flush of free hydrocarbon from the connected induced and natural fracture network (1 m to 1 km). In this section, we describe our modelling and data analysis efforts to address flow and transport through these larger fracture networks after the fracture generation stage is complete.
(a). Discrete fracture network modelling
There are a variety of models to simulate transport through interconnected networks of fractures, and we adopt the discrete fracture network (DFN) approach. In the DFN approach, geologic/geophysical field investigations are used as bases to stochastically generate networks of fractures where the geometry and properties of individual fractures are explicitly represented. Fractures in the network are assigned a shape, location, aperture and orientation based on the distributions determined through site characterization. Once the network is constructed, the individual fractures are meshed for computation and the flow equations are numerically integrated on the resulting computational mesh. In the DFN methodology, the matrix is considered impermeable and matrix–fracture interactions can be included into the model using analytical formulations such as transfer functions. Examples of the various DFN methodologies and their applications are found in [18–25]. In the following, we present two examples of field-scale studies we conducted on the fate of water and on characterizing the influence of large fractures on the production curve.
O’Malley et al. [26] used a DFN model along with statistical analysis to address a lingering mystery in shale gas extraction: where does the water go during hydraulic fracturing? Millions of cubic metres of water are injected into a typical shale hydraulic-fracturing site to reactivate existing natural fractures as well as create new ones. However, only 20–30% of this injected water is recovered, leading to concerns that the trapped fracking fluid may block production or escape the target reservoir. By incorporating site data into computational and theoretical models, the authors were able determine where it was most likely that water would be residing. They determined how much water could reside in fractures by computing the volume and surface area of a DFN based on a statistical analysis of a site characterization from the Pottsville formation (AL, USA). Additionally, two different methodologies (one using Darcy model and the other using a pore-scale force balance approach) were used to obtain high and low estimations of water uptake into the undamaged shale matrix. Their analysis showed for the fracture network considered that most of the missing water (≈90%) resides in the matrix with a lesser amount in the fractures (≈10%). Note that despite the low permeability of shale matrix, typically initially undersaturated in water at reservoir conditions [26], capillary forces play a major role in the water imbibition into the matrix.
Karra et al. [7] simulated hydrocarbon production in the DFN used by O’Malley et al. [26] using dfnWorks [27]. dfnWorks combines the feature rejection algorithm for meshing (fram) [28] (to generate three-dimensional fracture networks), the LaGriT [29] meshing toolbox (to create a computational mesh representation of the DFN in parallel), the massively parallel subsurface flow and reactive transport code pflotran [30] (to numerically integrate the governing flow equations), and an extension of the walkabout particle tracking method [31,32] (to determine pathlines through the DFN and simulate solute transport through the steady-state flow field). Karra et al. considered a single stage of a production well in a 200 m cube, and included a horizontal well along with six hydraulically generated fractures to increase connectivity with the background network. They simulated production by dropping the pressure in the well and tracked particles representing methane packets distributed throughout the DFN to the well, thereby obtaining a production curve. Figure 2a shows a realization of the DFN and figure 2b compares the production curve obtained using the simulation with actual production data. In figure 2a, the horizontal well is shown in green, the hydraulic fractures in brown and the background fractures are coloured by the steady-state pressure solution. Using multiple realizations a typical production curve was obtained for these DFN simulations. That curve is shown in blue compared with actual site data (red) for 12 wells in the Barnett shale formation whose average (thick red) represents a typical production curve. The actual production data were collected from the Texas RRC website [33]. The simulation, considering pure advection in the fracture network, matches the data well for 10–15 months of production, but underestimates the data at long term. This discrepancy between the model and the data at long times probably results from the exclusion of small-scale physical mechanisms such as diffusion and local damage zones from the simulation (figure 1). A first attempt to evaluate matrix diffusion effects at field scale was carried out using a range of diffusivity values (inset, figure 2b). However, the combination of pure advection in the fracture network and diffusion in the matrix did not provide the expected result, underestimating the tail of the production curve. This suggests that more complex mechanisms taking place in the fracture/matrix damage zone such as desorption and multi-phase flow blocking may need to be characterized and bounded for a truly predictive simulation of the production curve. Therefore, in the following sections, we discuss our experiment and modelling endeavours to characterize these small-scale physical mechanisms, which can be used to formulate and parametrize transfer functions for matrix–fracture interactions that will be used in future DFN simulations.
Figure 2.

(a) A discrete fracture network based on a geological characterization of a shale formation generated using dfnWorks [27]. A horizontal well (green cylinder) is included in the domain and hydraulic fractures (brown discs) increase connectivity of the well with the natural fracture network. The background fractures are coloured according to the steady-state pressure solution which is used to simulate transport. (b) Comparison of production curves. The blue line is the mean production curve of multiple DFN model runs and the thick red curve is the mean of the multiple well sites in the Barnett formation in TX, USA, shown in semi-transparent red. The advective model matches the initial decline in production but underestimates the tail because small-scale effects, such as damage zone and matrix diffusion, are not included in the model. Inset: production curves including matrix diffusion for different values of diffusivity [7].
3. Meso-scale
The next scale we consider is where fracturing is occurring in a representative volume of rock, i.e. fracture formation in a core of shale (1 mm to 10 cm). This scale is fundamental because it links micro-scale processes to large-scale responses. We hypothesize that this scale controls intermediate times of the production curve after the initial flush of the free gas in the fractures is complete but before longer time scales occurring at the pore scale are prominent. The local processes constitute a so-called damage zone that allows for the enhanced migration of hydrocarbon and their incorporation into the DFN model should improve production calculations. Advanced triaxial experiments and a combined finite-discrete element method (FDEM) numerical tool, as well as the comparison between experiments and simulations, are presented in this section.
(a). Triaxial experiments
Triaxial-coreflood and direct-shear experiments have been used to investigate the permeability of fractured rocks as relevant to oil and gas production and subsurface fluid containment (e.g. CO2 sequestration and nuclear waste storage) [34–39]. In most of these studies, fractured samples are created synthetically (e.g. saw-cut or unconfined splitting) or are naturally fractured samples that are re-assembled or recovered and studied in the laboratory at subsurface conditions. Although very useful, these fractures may not be representative of those formed at in situ, high-stress conditions nor has their formation been successfully imaged. Recently, we have developed a custom triaxial-coreflood apparatus that allows simultaneous neutron and X-ray imaging at high pressure and temperature, and we have used this device to fracture shale rock specimens while simultaneously acquiring permeability measurements, X-ray radiographs (video) and complete X-ray tomograms. The triaxial device has been used to create conventional triaxial-compression fractures [40], direct-shear fractures [41] and hydraulic fractures (with proppant) [42] using newly developed methods all at high-stress conditions (up to 35 MPa confinement). Two different sets of experiments are presented in this section. In the first, we describe direct-shear fracturing of shale samples combined with in situ X-ray micro-tomography and permeability measurement. These represent the permeability of the natural fracture system. The second consists of hydraulic fracturing experiments conducted in a triaxial coreflood system to evaluate fracture permeability and proppant placement under in situ conditions.
In triaxial direct-shear experiments, an axial load is applied to semicircular pistons that are offset to focus a shear fracture through the length of the sample (figure 3a). During the experiment, radial confining pressure is applied to mimic burial depth and water is injected at the base of the sample allowing continuous measurement of permeability. A comparison of direct-shear results from Frash et al. [43] and Carey et al. [41] conducted on Utica shale (OH/PA, USA) illustrates strongly contrasting behaviour between specimens deformed and fractured at high versus low confining stress. Experiments at high confining stress (σc) of 22.2 MPa were simultaneously monitored using in situ X-ray video and X-ray micro-tomography (figure 3a). In situ observations show that shale accommodates large relative displacement (more than 10%) along a central fracture system that develops during two distinct fracture events. However, the resulting permeability (κ) increase was observed to be small (7–15%) as measured under isotropic stress conditions (figure 3b). Subsequent lowering of the isotropic stress to 7 and then 4 MPa resulted in further, relatively small permeability increases. In order to explore the effect of re-stressing a fracture as done in studies of natural fractures (e.g. [34,38,39]), the specimen was returned to room conditions, removed and with minimal disturbance, re-inserted into the device. The re-stressed specimen permeability increased by about 10 times. When unstressed to 0 MPa, the fractures dilated significantly but preserved the same general fracture lineaments that were observed at higher confining stress. Thresholding revealed that the porosity (aperture of fractures) was minimal as long as applied stresses were maintained. When pressure was reapplied, larger porosities were observed. These results contrast strongly with experiments conducted at low confining pressure (3.4 MPa; figure 3b). In both sets of experiments, fractures were propagated in an optimal orientation of the bedding plane with respect to the direct-shear plane for maximum permeability [44]. The low confining stress experiments had permeability that was more than three orders of magnitude larger.
Figure 3.

(a) In situ X-ray video during a triaxial direct-shear experiment showing radiograms acquired before and after two major fracturing events at 22.2 MPa confining pressure [43]. The two fracture events occurred at 115 and 140 MPa axial shear stress. Diameter of samples 25 mm; resolution of the images about 25 μm. (b) Pre-fracture permeability (κ) was initially very low at 0.03 mD and did not increase significantly following fracturing at high stress (22.2 MPa) as measured under isotropic conditions. The permeability subsequently increased slightly as the isotropic stress was reduced to 7 and then 4 MPa. The sample was then reduced to 0 MPa (gage), removed from the device, re-inserted into the device and then re-stressed at 2, 4, 6 and 8 MPa isostatic stress. This resulted in a substantial jump in permeability, but was still much smaller than in specimens fractured at low confining pressure [41]. (c) In situ image of Utica shale specimen being subjected to triaxial hydraulic fracturing with piezoelectric crystals attached for acoustic (microseismic) monitoring. A diagram of the final fracture geometry (red) is included as traced from post-fracture ex situ X-ray micro-tomography. A notch (blue) was cut into the top to simulate a perforation and to permit storage of a tungsten carbide proppant–water mixture [42].
Frash et al. [42] developed a new, notched-specimen hydraulic fracturing method for use in conventional triaxial coreflood devices. The method uses a circular-segment notch and a gasket seal to apply high pore pressure in one end of a specimen while maintaining constant axial and confining stresses. Fracture initiation from the notch is directionally controlled and therefore well suited for instrumental monitoring, in this case using in situ X-ray video (figure 3c). A total of five specimens were hydraulically fractured using this method with differing notch dimensions, including three acrylic specimens, one shale and one cement. Proppant was included in the shale fracturing experiment as a proof-of-concept for the compatibility of proppant injection with this notched fracturing method (figure 3c). The resulting hydraulic fracture penetrated through the length of the specimen allowing in situ permeability measurements concurrent with the fracturing. In the experiment shown in figure 3c, proppant did not enter the newly created fracture and the permeability of the hydraulically fractured specimen was low (less than 0.1 mD) consistent with a necessary role of proppants in fracture stimulation. This method has applicability for the study of proppant transport, hydraulic fracture toughness, and hydraulic fracture permeability as a function of confining stresses.
The combined results of the triaxial experiments reveal the challenges and opportunities in managing fractures in shale. Permeability development in shale is a strong function of depth as deformation modes transition from brittle to ductile. Shale fractured in the ductile regime is unlikely to contribute significantly to permeability. As shown with Utica shale, this transition is not necessarily associated with great depth (less than 22 MPa confining pressure). Similarly, the permeability of hydraulic fractures without proppant was minimal, due to well-matched fracture surfaces allowing the fracture to close. In the context of shale gas development, the low permeability of ductile shale would appear to limit gas production in such rocks. In the case of shale as caprock, this is a distinct advantage that may significantly reduce leakage risk in applications such as CO2 sequestration. However, compositional heterogeneity expressed as fine-scale interbedding or larger-scale facies significantly complicates interpretation of brittle versus ductile behaviour. Some shale formations are likely to contain both brittle and ductile sub-units. The net behaviour of such systems is a subject of ongoing research.
(b). Finite-discrete element method: comparison with triaxial experiment
Carey et al. [41] compared FDEM numerical simulations to triaxial direct-shear experiments. The combined FDEM is a hybrid numerical tool that utilizes both finite-element based analysis of continua and discrete-element based transient dynamics, contact detection, contact interaction and fracture solutions. Within the FDEM framework, finite rotations and finite displacements are assumed a priori and are formulated using a multiplicative decomposition-based finite strain formulation. By means of material failure constitutive laws, single domains represented by separate finite element meshes can be transformed into a number of interacting domains, depending on the loads being applied to the solid. Contact between interacting domains follows similar principles to those adopted in the discrete element methodology. A major advantage of the FDEM method is that the finite element discretization of solid domains is also conveniently used to discretize the contacting domains. By utilizing this approach, discretized contact solutions can be used for both contact detection and contact interaction solvers. For the algorithmic solutions implemented on the FDEM software used for this work the reader is referred to [45–47]. FDEM has been widely used for modelling a number of fracture processes (e.g. [48–52]).
A total of sixteen 25×25 mm cylindrical specimens of Utica shale were fractured with simultaneous permeability measurements using a triaxial coreflood apparatus. Fracturing was induced using the triaxial direct-shear method described above. Experiments were conducted with bedding parallel and perpendicular to the axial load (figure 4a). Permeability was much higher in bedding-parallel experiments with a maximum permeability (900 mD) occurring in specimens with the bedding plane oriented near 45° from the direct-shear plane (θ in figure 4a). After fracturing, permeability was observed to decrease significantly when higher confining stresses were applied. Permeability was lower in specimens with bedding planes perpendicular to the axial load (30 mD). The development of through-going fractures in this case required significant deformation (more than 8% strain) that was accommodated in part by bedding-plane parallel displacements that also hindered fracture propagation.
Figure 4.

(a) Specimen configuration used in the triaxial direct-shear experiments. Semicircular, porous platens generate a direct-shear plane through the sample that can be oriented with respect to bedding or other features. The image illustrates a specimen orientation with bedding plane parallel to the axial load with an angle θ between the bedding and direct-shear planes. (b) FDEM calculation of shear stress (ts) inside the specimen that is non-uniform due to the direct-shear geometry. (c) An ex situ X-ray micro-tomography section (25 μm resolution) of a 25 mm tall, fractured specimen of Utica shale (OH/PA) using 3.5 MPa confining stress (σc) which resulted in a peak shear stress (tmax) of 30.6 MPa for fracturing. Bedding was oriented perpendicular to the axial load. The permeability (κ) of this specimen ranged from 3 to 30 mD with the highest permeability occurring just after fracturing. (d) Two-dimensional FDEM simulation of the experiment illustrated in (c). The calculated fracture pattern reproduces the two dominant fracture arcs observed in the experiment.
Detailed FDEM simulations were conducted of the experiment. These were used to calculate stress distribution, fracture patterns and the impact of boundary conditions on fracture geometry. In order to avoid the problem of volumetric locking, which is often encountered when using constant strain tetrahedral finite elements, Lei et al. [53] developed a 10-noded composite tetrahedral finite element composed of eight four-noded low order tetrahedrons. The method combines low order sub-elements into a composite higher order element with selective integration points. Using this formulation, only the information from the sub-elements is needed and volume locking is eliminated. Calculated shear stress (ts) inside the specimen was non-uniform due to the direct-shear geometry (figure 4b). Fracture patterns produced by triaxial direct shear were successfully simulated using two-dimensional FDEM modelling (figure 4c,d) on a system containing discrete beds separated by weak interlayers. The simulation reproduced the three primary fractures extending along the centre-line of the sample and in two curving arcs extending from the shear-platen corners. The simulation also reproduced the experimentally observed dense fracture network present near the platens as well as some of the bedding-plane parallel displacements. The simulation results were sensitive to boundary conditions including injection pressure and the pressure drop across the core.
4. Micro-scale
To study the relative importance of pore-scale and matrix processes, a downscaling in observations is necessary. These small scale processes, due to the low matrix permeability are likely to be relevant for sustained long-term production. Here, we present two approaches, one experimental (microfluidics) and other numerical (lattice Boltzmann), to identify and quantify the micro-scale processes (10 nm to 1 mm). Although their implementation in large-scale methods, i.e. upscaling, is not trivial, we hypothesize their relevance at large scale due to their potential long-term impacts on production.
(a). Microfluidics experiments
Although subsurface energy operations are largely viewed as reservoir-scale problems, the underlying fluid flow and transport processes occur within the rock nanometre- (e.g. rock matrix) to millimetre-sized pores and fractures. Experimental microfluidic investigations provide real-time dynamics of flow and transport that allow for the study of the relative importance of pore-scale and matrix processes on the production curve. Microfluidic methods enable a fine control of hydrodynamic and chemical conditions in small confined environments over a range of scales down to micrometres. This visualization technique has been used to study flow and transport in continuous [54,55] and discontinuous, i.e. porous media [56,57], systems. However, the majority of experimental systems to date are limited in applicability due to ambient operating conditions and/or the use of idealized engineered material micromodels (e.g. glass, plastic and silicon). Conventionally, these micromodels contain arrays of cylinders or straight channels, having higher porosity values and different wetting properties from those encountered in the subsurface. These controlled experiments have been successful in identifying critical pore-scale flow and transport mechanisms [58,59].
We have developed a high pressure and temperature microfluidic experimental system that allows for direct observations of flow and transport within engineered and geo-material micromodels (e.g. shale, cement) at reservoir conditions to mimic subsurface conditions within the laboratory. Details of the experimental system are provided in Porter et al. [60]. Our novel micromodel fabrication method for geo-materials also works for engineered materials and provides flexibility for comparison between different materials with the same geometries. We utilized three-dimensional tomography images of real fractures taken from the shear fracture experiments of Carey et al. [41] as micromodel templates to better represent the pore space and fracture geometries expected in subsurface formations. The pore and fracture patterns/features are etched into the micromodel using a laser [60]. Here, we present two experiments that highlight the advantages of working at geologically relevant pressures and temperatures using engineered and geo-material micromodels to study mechanisms such as multi-phase flow and fluids mixing.
Jiménez-Martínez et al. [58] analyse the use of supercritical (sc) CO2 as an alternative to water for hydraulic fracturing and re-stimulation operations using our microfluidic capabilities. Pore-scale fluid displacement and mixing mechanisms were investigated in a three-phase system (oil–brine–scCO2) at reservoir conditions (8.3 MPa and 45°C) (figure 5a). They used a two-dimensional silicon micromodel consisting of a monolayer of cylindrical grains representing a porous medium that is analogous to an oil-wet reservoir rock (e.g. shale). The relatively simple geometry helps to identify the mixing process and mechanisms in the already complex three-phase system. It is known that the high miscibility of scCO2 with hydrocarbons can enhance production. However, the presence of brine, natural or injected, makes the system highly complex, because it can block the displacement of hydrocarbons [26]. The injection of scCO2 in an oil–brine saturated porous medium results in a dynamic system due to the immiscible oil–brine pair interacting with the low-miscible scCO2–brine (3–5% soluble) and the miscible scCO2–oil (74% soluble). The displacement of the immiscible brine introduces spatio-temporal variability in the heterogeneity of the system, i.e. in the flow field, enhancing mixing between oil and scCO2 and subsequently increasing recovery. For detailed descriptions of the local mechanisms that enhance mixing and recovery, the reader is referred to Jiménez-Martínez et al. [58].
Figure 5.

(a) Supercritical (sc) CO2 normalized concentration field c(x,t) obtained during scCO2 injection into an initially oil–brine saturated silicon micromodel. scCO2 (white) displacing oil (n-decane, black) and brine (blue) at reservoir conditions (8.3 MPa and 45°C). The oil-wet micromodel dimensions are L×W=15.93 mm×18 mm, with thickness h=140 μm. The mean grain diameter d=130 μm, the average pore throat r= 65 μm and the average pore size λ=130 μm. There are ∼ 16 800 grains in total. The porosity and absolute permeability are ϕ=0.59 and κ=2.59×10⁻⁴ mm2 (26 243 Darcy). scCO2 is injected at constant flow rate Q=0.166 mm3 s−1. The heterogeneity or disorder introduced by the aqueous phase (brine) along with viscous fingering enhance mixing between scCO2 and oil [58]. (b) Water imbibition into the shale matrix from four parallel fractures with different apertures. Contour lines show the spatio-temporal evolution of imbibition [60].
The use of real-rock (shale) micromodels represents a significant step forward in assessing flow and transport processes in the subsurface rock formations [60]. Imbibition of fracturing fluid (water/brine) in the partially saturated shale matrix was identified as one of the mechanism causing high volume loss in field operations and described above [26]. Imbibition experiments from brine flow through etched fractures in unsaturated shale micromodels were carried out. We estimated an average imbibition rate of approximately 5% per hour for Utica shale (figure 5b). As mentioned above, despite the low permeability of shale matrix, capillary forces play a major role in the water imbibition. The fracture–matrix interactions observed in these experiments cannot be recreated in engineered materials because they are not porous, i.e. no flow at the channel walls or etched boundaries. Experiments of scCO2 displacing brine in both engineered and geo-material micromodels demonstrate that shale roughness, in part resulting from the etching process due to the heterogeneous shale mineralogy, has a significant effect on displacement observed. The shale roughness resulted in the creation of preferential paths, which reduced the scCO2 displacement efficiency on brine [60]. The use of geo-materials allows us to investigate the role of wettability in immiscible displacement, which is very difficult to mimic with engineered materials. These experiments in realistic rock fractures highlight the complexity of immiscible displacement in nature.
(b). Lattice Boltzmann simulations
Hydrocarbon in shale is formed through chemical reactions of organic matter at high temperature and pressure. These reactions create nanometre-sized pores, which is comparable to the mean free path of a diffusing methane particle therein. In these scenarios, the Knudsen number (the ratio of the mean free path of a gas particle over the characteristic pore size in a porous medium) is relatively high and the gas molecules tend to slip on the solid surface. This leads to the onset Klinkenberg’s effect where the measured apparent (depending on the fluid) permeability is higher than the intrinsic permeability. The increased value of matrix apparent permeability become relevant for long-term production. As the Knudsen number increases, which is equivalent to the pore radius decreasing, Klinkenberg’s effect becomes more pronounced and the apparent permeability of a medium increases [16]. Under such conditions, Knudsen diffusion and slip flow become relevant and important transport mechanisms.
Chen et al. [61] adopted the lattice Boltzmann method (LBM) [62] to simulate Knudsen diffusion and pore-scale fluid flow. They reconstructed the complicated pore structures of the organic matter in shale using a pore sphere tolerance overlapping method, in a sample domain shown in figure 6a. Within these simulations they computed both the apparent permeability and estimated the intrinsic permeability of the sample, the ratio of which is called the correction factor. Chen et al. [16] predicted the effective permeability of a representative elementary volume (REV)-scale structure of shale matrix using a generalized lattice Boltzmann model that includes adsorption and slippage. The REV-scale structures were stochastically reconstructed using the elementary building block (EBB) model based on a Quartet Structure Generation Set [63]. In the EBB model, various constituents with different pore morphologies in shale matrix, including organic matter and inorganic minerals, are considered different EBBs. They focused on the effects that organic matter content, grain size and fractures had on the effective permeability of the simulation domain.
Figure 6.

Nanoscale studies of shale gas transport and permeability predictions using lattice Boltzmann model simulations. (a) Reconstruction of organic matter using the pore sphere tolerance overlapping method based on the information obtained from a scanning electron microscopy image of shale samples (Sichuan Basin, China). (b) The correction factor between apparent permeability and intrinsic permeability predicted using the LBM plotted along with existing empirical predictions.
The apparent and effective permeability of the shale samples was calculated at both scales. Calculated correction factor values are plotted in figure 6b. These results show that as the intrinsic permeability decreases, the corrector factor increases indicating that the apparent permeability becomes much larger than the intrinsic permeability. Most of the values of correction factor fall in the slip and transition regimes, with no Darcy flow regime observed. These results indicate slip flow should be considered in upscaled models to account for these discrepancies.
5. Discussion
One of the reasons that hydraulic fracturing is so poorly understood and inefficient is that length scales from nanometres to kilometres are involved. We have described several studies that characterize flow and transport in shale formations across these scales. At the field scale, we use discrete fracture network modelling to simulate production at a well site. At the meso-scale, we use triaxial fracture experiments and a finite-discrete element model to study dynamic fracture propagation. We use lattice Boltzmann pore-scale simulations and microfluidic experiments in both synthetic and real micromodels to study pore-scale phenomena.
The DFN simulation at the large scale matches the data well for the first few years of production and then underestimates the data at long term, even after including fracture–matrix diffusion (figure 2b). This discrepancy between the model and the data at long times probably occurs because small-scale physical mechanisms taking place in the local damage zones are not included in the model. The results suggest that the initial peak and rapid decline in production comes from advective transport through the natural fracture network whose connectivity with the well has been increased via hydraulic fracturing. Long-term sustained production comes from smaller scale mechanisms at meso- and pore scale including matrix processes (i.e. nano-scale) [7]. The challenge of simulating long-term behaviour of the production curve motivates the development of smaller scale studies.
The triaxial experiments and FDEM numerical simulations focused on the meso-scale in the so-called damage zone surrounding the primary fracture system. Increased damage should, in principle, lead to elevated effective permeability surrounding the main fractures and would contribute to a rise in predicted production at intermediate times (figure 2b). Our results [42] show that hydraulic fractures without proppants or shearing formed in shale have negligible permeability and are unlikely to contribute significantly to enhanced gas production, which is consistent with arguments on the necessity of adequate proppant placement [64]. As proppants are unlikely to penetrate tight fractures in the damage zone, this region must involve shear fracturing if it is to lead to enhanced gas migration. However, our results [41,43] also show that large strain (or strain localization) is needed to create new shear fractures. In addition, these fractures have permeability that may be limited by ductile deformation in shale that is either clay-rich or at sufficiently great depth. Nonetheless, fracturing at the meso-scale can lead to significant localized permeability gains (0 to 5 orders of magnitude), which is likely to significantly enhance intermediate-time production.
At the pore scale, one of the main concerns is the presence of water. Water, naturally present or apparently lost during the initial fracturing operations, predominantly resides in the matrix [26]. From an environmental point of view, this fact suggests that it is unlikely that water will leave the shale formation and will not impact the water resources outside the formation if fractures do not extend beyond the shale formation. However, it has a negative impact on the extraction of hydrocarbons due to the possibility of flow blocking. Our results suggest that use of scCO2 or other miscible solvents in re-stimulation operations can increase of the life of fracking wells. Our high pressure/temperature microfluidic experiments indicate that in oil-wet rocks (e.g. shale), hydrocarbon is better mixed with scCO2 in the presence of a low miscible phase (i.e. water) than in its absence. Hydrocarbon is more easily recovered in oil-wet reservoir rocks (e.g. shale) even though mobile brine is present as a consequence of heterogeneity-induced mixing [58], which is not the case in water-wet reservoir rocks (e.g. sandstone [65]). These experiments were carried out in engineered material micromodels because they provide exceptional control over micromodel properties and allow testing theoretical and numerical developments. The presented work using geo-material micromodels (shale) presents tremendous opportunities, e.g. mimic pore structure and wetting properties, and a basic need to study the role of the matrix–fluid interactions in geo-material microfluidic investigations conducted at geologic conditions [60].
During the shale gas extraction process, the reservoir pressure is high initially, and then gradually decreases as production proceeds. The LBM simulations discussed here indicate that using an intrinsic permeability for the rock matrix under such conditions will underestimate the gas flow rate and consequently generate inaccurate gas production curves. Under production conditions, the apparent permeability of the shale matrix could gradually increase during shale gas extraction and might be partially responsible for the observed stained long-term production tail [16,61,63,66].
The nanometre to kilometre scales are integrated together in the form of the production curve. We hypothesize that different pieces of the production curve are governed by different physical mechanisms at these multiple length and temporal scales. We have demonstrated that the inclusion of fracture–matrix diffusion coefficients that are appropriate for shale is not enough to reproduce the complexity of the system. Therefore, the next step in our field-scale modelling effort is the incorporation of our results from the pore and core scales, shale matrix and damage zone, respectively, into a reservoir simulation tool with the goal to predict hydrocarbon production using a multi-scale mechanistic model. This mechanistic description and integration of these multiple scales will allow us to make accurate predictions of production and eventually optimize hydrocarbon extraction from unconventional reservoirs. Finally, the successful results obtained for CO2 as an alternative working fluid from high-pressure/temperature microfluidic experiments, in this case as a stimulating agent, have motivated our current research on mixing processes of CO2 with resident fluids, mainly brine and hydrocarbon, in fractured media at the field scale to explore the effect of alternative working fluids on production.
Acknowledgements
We thank George King, Fersheed Mody and Steve Willson from Apache Corporation for guidance on research directions and Steve Chipera from Chesapeake Energy for providing shale samples.
Authors' contributions
J.D.H., J.J.M. and H.S.V. prepared the manuscript. DFN simulations were performed and analysed by S.K., N.M., J.D.H. and H.S.V. Triaxial experiments were performed and analysed by J.W.C. and L.F. FDEM simulations were performed and analysed by E.R. and L.Z. Microfluidic experiments were performed and analysed by M.L.P. and J.J.M. Lattice Boltzmann simulations were performed and analysed by Q.K. and L.C. All authors read, provided comments on and approved the manuscript.
Competing interests
We declare we have no competing interests.
Funding
We are grateful for support from LANL’s DR research programme, grant no. 20140002DR. Q.K. thanks DOE-NETL Unconventional Oil & Gas. J.D.H., L.C., L.F. and D.O. acknowledge the support of the LANL Director’s Post Doctoral Fellowship.
References
- 1.Moniz EJ. et al. 2011. The future of natural gas. Cambridge, MA: Massachusetts Institute of Technology. [Google Scholar]
- 2.Middleton RS, Carey JW, Currier RP, Hyman JD, Kang Q, Karra S, Jiménez-Martínez J, Porter ML, Viswanathan HS. 2015. Shale gas and non-aqueous fracturing fluids: opportunities and challenges for supercritical CO2. Appl. Energy 147, 500–509. ( 10.1016/j.apenergy.2015.03.023) [DOI] [Google Scholar]
- 3.Birdsell DT, Rajaram H, Dempsey D, Viswanathan HS. 2015. Hydraulic fracturing fluid migration in the subsurface: a review and expanded modeling results. Water Resour. Res. 51, 7159–7188. ( 10.1002/2015WR017810) [DOI] [Google Scholar]
- 4.McGlade C, Speirs J, Sorrell S. 2013. Methods of estimating shale gas resources—comparison, evaluation and implications. Energy 59, 116–125. ( 10.1016/j.energy.2013.05.031) [DOI] [Google Scholar]
- 5.Viswanathan HS. et al. 2015. Integrated experimental and computational study of hydraulic fracturing and the use of alternative fracking fluids. In 49th US Rock Mechanics/Geomechanics Symp. Alexandria, VA: American Rock Mechanics Association.
- 6.Viswanathan HS. et al. 2016. Using discovery science to increase efficiency of hydraulic fracturing while reducing water usage, ch. 4, pp. 71–88. Washington, DC: ACS Publications. [Google Scholar]
- 7.Karra S, Makedonska N, Viswanathan HS, Painter SL, Hyman JD. 2015. Effect of advective flow in fractures and matrix diffusion on natural gas production. Water Resour. Res. 51, 8646–8657. ( 10.1002/2014WR016829) [DOI] [Google Scholar]
- 8.Bazant ZP, Salviato M, Chau VT, Viswanathan HS, Zubelewicz A. 2014. Why fracking works. J. Appl. Mech. 81, 101010 ( 10.1115/1.4028192) [DOI] [Google Scholar]
- 9.Bustin AMM, Bustin RM. 2012. Importance of rock properties on the producibility of gas shales. Int. J. Coal Geol. 103, 132–147. ( 10.1016/j.coal.2012.04.012) [DOI] [Google Scholar]
- 10.Gale JFW, Reed RM, Holder J. 2007. Natural fractures in barnett shale and their importance for fracture treatments. AAPG Bull. 91, 603–622. ( 10.1306/11010606061) [DOI] [Google Scholar]
- 11.Kresse O, Weng X, Gu H, Wu R. 2013. Numerical modeling of hydraulic fractures interaction in complex naturally fractured formations. Rock Mech. Rock Eng. 46, 555–568. ( 10.1007/s00603-012-0359-2) [DOI] [Google Scholar]
- 12.Zhang X, Jeffry R, Thiercelin M. 2009. Mechanics of fluid-driven fracture growth in naturally fractured reservoirs with simple network geometries. J. Geophys. Res. 114, B12406 ( 10.1029/2009JB00654800) [DOI] [Google Scholar]
- 13.Sasaki S. 1998. Characteristics of microseismic events induced during hydraulic fracturing at the Hijori hot dry rock geothermal energy site. Tectonophysics 289, 171–181. ( 10.1016/S0040-1951(97)00314-4) [DOI] [Google Scholar]
- 14.Lou X, Vasseur G. 2002. Natural hydraulic cracking: numerical model and sensitivity study. Earth Planet. Sci. Lett. 201, 431–446. ( 10.1016/S0012-821X(02)00711-2) [DOI] [Google Scholar]
- 15.Rutqvist J, Rinaldi AP, Cappa F, Moridis GJ. 2013. Modeling of fault reactivation and induced seismic activity during hydraulic fracturing of shale-gas reservoirs. J. Petrol. Sci. Eng. 107, 31–44. ( 10.1016/j.petrol.2013.04.023) [DOI] [Google Scholar]
- 16.Chen L, Fang W, Kang Q, Hyman JD, Viswanathan HS, Tao WQ. 2015. Generalized lattice Boltzmann model for flow through tight porous media with Klinkenberg’s effect. Phys. Rev. E 91, 033004 ( 10.1103/PhysRevE.91.033004) [DOI] [PubMed] [Google Scholar]
- 17.Javadpour F, Fisher D, Unsworth M. 2007. Nanoscale gas flow in shale gas sediments. J. Can. Petrol. Technol. 46, 55–61. ( 10.2118/07-10-06) [DOI] [Google Scholar]
- 18.de Dreuzy JR, Darcel C, Davy P, Bour O. 2004. Influence of spatial correlation of fracture centers on the permeability of two-dimensional fracture networks following a power law length distribution. Water Resour. Res. 40, W01502 ( 10.1029/2003WR002260) [DOI] [Google Scholar]
- 19.de Dreuzy JR, Méheust Y, Pichot G. 2012. Influence of fracture scale heterogeneity on the flow properties of three-dimensional discrete fracture networks. J. Geophys. Res. 117, B11207 ( 10.1029/2012JB009461) [DOI] [Google Scholar]
- 20.Erhel J, de Dreuzy JR, Poirriez B. 2009. Flow simulation in three-dimensional discrete fracture networks. SIAM J. Sci. Comput. 31, 2688–2705. ( 10.1137/080729244) [DOI] [Google Scholar]
- 21.Dershowitz W. 2014. FracMan version 7.4. Interactive discrete feature data analysis, geometric modeling, and exploration simulation: user documentation. See http://fracman.golder.com/.
- 22.Hyman JD, Painter SL, Viswanathan HS, Makedonska N, Karra S. 2015. Influence of injection mode on transport properties in kilometer-scale three-dimensional discrete fracture networks. Water Resour. Res. 51, 7289–7308. ( 10.1002/2015WR017151) [DOI] [Google Scholar]
- 23.Sung-Hoon J, Young-Jin P, Kang-Kun L. 2011. Influence of fracture connectivity and characterization level on the uncertainty of the equivalent permeability in statistically conceptualized fracture networks. Transport Porous Med. 87, 385–395. ( 10.1007/s11242-010-9690-9) [DOI] [Google Scholar]
- 24.Pichot G, Erhel J, de Dreuzy JR. 2010. A mixed hybrid mortar method for solving flow in discrete fracture networks. Appl. Anal. 89, 1629–1643. ( 10.1080/00036811.2010.495333) [DOI] [Google Scholar]
- 25.Pichot G, Erhel J, de Dreuzy JR. 2012. A generalized mixed hybrid mortar method for solving flow in stochastic discrete fracture networks. SIAM J. Sci. Comput. 34, B86–B105. ( 10.1137/100804383) [DOI] [Google Scholar]
- 26.O’Malley D, Karra S, Currier RP, Makedonska N, Hyman JD, Viswanathan HS. 2015. Where does water go during hydraulic fracturing? Groundwater 54, 488–497. ( 10.1111/gwat.12380) [DOI] [PubMed] [Google Scholar]
- 27.Hyman JD, Karra S, Makedonska N, Gable CW, Painter SL, Viswanathan HS. 2015. dfnWorks: a discrete fracture network framework for modeling subsurface flow and transport. Comput. Geosci. 84, 10–19. ( 10.1016/j.cageo.2015.08.001) [DOI] [Google Scholar]
- 28.Hyman JD, Gable CW, Painter SL, Makedonska N. 2014. Conforming Delaunay triangulation of stochastically generated three dimensional discrete fracture networks: a feature rejection algorithm for meshing strategy. SIAM J. Sci. Comput. 36, A1871–A1894. ( 10.1137/130942541) [DOI] [Google Scholar]
- 29.LaGriT. 2013. Los Alamos Grid Toolbox (LaGriT). Los Alamos National Laboratory. See http://lagrit.lanl.gov.
- 30.Lichtner PC, Hammond GE, Lu C, Karra S, Bisht G, Andre B, Mills RT, Kumar J. 2015. PFLOTRAN user manual: a massively parallel reactive flow and transport model for describing surface and subsurface processes. Technical report, no. LA-UR-15-20403. Los Alamos, NM: Los Alamos National Laboratory.
- 31.Makedonska N, Painter SL, Bui QM, Gable CW, Karra S. 2015. Particle tracking approach for transport in three-dimensional discrete fracture networks. Comput. Geosci. 19, 1–15. ( 10.1007/s10596-015-9525-4) [DOI] [Google Scholar]
- 32.Painter SL, Gable CW, Kelkar S. 2012. Pathline tracing on fully unstructured control-volume grids. Comput. Geosci. 16, 1125–1134. ( 10.1007/s10596-012-9307-1) [DOI] [Google Scholar]
- 33.Commission TR. 2015. Texas railroad commission. See http://www.rrc.state.tx.us/ (accessed 27 October 2015).
- 34.Gutierrez M, Øino LE, Nygård R. 2000. Stress-dependent permeability of a de-mineralized fracture in shale. Mar. Petrol. Geol. 17, 895–907. ( 10.1016/S0264-8172(00)00027-1) [DOI] [Google Scholar]
- 35.Nygård R, Gutierrez M, Bratli RK, Høeg K. 2006. Brittle–ductile transition, shear failure and leakage in shales and mudrocks. Mar. Petrol. Geol. 23, 201–212. ( 10.1016/j.marpetgeo.2005.10.001) [DOI] [Google Scholar]
- 36.Shukla R, Ranjith PG, Choi SK, Haque A. 2012. A novel testing apparatus for hydromechanical investigation of rocks: geo-sequestration of carbon dioxide. Rock Mech. Rock Eng. 45, 1073–1085. ( 10.1007/s00603-012-0241-2) [DOI] [Google Scholar]
- 37.Zhang J, Kamenov A, Zhu D, Hill A. 2013. Laboratory measurement of hydraulic fracture conductivities in the Barnett Shale. In 2013 SPE Hydraulic Fracturing Technology Conf., The Woodlands, TX, USA, 4–6 February 2013, SPE-163839-MS.
- 38.Edlmann K, Haszeldine S, McDermott CI. 2013. Experimental investigation into the sealing capability of naturally fractured shale caprocks to supercritical carbon dioxide flow. Environ. Earth Sci. 70, 3393–3409. ( 10.1007/s12665-013-2407-y) [DOI] [Google Scholar]
- 39.Cho Y, Apaydin OG, Ozkan E. 2013. Pressure-dependent natural-fracture permeability in shale and its effect on shale-gas well production. SPE Reservoir Eval. Eng. 16, 216–228. ( 10.2118/159801-PA) [DOI] [Google Scholar]
- 40.Carey JW, Mori H, Brown D, Pawar R. 2014. Geomechanical behavior of caprock and cement: plasticity in hydrodynamic seals. Energy Procedia 63, 5671–5679. ( 10.1016/j.egypro.2014.11.600) [DOI] [Google Scholar]
- 41.Carey JW, Lei Z, Rougier E, Mori H, Viswanathan HS. 2015. Fracture-permeability behavior of shale. J. Unconventional Oil Gas Resour. 11, 27–43. ( 10.1016/j.juogr.2015.04.003) [DOI] [Google Scholar]
- 42.Frash L, Carey JW, Ickes T, Viswanathan HS. Submitted Method for in situ hydraulic fracturing in triaxial-coreflood systems to evaluate tensile fracture permeability at stress. [Google Scholar]
- 43.Frash L, Carey JW, Ickes T, Viswanathan HS. 2016. High-stress triaxial direct-shear fracturing of Utica shale and in situ X-ray microtomography with permeability measurement. J. Geophys. Res. ( 10.1002/2016JB012850) [DOI] [Google Scholar]
- 44.Carey JW, Rougier E, Lei Z, Viswanathan HS. 2015. Experimental investigation of fracturing of shale with water. In 49th US Rock Mechanics/Geomechanics Symp., San Francisco, CA, USA, 28 June–1 July 2015.
- 45.Munjiza A. 2004. The combined finite-discrete element method. London, UK: John Wiley & Sons. [Google Scholar]
- 46.Munjiza A, Knight E, Rougier E. 2011. Computational mechanics of discontinua. London, UK: John Wiley & Sons. [Google Scholar]
- 47.Munjiza A, Rougier E, Knight E. 2015. Large strain finite element method: a practical course. London, UK: John Wiley & Sons. [Google Scholar]
- 48.Munjiza A, Lei Z, Divic V, Peros B. 2013. Fracture and fragmentation of thin shells using the combined finite–discrete element method. Int. J. Numer. Meth. Eng. 95, 478–498. ( 10.1002/nme.4511) [DOI] [Google Scholar]
- 49.Owen DRJ, Feng YT, de Souza Neto EA, Cottrell MG, Wang F, Andrade Pires FM, Yu J. 2004. The modelling of multi-fracturing solids and particulate media. Int. J. Numer. Meth. Eng. 60, 317–339. ( 10.1002/nme.964) [DOI] [Google Scholar]
- 50.Guo L, Latham JP, Xiang J. 2015. Numerical simulation of breakages of concrete armour units using a three-dimensional fracture model in the context of the combined finite-discrete element method. Comput. Struct. 146, 117–142. ( 10.1016/j.compstruc.2014.09.001) [DOI] [Google Scholar]
- 51.Lisjak A, Figi D, Grasselli G. 2014. Fracture development around deep underground excavations: insights from FDEM modelling. J. Rock Mech. Geotech. Eng. 6, 493–505. ( 10.1016/j.jrmge.2014.09.003) [DOI] [Google Scholar]
- 52.Trivino LF, Mohanty B. 2015. Assessment of crack initiation and propagation in rock from explosion-induced stress waves and gas expansion by cross-hole seismometry and FEM–DEM method. Int. J. Rock Mech. Min. Sci. 77, 287–299. ( 10.1016/j.ijrmms.2015.03.036) [DOI] [Google Scholar]
- 53.Lei Z, Rougier E, Knight EE, Frash L, Carey JW, Viswanathan HS. In press A non-locking composite tetrahedron element for the combined finite-discrete element method. Eng. Comput. [Google Scholar]
- 54.Durham WM, Kessler JO, Stocker R. 2009. Disruption of vertical motility by shear triggers formation of thin phytoplankton layers. Science 323, 1067–1070. ( 10.1126/science.1167334) [DOI] [PubMed] [Google Scholar]
- 55.Villermaux E, Duplat J. 2003. Mixing as an aggregation process. Phys. Rev. Lett. 91, 184501 ( 10.1103/PhysRevLett.91.184501) [DOI] [PubMed] [Google Scholar]
- 56.de Anna P, Jimenez-Martinez J, Tabuteau H, Turuban R, Le Borgne T, Derrien M, Méheust Y. 2014. Mixing and reaction kinetics in porous media: an experimental pore scale quantification. Environ. Sci. Technol. 48, 508–516. ( 10.1021/es403105b) [DOI] [PubMed] [Google Scholar]
- 57.Ferrari A, Jimenez-Martinez J, Le Borgne T, Méheust Y, Lunati I. 2015. Challenges in modeling unstable two-phase flow experiments in porous micromodels. Water Resour. Res. 51, 1381–1400. ( 10.1002/2014WR016384) [DOI] [Google Scholar]
- 58.Jiménez-Martínez J, Porter M, Hyman J, Carey J, Viswanathan H. 2016. Mixing in a three-phase system: enhanced production of oil-wet reservoirs by CO2 injection. Geophys. Res. Lett. 43, 196–205. ( 10.1002/2015GL066787) [DOI] [Google Scholar]
- 59.Jiménez-Martínez J, de Anna P, Tabuteau H, Turuban R, Le Borgne T, Méheust Y. 2015. Pore scale mechanisms for the enhancement of mixing in unsaturated porous media and implications for chemical reactions. Geophys. Res. Lett. 42, 5316–5324. ( 10.1002/2015GL064513) [DOI] [Google Scholar]
- 60.Porter ML, Jiménez-Martínez J, Martinez R, McCulloch Q, Carey JW, Viswanathan HS. 2015. Geo-material microfluidics at reservoir conditions for subsurface energy resource applications. Lab Chip 15, 4044–4053. ( 10.1039/C5LC00704F) [DOI] [PubMed] [Google Scholar]
- 61.Chen L, Zhang L, Kang Q, Viswanathan HS, Yao J, Tao WQ. 2015. Nanoscale simulation of shale transport properties using the lattice Boltzmann method: permeability and diffusivity. Sci. Rep. 5, 8089 ( 10.1038/srep08089) [DOI] [PMC free article] [PubMed] [Google Scholar]
- 62.Chen S, Doolen GD. 1998. Lattice Boltzmann method for fluid flows. Annu. Rev. Fluid Mech. 30, 329–364. ( 10.1146/annurev.fluid.30.1.329) [DOI] [Google Scholar]
- 63.Chen L, Kang Q, Dai Z, Viswanathan H, Tao WQ. 2015. Permeability prediction of shale matrix reconstructed using the elementary building block model. Fuel 160, 346–356. ( 10.1016/j.fuel.2015.07.070) [DOI] [Google Scholar]
- 64.Valkó P, Economides MJ. 1995. Hydraulic fracture mechanics. New York, NY: John Wiley & Sons. [Google Scholar]
- 65.Shelton JL, Schneider FN. 1975. The effects of water injection on miscible flooding methods using hydrocarbons and carbon dioxide. SPE J. 15, 217–226. ( 10.2118/4580-PA) [DOI] [Google Scholar]
- 66.Chen L, Kang Q, Pawar R, He YL, Tao WQ. 2015. Pore-scale prediction of transport properties in reconstructed nanostructures of organic matter in shales. Fuel 158, 650–658. ( 10.1016/j.fuel.2015.06.022) [DOI] [Google Scholar]