Atomic-scale study of human dental enamel reveals an intergranular amorphous phase thought to be responsible for tooth decay.
Keywords: Human dental enamel, Mg-rich amorphous phase, tooth decay, atom probe tomography
Abstract
Human dental enamel, the hardest tissue in the body, plays a vital role in protecting teeth from wear as a result of daily grinding and chewing as well as from chemical attack. It is well established that the mechanical strength and fatigue resistance of dental enamel are derived from its hierarchical structure, which consists of periodically arranged bundles of hydroxyapatite (HAP) nanowires. However, we do not yet have a full understanding of the in vivo HAP crystallization process that leads to this structure. Mg2+ ions, which are present in many biological systems, regulate HAP crystallization by stabilizing its precursor, amorphous calcium phosphate (ACP), but their atomic-scale distribution within HAP is unknown. We use atom probe tomography to provide the first direct observations of an intergranular Mg-rich ACP phase between the HAP nanowires in mature human dental enamel. We also observe Mg-rich elongated precipitates and pockets of organic material among the HAP nanowires. These observations support the postclassical theory of amelogenesis (that is, enamel formation) and suggest that decay occurs via dissolution of the intergranular phase. This information is also useful for the development of more accurate models to describe the mechanical behavior of teeth.
INTRODUCTION
A staggering 60 to 90% of children and nearly 100% of adults worldwide suffer from dental decay (caries), which occurs via the progressive dissolution of dental enamel (1). The development of effective treatments requires a basic understanding of the structure of enamel and the processes by which it forms and dissolves. Dental enamel consists of a mineral phase [96 weight % (wt %)], mainly in the form of highly oriented carbonated hydroxyapatite (HAP) ribbon-like nanowires with cross-sectional dimensions of about 50 nm × 25 nm that are up to several millimeters long (2) (Fig. 1D). These crystallites are packed into bundles known as rods or prisms. Each rod contains about 40,000 nanowires at a density of roughly 550 crystallites/μm2 (3, 4). The phase present between the enamel rods is referred to as interprismatic enamel. The rods extend in an interwoven pattern through the thickness of the enamel, from the dentin-enamel junction to the outer surface of the tooth (5) (Fig. 1, A to C).
Fig. 1. Human dental enamel from millimeter to nanometer.
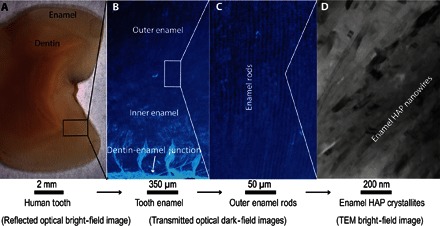
(A) Reflected optical bright-field image of the mature human tooth used in this study. Enamel is the outer layer of this cross section. (B) Transmitted optical dark-field image of human tooth enamel showing the junction between dentin and enamel as well as the inner and outer enamel. (C) Transmitted optical dark-field image showing outer enamel rods, each composed of thousands of HAP nanowires surrounded by a less dense interprismatic layer. (D) Higher-magnification TEM bright-field image of aligned HAP nanowires viewed edge on.
Dental enamel is a biocomposite. Apart from a mineral phase, it contains enamel proteins (1 wt %) and water (3 wt %). This combination of proteins, water, and a highly anisotropic nanostructured mineral phase leads to a unique combination of strength and toughness (6), viscoelastic properties (7, 8), wear (9) and erosion (10) resistance, and resistance to carious attack (11). These features enable dental enamel to last a lifetime in the harsh and variable environment of the oral cavity.
Under normal physiological conditions, demineralization and remineralization processes occur cyclically within the dental biofilm (plaque) layer, but these processes are balanced (12). The first stage of caries occurs when the biofilm microbial community shifts toward acidogenic species because of an imbalance of metabolic activity. This causes the pH of the dental biofilm to remain low for prolonged periods of time, resulting in increased dissolution of the dense outermost layer that is normally present at the tooth surface, leaving the tooth susceptible to preferential demineralization of the nanowires [thought to occur at the nanowire core (13)] and in the spaces that exist between the enamel rods.
The HAP composition in enamel differs slightly from the perfect HAP crystal [Ca10(PO4)6(OH)2]. Dental enamel HAP is carbonated and contains trace elements, such as magnesium and sodium (14). Naturally occurring peptides of the enamel-specific proteins, that is, amelogenin, ameloblastin, and enamelin, have been identified in mature human enamel (15). These proteins play an essential role in enamel formation, that is, amelogenesis. During amelogenesis, ameloblast cells secrete an organic matrix containing enamel-specific proteins, which is followed immediately by mineralization. As the HAP crystallization progresses, specific enzymes degrade and eliminate most of the remaining organic matrix (16). HAP crystallization is initiated by the mineralization of an amorphous calcium phosphate (ACP) precursor (17). It was recently proposed that Mg ions play a critical role in the stabilization of this ACP phase and the formation of the HAP mineral, where surface Mg ions retard the growth of HAP crystals, leading to the nanometer-sized HAP crystallites (18). Knowledge of the distribution of Mg ions and the presence of the precursor ACP in mature human dental enamel would provide much needed information for a better understanding of amelogenesis and may eventually allow the development of strategies to enhance remineralization, to slow the progression of or prevent caries, or even to restore lost dental enamel. However, until recently, it has not been possible to observe the distribution of Mg ions within HAP nanowires at the nanoscale in human dental enamel.
In recent work on rodent tooth enamel (19, 20), nanoscale heterogeneities in the distribution of Mg ions and organic materials, as well as the presence of intergranular ACP, were revealed using atom probe tomography (APT), a technique that allows three-dimensional (3D) visualization and chemical analysis at the atomic scale (21). Here, we use ultraviolet laser–assisted APT to investigate the distribution of trace inorganic (Mg, Na, and C ions) and organic (C, H, and N ions) materials within HAP nanowires in mature human dental enamel.
In laser-assisted APT, individual atoms (or small molecules) are field-evaporated from a needle-shaped sample (tip) with a diameter of about 100 nm by applying a combination of picosecond laser pulses and high voltage to the sample. A position-sensitive detector records the position of each atom, and their mass/charge ratio is determined by time-of-flight mass spectrometry. As a result, a 3D reconstruction of the field-evaporated volume (typically millions of atoms) is obtained (21, 22). In a typical APT mass spectrum, direct peak overlaps can lead to erroneous ion identification and composition measurements (23) (fig. S1). For example, in the case of tooth enamel, 24Mg2+, 12C+, and 24C22+ could directly overlap at 12 daltons (and their corresponding isotopes at 12.5 and 13 daltons). Because there is direct overlap between these species, the combined use of the isotopic distribution and the spatial association with other ions (for example, carbon-rich areas) was used to differentiate with a high degree of confidence between Mg and C ions from 12 to 13 daltons. Details are provided in figs. S2 and S3, tables S1 to S5, and Supplementary Text.
RESULTS AND DISCUSSION
Six APT tips were prepared from the cusp region of a human permanent molar tooth, and a total of approximately 400 million atoms were collected. The APT mass spectra (fig. S1) were consistent with previous APT studies of HAP (19, 24, 25). O, Ca, and P dominated. Interfaces enriched with Mg and Na were found between the HAP nanowires in all of the samples (Figs. 2 and 3, fig. S4, and movie S1). Three tips contained Mg-rich elongated precipitates (Fig. 3 and fig. S5), and two tips contained traces of organic material (Figs. 3 to 5 and fig. S6). The Ca/P ratios measured within the HAP crystallites in the six tips are between 1.48 and 1.59, close to the expected ratio of ~1.6 for pure HAP (26) (table S6).
Fig. 2. APT reconstructed volumes of human dental enamel HAP nanowires showing intergranular Mg-rich ACP.
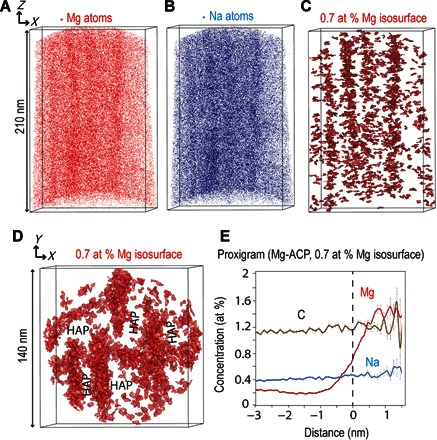
(A to C) Mg atoms (A), Na atom distribution (B), and 0.7 atomic % (at %) Mg isosurface (C) revealing the Mg-rich ACP between HAP nanowires. (D) Cross-sectional view of 0.7 at % Mg isosurface that highlights the ribbon-like shape of the HAP nanowires. (E) Proximity histogram (proxigram) from Mg-rich ACP based on 0.7 at % Mg isosurface [based on the sum of interfaces shown in (D)].
Fig. 3. APT 3D reconstructed volumes of human dental enamel HAP nanowires containing a Mg-rich precipitate and organic matter.
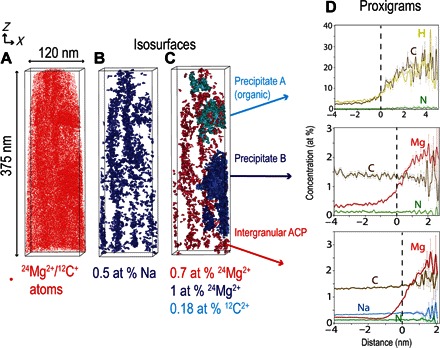
(A) 24Mg2+ (overlapping with 12C+) atom distribution. (B) Na isosurface (0.5 at %) showing Mg-ACP intergranular phase. (C) Isosurface 12C2+ (0.18 at %) (precipitate A), 1 at % 24Mg2+ isosurface (precipitate B), and 0.7 at % 24Mg2+ (Mg-ACP intergranular phase). (D) Proxigrams of precipitate A, precipitate B, and Mg-ACP (based on the sum of ACP interfaces).
Fig. 4. TEM image of human dental enamel HAP nanowires.
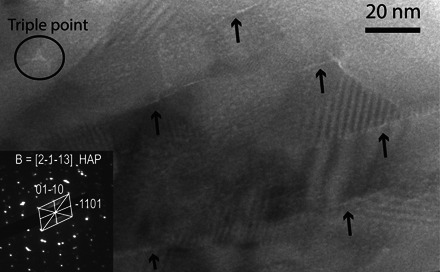
TEM central bright-field image. Arrows show an intergranular layer (light contrast) between HAP nanowires and a triple point (circled) thought to be amorphous. The electron diffraction pattern is indexed as [2-1-13].
Fig. 5. APT 3D reconstructed volumes from sample 2 with isosurfaces from the main species that arise from organic regions, carbonates, or Mg-rich phases.
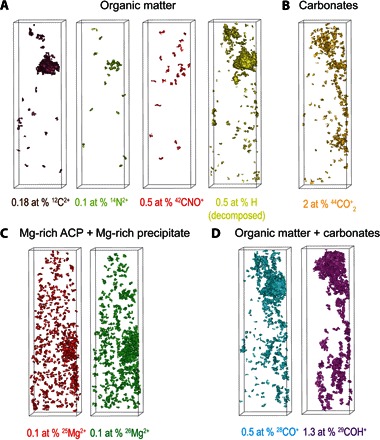
(A) Isosurfaces of 12C2+, 14N2+, 42CNO+, and H (decomposed) highlighting the organic matter. (B) Isosurfaces of 44CO2+ highlighting the carbonates. (C) Isosurfaces of 25Mg2+ and 26Mg2+ highlighting the Mg-rich precipitate and ACP. (D) Isosurfaces of 28CO+ and 29COH+ highlighting both organic matter and carbonates.
The intergranular Mg-rich phase between the HAP nanowires is a calcium phosphate phase with a Ca/P ratio varying from 1.70 to 1.76 and containing ~15 times more Mg and ~1.5 times more Na than the bulk of the HAP crystallites (table S6). Human tooth enamel differs from pure HAP because of the presence of CO3, Mg, and Na as its main impurities. Typical human tooth enamel contains between 2.7 and 5 wt % CO3, between 0.2 and 0.6 wt % Mg, and between 0.2 and 0.9 wt % Na (27, 28). When measured by APT, the level of Mg in the intergranular phase (from 1.55 to 2.66 wt %) far exceeds the Mg observed in HAP (~0.10 wt %). Only a disordered calcium phosphate phase could accommodate this level of foreign ions (29). A Mg-rich intergranular phase, which is thought to be ACP, has also been reported in rodent dental enamel (19). The intergranular regions were investigated by transmission electron microscopy (TEM). A bright-field image of HAP nanowires (Fig. 4) shows thin layers of lighter contrast between nanowires and a triple point. The bright contrast between the crystallites is consistent with the presence of an amorphous phase that appears lighter because of the absence of diffraction. It is assumed to be the Mg-rich phase observed in the atom probe data.
The HAP nanowires are mostly parallel and elongated in the z direction of the atom probe analysis, corresponding to the c axis of the nanowires (Figs. 2 and 3). As predicted by theories of enamel formation (30), the HAP nanowires have grown along the c-axis direction, whereas their growth in other directions was inhibited. In two APT tips containing Mg-rich precipitates, the HAP crystallites are bent, suggesting that their growth was interrupted (fig. S5). The ribbon shape of the nanowires is visible in Fig. 2D. The amorphous ACP phase is homogeneously distributed along all sides of the nanowires. The ACP phase was found to be 2 to 10 nm thick in all five tips. This measurement is based on specific Mg isosurfaces, and hence there is some spread in the values recorded. The TEM image (Fig. 4) indicates that the width of the amorphous layer is ~2 nm.
This new finding has important implications for the mechanical and acid corrosion resistance of enamel as well as for the understanding of the HAP growth process. The presence of an intergranular amorphous layer between the HAP crystallites has a strong influence on the mechanical and wear properties of enamel similar to ceramic nanocomposites (31, 32). Previous studies attributed the observed deformation behavior under nanoindentation to the presence of proteins and peptides at the interface between HAP crystallites (31, 33). Here, we show that the interphase regions contain Mg-ACP phase and remnants of proteins rather than proteins alone (Figs. 3 to 5 and fig. S6).
The Mg-rich ACP is also rich in Na (Figs. 2, 4, and 5 and table S6). ACP is known to accommodate foreign ions, such as Mg or Na (29). Although not detected here, fluorine ions have been found in intergranular ACP of fluorine-treated rodent enamel (19). In pigmented rodent enamel, an iron-rich ACP phase replaces the Mg-rich ACP, greatly improving its resistance to acid attack (19). Here, we provide evidence of incorporation of foreign ions in ACP in human dental enamel. This new knowledge highlights the potential for new techniques of remineralization using the intergranular ACP as a conduit for ions known to benefit enamel remineralization, such as fluorine. Although the intergranular ACP phase may provide a pathway for beneficial ions, it also has higher dissolution rates in acidic environments compared to the crystalline HAP phase (34), having been shown to be preferentially etched by acid in rodent tooth (19).
It has been hypothesized that Na within the ACP may act to balance the charge as a result of an increase in hydroxyl ions (20). However, we found no clear evidence of H enrichment within the intergranular ACP (table S6). Although it is difficult to distinguish the H in the instrument chamber from the H in the sample, sharp localized increases in H in specific features within atom probe data could be interpreted as coming from the sample.
The carbon content measured in HAP and ACP varied greatly between the samples, depending on whether they (i) consisted of the HAP/ACP only (for example, Fig. 2), (ii) contained Mg-rich precipitates (for example, Figs. 3 to 5), or (iii) also contained C-rich regions (for example, Figs. 3 to 5). Samples with no Mg-rich precipitates or organic material contain ~0.12 wt % C in HAP and ~0.22 wt % C in ACP. The average carbonate content in bulk HAP is expected to be ~3 to 5 wt % (~1 wt % C) higher than the APT results (35). On the other hand, the samples containing Mg-rich precipitates and signs of organic materials (Figs. 3 and 5) have a total C concentration of ~0.42 wt % in the ACP regions and 0.23 wt % in the HAP regions (table S6).
Most of the carbon measured in the ACP and HAP is thought to be inorganic (from carbonates), because no significant enrichment of H, 14N2+, 12C2+, and 44CNO+ was detected (Fig. 5). On the other hand, the precipitates that contain a much larger amount of carbon (15.6 wt %) are thought to be organic in origin owing to the copresence of H, 14N2+, 12C2+, and 44CNO+ (fig. S3). The C evaporating as 28CO+ and 29COH+ is from both organic and inorganic origin (Fig. 5D), whereas the C from 44CO2+ is from carbonates only (Fig. 5B), as highlighted by the respective isosurfaces. The distribution of carbonates and organic carbon is highly heterogeneous. Reconstructed APT volumes also revealed that the Mg-rich precipitates are elongated along the nanowire’s c axis (Fig. 3 and figs. S5 and S6) and contain ~2 wt % Mg, very close to the Mg content of the ACP intergranular phase.
Our direct observation of these Mg-rich ACP and precipitates supports the postclassical theory of amelogenesis (36). It has been demonstrated that, during amelogenesis, the enamel mineral nanowires near the mineralization front initially take the form of the ACP phase, and then at a later stage during the enamel maturation, they crystallize into the HAP phase. Our observations support the hypothesis that ACP ribbon-like nanowires are initially formed following the template provided by the enamel-specific self-assembled protein matrix, mainly composed of the N-terminal amelogenin cleavage products. The ACP nanowires begin to crystallize into the HAP phase only during the maturation stage, which lasts about 5 years for human permanent teeth. This stage is characterized by the secretion of kallikrein 4 (KLK4) proteases, which progressively degrade the enamel protein matrix followed by the reabsorption of the cleaved products into ameloblasts. The removal of the protein matrix allows ribbon-like nanowires to crystallize and grow in thickness, interlocking with the neighboring crystallites. Regions of enamel where peptides were not removed remain poorly crystallized. They are characterized by the increased concentrations of magnesium, carbon, hydrogen, and nitrogen ions.
CONCLUSIONS
Atomic-scale observations of an intergranular Mg-rich ACP phase between the enamel rods in human dental enamel contribute to our understanding of how enamel forms, how it decays, and its mechanical behavior. Understanding how enamel forms is the first step for the development of methods to achieve remineralization of carious enamel. Our observations verify the mechanism of enamel formation, specifically the postclassical theory of amelogenesis. Because the Mg-ACP phase at the enamel boundaries is susceptible to dissolution in an acidic environment, we propose that decay occurs via dissolution along the enamel rod boundaries. Finally, these results can be used to improve models of the mechanical properties and wear behavior of enamel by incorporating the true properties of the intergranular ACP phase.
MATERIALS AND METHODS
Sample preparation
The collection of the human tooth sample for this study was approved by Western Sydney Local Health District Human Research Ethics Committee, Australia (AU RED HREC/15/WMEAD/142). The tooth used in this study was a molar.
Tooth cutting
Following the extraction, the tooth was fixed overnight in 0.2 M sodium cacodylate buffer at 4°C. The specimen was then placed in Hanks’ balanced salt solution (Sigma-Aldrich Co.; 9.8 g/liter of deionized distilled water) for 24 hours at 4°C and then dried with compressed air. The tooth was cut along the mesiodistal axis at the cement-dentin junction to separate the crown using a low-speed diamond saw (IsoMet, Buehler Ltd.) under constant water irrigation. One-millimeter-thick sections were prepared from the crown using a low-speed diamond saw.
Optical imaging
For optical imaging, the tooth section was thinned and polished using 30-, 9-, and 6-μm diamond lapping films (Allied High Tech Products) on a tripod (Allied High Tech Products). An electron transparent sample was used for transmitted dark-field optical imaging.
Transmission electron microscopy
For TEM, the specimens were further thinned on a tripod using 6-, 3-, and 1-μm diamond lapping films, followed by ion beam thinning for 2 hours at 3 kV in a precision ion polishing system (Gatan 691) using a cold stage.
Atom probe tomography
For APT, a small piece (10 mm × 10 mm) of enamel from the tooth cross section was cut out. It was then tripod-polished to a thin wedge (typically below 10 μm) and attached to a support grid. The sample was then coated with gold to limit charging effects under the electron beam. Posts that were about 4 μm wide and with 50- to 100-μm clearance were cut using a Zeiss Auriga focused ion beam. The samples were then milled to form atom probe tips (80 to 120 nm in diameter) with final milling using a low acceleration voltage (10 kV) to minimize Ga implantation and damage.
Optical microscopy
A Leica DM6000 optical microscope was used in reflective light and transmitted dark field for the optical images of the tooth.
Transmission electron microscopy
TEM was carried out on a CM120 Biofilter microscope running at 120 kV by using a JEOL standard high-background double-tilt holder.
Atom probe tomography
APT measurements were conducted on a Cameca LEAP 4000× Si atom probe equipped with a picosecond-pulsed ultraviolet laser. In laser-assisted APT, individual atoms or small molecules from a needle-shape sample (tip) with a diameter of about 100 nm were field-evaporated by picosecond laser pulses in combination with high voltage applied to the sample. A position-sensitive detector recorded the position of each atom, and their mass/charge ratio was determined by time-of-flight mass spectrometry. As a result, a 3D reconstruction of the field-evaporated volume (typically millions of atoms) was obtained.
Here, a 355-nm-wavelength laser with a pulse energy of 100 pJ and a pulse frequency of 250 kHz was used to field-evaporate the samples at 50 K. A total of 400 million atoms from six tips were detected.
Supplementary Material
Acknowledgments
We acknowledge the facilities and the scientific and technical assistance of the Australian Microscopy & Microanalysis Research Facility at the Australian Centre for Microscopy & Microanalysis at the University of Sydney. We acknowledge A. Ceguerra for providing the theoretical isotopic abundance of the different carbon and magnesium molecular ions. Funding: This study was partially supported by grants from the Faculty of Dentistry Research Committee, University of Sydney, and the Australian Research Council (DP160104602). Author contributions: A.L.F. initiated this project, prepared the APT samples, performed data analysis and data reduction of APT data, assisted in TEM data interpretation, and wrote most of the paper. A.Z. sourced the samples, prepared the samples for optical microscopy and TEM, conducted optical microscopy, and assisted in interpretation and writing. H.L. conducted TEM imaging and performed TEM data reduction and interpretation. R.Z. participated in the project initiation and assisted in interpretation and rewriting. M.S. participated in the project initiation and assisted in data reduction, interpretation, and writing. J.C. supervised this project and assisted in data reduction, interpretation, and writing. All authors reviewed and approved this paper. Competing interests: The authors declare that they have no competing interests. Data and materials availability: All data needed to evaluate the conclusions in the paper are present in the paper and/or the Supplementary Materials. Additional data related to this paper may be requested from the authors.
SUPPLEMENTARY MATERIALS
Supplementary material for this article is available at http://advances.sciencemag.org/cgi/content/full/2/9/e1601145/DC1
fig. S1. Typical APT mass spectrum of human dental enamel containing organic materials (sample 1, Fig. 2).
fig. S2. Mass spectra from different regions of human tooth enamel.
fig. S3. Mass spectrum from N-rich region (organic).
fig. S4. APT 3D reconstructed volumes of sample 3.
fig. S5. APT 3D reconstructed volumes of samples 4 and 5.
fig. S6. APT 3D reconstructed volumes of sample 6.
table S1. Theoretical isotope proportion for Mg, C, and C2 at 12, 12.5, and 13 daltons.
table S2. Measured isotopic proportions at 12, 12.5, and 13 daltons in C-rich regions of enamel.
table S3. Measured isotopic proportions at 12, 12.5, and 13 daltons in precipitate B.
table S4. Measured isotopic proportions at 12, 12.5, and 13 daltons in intergranular ACP.
table S5. Measured isotopic proportions at 12, 12.5, and 13 daltons in Mg-rich precipitate of sample 4.
table S6. Typical composition of ACP, HAP, and Mg-rich precipitates in human dental enamel measured by APT.
movie S1. Animation showing the 3D distribution of Mg and Na atoms in human dental enamel; APT sample 3.
REFERENCES AND NOTES
- 1.World Health Organization (WHO), “Oral health” (Fact sheet no. 318, WHO, Geneva, 2012); www.who.int/mediacentre/factsheets/fs318/en/.
- 2.Meckel A. H., Griebstein W. J., Neal R. J., Structure of mature human dental enamel as observed by electron microscopy. Arch. Oral Biol. 10, 775–782 (1965). [DOI] [PubMed] [Google Scholar]
- 3.Eastoe J. E., Organic matrix of tooth enamel. Nature 187, 411–412 (1960). [DOI] [PubMed] [Google Scholar]
- 4.Kerebel B., Daculsi G., Kerebel L. M., Ultrastructural studies of enamel crystallites. J. Dent. Res. 58, 844–851 (1979). [DOI] [PubMed] [Google Scholar]
- 5.Daculsi G., Menanteau J., Kerebel L. M., Mitre D., Length and shape of enamel crystals. Calcif. Tissue Int. 36, 550–555 (1984). [DOI] [PubMed] [Google Scholar]
- 6.Yilmaz E. D., Bechtle S., Özcoban H., Schreyer A., Schneider G. A., Fracture behavior of hydroxyapatite nanofibers in dental enamel under micropillar compression. Scr. Mater. 68, 404–407 (2013). [Google Scholar]
- 7.Scheider I., Xiao T., Yilmaz E., Schneider G. A., Huber N., Bargmann S., Damage modeling of small-scale experiments on dental enamel with hierarchical microstructure. Acta Biomater. 15, 244–253 (2015). [DOI] [PubMed] [Google Scholar]
- 8.Zhang J., Wang C., Yang F., Du C., Nanoindentation creep behavior of enamel biological nanocomposites. RSC Adv. 4, 41003–41009 (2014). [Google Scholar]
- 9.Borrero-Lopez O., Pajares A., Constantino P. J., Lawn B. R., Mechanics of microwear traces in tooth enamel. Acta Biomater. 14, 146–153 (2015). [DOI] [PubMed] [Google Scholar]
- 10.Baumann T., Carvalho T. S., Lussi A., The effect of enamel proteins on erosion. Sci. Rep. 5, 15194 (2015). [DOI] [PMC free article] [PubMed] [Google Scholar]
- 11.Lubarsky G. V., Lemoine P., Meenan B. J., Deb S., Mutreja I., Carolan P., Enamel proteins mitigate mechanical and structural degradations in mature human enamel during acid attack. Mater. Res. Express 1, 025404 (2014). [Google Scholar]
- 12.Takahashi N., Nyvad B., The role of bacteria in the caries process ecological perspectives. J.Dent. Res. 90, 294–303 (2011). [DOI] [PubMed] [Google Scholar]
- 13.Yanagisawa T., Miake Y., High-resolution electron microscopy of enamel-crystal demineralization and remineralization in carious lesions. J. Electron Microsc. 52, 605–613 (2003). [DOI] [PubMed] [Google Scholar]
- 14.Robinson C., Brookes S. J., Shore R. C., Kirkham J., The developing enamel matrix: Nature and function. Eur. J. Oral. Sci. 106, 282–291 (1998). [DOI] [PubMed] [Google Scholar]
- 15.Castiblanco G. A., Rutishauser D., Ilag L. L., Martignon S., Castellanos J. E., Mejía W., Identification of proteins from human permanent erupted enamel. Eur. J. Oral Sci. 123, 390–395 (2015). [DOI] [PubMed] [Google Scholar]
- 16.Robinson C., Briggs H. D., Atkinson P. J., Weatherell J. A., Matrix and mineral changes in developing enamel. J. Dent. Res. 58, 871–882 (1979). [DOI] [PubMed] [Google Scholar]
- 17.Beniash E., Metzler R. A., Lam R. S. K., Gilbert P., Transient amorphous calcium phosphate in forming enamel. J. Struct. Biol. 166, 133–143 (2009). [DOI] [PMC free article] [PubMed] [Google Scholar]
- 18.Ding H., Pan H., Xu X., Tang R., Toward a detailed understanding of magnesium ions on hydroxyapatite crystallization inhibition. Cryst. Growth Des. 14, 763–769 (2014). [Google Scholar]
- 19.Gordon L. M., Cohen M. J., MacRenaris K. W., Pasteris J. D., Seda T., Joester D., Amorphous intergranular phases control the properties of rodent tooth enamel. Science 347, 746–750 (2015). [DOI] [PubMed] [Google Scholar]
- 20.Gordon L. M., Joester D., Mapping residual organics and carbonate at grain boundaries and the amorphous interphase in mouse incisor enamel. Front. Physiol. 6, 57 (2015). [DOI] [PMC free article] [PubMed] [Google Scholar]
- 21.B. Gault, M. P. Moody, J. M. Cairney, S. P. Ringer, Atom Probe Microscopy (Springer Science & Business Media, Berlin, 2012), p. 396. [Google Scholar]
- 22.Kelly T. F., Larson D. J., Atom probe tomography 2012. Annu. Rev. Mater. Res. 42, 1–31 (2012). [Google Scholar]
- 23.Kelly T. F., Kinetic-energy discrimination for atom probe tomography. Microsc. Microanal. 17, 1–14 (2011). [DOI] [PubMed] [Google Scholar]
- 24.Gordon L. M., Tran L., Joester D., Atom probe tomography of apatites and bone-type mineralized tissues. ACS Nano 6, 10667–10675 (2012). [DOI] [PubMed] [Google Scholar]
- 25.Gordon L. M., Joester D., Nanoscale chemical tomography of buried organic–inorganic interfaces in the chiton tooth. Nature 469, 194–197 (2011). [DOI] [PubMed] [Google Scholar]
- 26.Robinson C., Weatherell J. A., Hallsworth A. S., Variation in composition of dental enamel within thin ground tooth sections. Caries Res. 5, 44–57 (1971). [DOI] [PubMed] [Google Scholar]
- 27.Driessens F. C. M., The mineral in bone, dentin and tooth enamel. Bull. Soc. Chim. Belg. 89, 663–689 (1980). [Google Scholar]
- 28.Featherstone J. D. B., Mayer I., Driessens F. C. M., Verbeeck R. M. H., Heijligers H. J. M., Synthetic apatites containing Na, Mg, and CO3 and their comparison with tooth enamel mineral. Calcif. Tissue Int. 35, 169–171 (1983). [DOI] [PubMed] [Google Scholar]
- 29.Combes C., Rey C., Amorphous calcium phosphates: Synthesis, properties and uses in biomaterials. Acta Biomater. 6, 3362–3378 (2010). [DOI] [PubMed] [Google Scholar]
- 30.L. Addadi, S. Weiner, Stereochemical and structural relations between macromolecules and crystals in biomineralization, in Biomineralization, Chemical and Biochemical Perspectives, S. Mann, J. Webb, R. J. P. Williams, Eds. (VCH Publishers, New York, 1989). [Google Scholar]
- 31.He L. H., Swain M. V., Understanding the mechanical behaviour of human enamel from its structural and compositional characteristics. J. Mech. Behav. Biomed. Mater. 1, 18–29 (2008). [DOI] [PubMed] [Google Scholar]
- 32.P. M. Ajayan, L. S. Schadler, P. V. Braun, Nanocomposite Science and Technology (John Wiley & Sons, Hoboken, 2006). [Google Scholar]
- 33.Xie Z.-H., Swain M. V., Swadener G., Munroe P., Hoffman M., Effect of microstructure upon elastic behaviour of human tooth enamel. J. Biomech. 42, 1075–1080 (2009). [DOI] [PubMed] [Google Scholar]
- 34.Legfros R. Z., Sakae T., Bautista C., Retino M., Legeros J. P., Magnesium and carbonate in enamel and synthetic apatites. Adv. Dent. Res. 10, 225–231 (1996). [DOI] [PubMed] [Google Scholar]
- 35.Terpstra R. A., Driessens F. C. M., Magnesium in tooth enamel and synthetic apatites. Calf. Tissue Int. 39, 348–354 (1986). [DOI] [PubMed] [Google Scholar]
- 36.Simmer J. P., Richardson A. S., Hu Y.-Y., Smith C. E., Hu J. C.-C., A post-classical theory of enamel biomineralization… and why we need one. Int. J. Oral Sci. 4, 129–134 (2012). [DOI] [PMC free article] [PubMed] [Google Scholar]
Associated Data
This section collects any data citations, data availability statements, or supplementary materials included in this article.
Supplementary Materials
Supplementary material for this article is available at http://advances.sciencemag.org/cgi/content/full/2/9/e1601145/DC1
fig. S1. Typical APT mass spectrum of human dental enamel containing organic materials (sample 1, Fig. 2).
fig. S2. Mass spectra from different regions of human tooth enamel.
fig. S3. Mass spectrum from N-rich region (organic).
fig. S4. APT 3D reconstructed volumes of sample 3.
fig. S5. APT 3D reconstructed volumes of samples 4 and 5.
fig. S6. APT 3D reconstructed volumes of sample 6.
table S1. Theoretical isotope proportion for Mg, C, and C2 at 12, 12.5, and 13 daltons.
table S2. Measured isotopic proportions at 12, 12.5, and 13 daltons in C-rich regions of enamel.
table S3. Measured isotopic proportions at 12, 12.5, and 13 daltons in precipitate B.
table S4. Measured isotopic proportions at 12, 12.5, and 13 daltons in intergranular ACP.
table S5. Measured isotopic proportions at 12, 12.5, and 13 daltons in Mg-rich precipitate of sample 4.
table S6. Typical composition of ACP, HAP, and Mg-rich precipitates in human dental enamel measured by APT.
movie S1. Animation showing the 3D distribution of Mg and Na atoms in human dental enamel; APT sample 3.


