

Abstract
We have previously reported intra-segmental crossovers in Brome mosaic virus (BMV) RNAs. In this work, we studied the homologous recombination of BMV RNA in three different hosts: barley (Hordeum vulgare), Chenopodium quinoa, and Nicotiana benthamiana that were co-infected with two strains of BMV: Russian (R) and Fescue (F). Our work aimed at (1) establishing the frequency of recombination, (2) mapping the recombination hot spots, and (3) addressing host effects. The F and R nucleotide sequences differ from each other at many translationally silent nucleotide substitutions. We exploited this natural variability to track the crossover sites. Sequencing of a large number of cDNA clones revealed multiple homologous crossovers in each BMV RNA segment, in both the whole plants and protoplasts. Some recombination hot spots mapped at similar locations in different hosts, suggesting a role for viral factors, but other sites depended on the host. Our results demonstrate the chimeric (‘mosaic’) nature of the BMV RNA genome.
Keywords: Brome mosaic bromovirus, RNA replication, homologous RNA recombination, recombination hot spots, recombination frequency, host effects
1 Introduction
The exchange of genetic material generates variations among natural populations and demonstrates their role in evolution and adaptation (Awadalla 2003). Populations of RNA viruses usually harbor genetic diversity due to high mutation rates, recombination, turnover rates, and large variability (Simon-Loriere and Holmes 2011). Genetic RNA recombination contributes to viral evolution and biogenesis (Koonin, Dolja, and Krupovic 2015), evident in many groups of plus-sense RNA viruses in animals (Weiss and Schlesinger 1991; Graham and Baric 2010; Lukashev 2010), plants (reviewed in Bujarski 2013), and bacteria (Palasingam and Shaklee 1992), in negative-sense (Han and Worobey 2011), double-stranded (Krupovic, Dolja, and Koonin 2015), and retroviruses (Delviks-Frankenberry et al. 2011), and in defective-interfering RNAs (Sandoval et al. 2008).
Recombination allows for exchange of sequence blocks and thus generates mosaicism in viral RNA genomes. There have been reports of diverse mosaic patterns in retroviruses, including HIV (Perez et al. 2006) and Simian immunodeficiency virus (Jin et al. 1994), between strains of porcine reproductive and respiratory syndrome virus (PRRSV) (Li et al. 2009; Shi et al. 2013; Martín-Valls et al. 2014) and strains of Dengue virus (Villabona-Arenas, de Brito, and de Andrade Zanotto 2013) and the influenza A virus (Lam et al. 2013). Homologous inter-strain recombinants have been described in populations of Potyviridae (Visser and Bellstedt 2009; Yamasaki et al. 2010), Luteoviridae and Closteroviridae (Pagán and Holmes 2010).
RNA recombination is important for the evolutionary radiation of Bromoviridae, the tripartite RNA viruses (Codoñer and Elena 2008). In Brome mosaic virus (BMV), the extensive recombination events between different BMV RNA segments have been described (Bujarski and Kaesberg 1986; Bujarski 2013). Both viral RNA sequences and viral and host proteins do contribute to BMV RNA recombination. A recombination hot spot at the 3′-UTR of all three RNA segments regulates BMV RNA replication, recombination, and virion assembly (Rao and Kao 2015). Another hot spot maps to the intercistronic region in RNA3 (Wierzchoslawski et al. 2003). In Cucumber mosaic virus (CMV), recombination events among natural isolates were detected in different regions of the CMV genome (Nouri et al. 2014). Also, Pita and Roossinck (2013) observed inter-strain recombinants in the CMV reassortants.
Co-infections with related viral strains were used for mapping the recombination hot spots in enteroviruses (Smura et al. 2014), coronaviruses (Woo et al. 2006), and Dengue virus (Carvalho et al. 2010). Co-inoculations with low-competitive pairs of BMV RNA variants revealed homologous intra-segmental crossovers within large sequence blocks (Bruyere et al. 2000; Urbanowicz et al. 2005).
To map the crossover regions more precisely, co-infections with two BMV strains, Fescue (F) and Russian (R), were studied. Seedlings of three different plant species, as well as the barley protoplast cells, were co-infected with F/R BMV mixtures; the recombinant RNA segments were cloned and sequenced. The distribution patterns of strain-specific nucleotides demonstrated the efficient homologous crossovers within each BMV RNA segment and outlined the positions of distinct recombination hot spots. These results verified the swapped (‘mosaic’) nature of the genomic BMV RNAs.
2 Materials and methods
2.1 BMV strains, host plants, and virus infection
Two strains of BMV were used in this study, Russian (R) and Fescue (F). R is the type strain of BMV, infecting mostly grasses, while the F strain (a generous gift of R. Nelson) was isolated from leaves of Festuca arundinacea (tall fescue) by Ding et al. (2006). There are numerous single nucleotide (nt) differences in each of the BMV RNAs between the F and R strains (total of 1.3%), most of which are translationally silent. Two other strains of BMV, KU1 (Furusawa et al 1994) and Czech (Gadiou and Kundu 2010), carry a higher number of nt differences, but many of these lead to amino acid changes, and therefore they were not utilized in this study.
Three plant species were used as the BMV hosts: barley (Hordeum vulgare), Chenopodium quinoa, and Nicotiana benthamiana. For each experiment, barley seedlings (two pots of ten seedlings) were inoculated five to 6 days after planting, C. quinoa (ten plants) after 4 weeks, and N. benthamiana (ten plants) after 6 weeks. All plants were grown in a greenhouse with full-light condition (16 h of light, 25 °C), watered every 3 days and fertilized weekly. The F and R strains were maintained separately on barley seedlings, and extracted/purified according to Bujarski (1998). For a 1:1 ratio co-infection, 20 μl of each of 0.1 μg/μl purified BMV virus strains were mixed together and mechanically inoculated on host plants. After inoculation, plants were kept in the greenhouse for 10 days.
2.2 Protoplast transfections
Barley protoplasts were isolated from barley seedlings following the protocol described by Sztuba-Solińska, Dzianott, and Bujarski (2011). After isolation, 106 cells were transfected with 1–3 µg of mixtures of F and R virion RNAs, using a PEG-assisted procedure, in the presence of Carbenicillin (50 mg/ml). The transfected protoplasts were incubated overnight in darkness at 27 °C in a shaker at 25 rpm. BMV virion RNA was extracted from the purified virion preparations using published protocols.
2.3 RNA analysis, RT-polymerase chain reaction amplification, and cDNA cloning
Total RNA was extracted from the infected tissue (from all infected barley seedlings combined or from three leaves per each infected seedling combined of either C. quinoa or N. benthamiana) or from 106 transfected protoplast cells, as described in Sztuba-Solińska, Dzianott, and Bujarski (2011).
Northern blotting was used to assess the quality of BMV RNA and the accumulation level of F and R RNAs. Total RNA (1 μl) that was extracted from 50 mg of combined leaf tissue and dissolved in 30 μl of water was run in 1 per cent formaldehyde-formamide denaturing agarose gel, and the blots were probed with radioactive 3′-probe, as described by us before. The intensity of bands was quantified densitometrically (by counting the number of pixels) and compared between F and R RNA components.
The RNA templates were copied and amplified as cDNA products by Reverse Transcription (RT)-polymerase chain reaction (PCR) using a high- fidelity reverse transcriptase (AMV reverse transcriptase from Roche Diagnostics) and a thermostable DNA polymerase (GoTaq DNA Polymerase from Promega Corp.). Briefly, the reverse transcription reaction mixture (20 μl) contained 10 mM of reverse primer, 50 units of AMV RT, 50 μM dNTPs, 25 units of RNasin, and 1 μl of total RNA as template (total RNA as an equivalent of 50 mg of combined leaf tissue or 106 protoplasts and dissolved in 30 μl of water). The reaction was incubated for 60 min at 37 °C and 5 min at 95 °C. The following PCR amplification reaction mixture (50 μl total) contained 1x GoTaq Flexi buffer, 2.5 mM of MgCl2, 0.8 mM of dNTP mix, 0.2 μM of forward primer, 0.2 μM of reverse primer, approximately 0.1 μg of cDNA, and 1.25 units of GoTaq DNA Polymerase. Thermal cycler was set for twenty cycles of 1 min at 95°C for denaturation, 30 s at 64–68 °C for primer annealing, and 72°C for 1 min/kb, followed by final extension at 72°C for 10–20 min to add an extra A overhung to the 3′-end.
The PCR-generated cDNA products were cloned into the pGEM-T Easy vector (Promega). Digestions with strain-specific restriction enzymes were used to select the insert-carrying cDNA clones and to confirm the ratio of F to R strains in the co-inoculated plants. The insert-carrying clones were sequenced using the Sanger protocol at The University of Chicago DNA Sequencing and Genotyping Facility (http://cancer-seqbase.uchicago.edu/).
2.4 Control RT-PCR reactions
As a control against RT-PCR generated recombinants (Cocquet et al. 2006), RT-PCR was performed on RNA3 sequences directly from a mixture of F and R virion BMV RNAs, with added total RNA from either uninfected whole plants or barley protoplasts. Another control involved co-transfecting the protoplasts with mixtures of F and R BMV RNAs 1 and 3 only. By omitting the RNA2 component, RNA replication was prevented. The resulting RNA extracts were treated with RNase-free DNase (Ambion) to remove the possible DNA-amplified PCR products, followed by RT-PCR reactions, cloning, and sequencing. For each control reaction, twenty-five cDNA clones (of RNA3 in first control, and of RNA3 or RNA1 in the second control) were sequenced using the Sanger protocol (see above) and none revealed the F x R crossovers (not shown).
2.5 Alignment of recombinant RNA sequences
The sequences of the cloned cDNAs were compared to the following GenBank sequences. For RNA1, the R strain was X02380.1 and the F strain wasDQ530423.1. These sequences are 3,234 nt long and had the nucleotide differences at thirty-two positions. For RNA2, the R strain was X01678.1 and the F strain was DQ530424.1. The F sequence is 2,867 nt long, and it contains 61 nt differences and a 2 nt insertion within the noncoding region relative to R sequence. For RNA3, the R strain was NC_002028.2 and the F strain was DQ530425.1. The F RNA3 sequence is 2,114 nt, while the R RNA3 sequence is 2,111 nt. These sequences contain 21 nt differences and a polyA tract of variable length within the intercistronic region, which accounts for the length difference between the strains. This region was not scored for recombination.
A few sites that were polymorphic in the GenBank sequences proved to be monomorphic in our hands. It is likely that the parental strains had become monomorphic through genetic drift. The monomorphic sites included position 3194 in RNA1, positions 1920, 1984, 2430, and 2582 in RNA2, and positions 1324 and 1350 in RNA3. These sites were not scored for recombination.
The cloned cDNA sequences were aligned using blastn, and each site that differed between F and R was examined. Multiple sequencing runs from the same clone were aligned with each other, and a visual examination was made for recombination sites. Some ambiguities, as well as nucleotides that did not match either F or R, were noted in the regions of overlap between different sequencing run. These usually occurred in the low-quality regions at the ends of the sequence, where many differences and gaps relative to the GenBank sequence were noticed. Most of these ambiguities were resolved by examining the aligned sequences manually; the remaining ambiguous sites were resolved in favor of the higher quality sequence. Single sites that appeared to be recombinant in low-quality regions between non-recombinant sites were not counted.
2.6 Recombination frequency and statistics
Recombination frequency per nucleotide (RFN) was calculated for each RNA fragment (interval) between markers, as the number of recombinants observed in this interval divided by the total number of sequenced clones (per cloning experiment) and divided by the number of nucleotides (the length) in that fragment multiplied by 100. No attempt was made to correct for possible multiple recombinations in the same interval. The error bars for individual RFN values represent the 95 per cent confidence intervals of a binomial distribution. The confidence interval was calculated with the Clopper–Pearson formula (Clopper and Pearson 1934).
The similarity between pairs of experiments in their interval-specific RFN values was estimated by calculating the Pearson correlation coefficient. The degrees of freedom used to calculate the P values were the number of intervals for each RNA minus two (Zar 2009). The relationship between the RFN value sets can range from −1 to +1, with a stronger correlation the closer the coefficient approaches the +1 value. A Pearson coefficient of ≥0.5 is considered a strong correlation indicating that mutations occur at similar sites with similar frequency. The P values reflect the accuracy of the Pearson coefficient, with ≤0.05 having a 95 per cent chance of being correct.
3 Results
3.1 Co-infections with F and R BMV strains
To determine the accumulation of F and R BMV strains in the hosts, two to three seedlings were mechanically inoculated with leaf sap (separately from F or R BMV-infected barley seedlings), and the viral RNA concentration was estimated with Northern blotting in the total RNA extracted 10 days postinoculation. No apparent differences in viral RNA concentration between F- and R-infected N. benthamiana or barley systemic hosts, or C. quinoa local lesion host were observed (not shown). To determine the presence of both strains in the F x R co-infected plants, total RNA was extracted 10 days post inoculation, BMV RNA2 was amplified by RT-PCR, and the cDNA products for RNA2 were digested with Mlu I or PvuI, which cleave the R and F sequences, respectively (Fig. 1). Co-accumulation of both strains was detected in the co-infected barley (B lanes), N. benthamiana (N lanes), and C. quinoa (C lanes) plants. The same result was confirmed in barley protoplasts (not shown). These analyses confirmed that F and R strains co-replicated in the species and thus were available for recombination.
Figure 1.

Agarose gel electrophoresis of the PCR-generated cDNA Fragments 2–3 from BMV RNA2, confirming co-infection by both F and R strains. The single cut observed for Mlu I digestion confirms the presence of R-BMV (marked by R), whereas the single cut with Pvu I confirms the presence of F-BMV (marked by F). Digestions of Fragments 2–3 from plants confirmed the BMV RNA2 mixture of both strains in the same host (B: Barley; C: C. quinoa; and N: N. benthamiana).
3.2 Recombination of BMV RNAs in whole plants
To determine the recombination activity between F and R BMV RNAs, the progeny viral RNA was extracted from co-infected plants and the individual RNA components were cloned as cDNA. The BMV RNA1 molecule is 3.1 kB long, and it was cloned in two fragments, covering nucleotides 1–1,500 and nts 1495–3190 (Fragments 1 and 2 in Fig. 2). The clones were sequenced in both directions, and the sequences aligned with each other as well as with the parental F and R RNA1 sequences. This allowed us to determine the distribution of single nt markers and thus to characterize the recombinants. For N. benthamiana, seventy-one clones of Fragment 1 and sixty-eight clones of Fragment 2 were sequenced, demonstrating 8 per cent and 3 per cent of recombinants, respectively (Fig. 2). Therefore, the entire recombination frequency (RF), defined as the ratio of recombinant clones to the total number of sequenced clones, (see Urbanowicz et al. 2005) equaled 11 per cent (or fifteen recombinant clones). The F strain sequences slightly dominated for both fragments. Ten RNA1 recombinants appeared to have a single crossover, but five recombinants had multiple crossovers (Supplementary Fig. S1).
Figure 2.

Mapping of recombination regions between BMV RNAs 1 in three co-infected hosts. The locations of single-nucleotide differences (markers) on the RNA1 sequence (central gray thick line) are represented by short green vertical bars with the nt positions shown above. The RFN values were calculated as described in the text and their numbers plotted between the markers with the color-coded lines. The RFN values reflect the probability (percentage) of crossovers per nucleotide at the particular region. The RFNs for Ch. quinoa are denoted by green lines, N. benthamiana—by red lines, and for barley—by blue lines. The open reading frame (ORF) for protein 1a and the noncoding RNA1 regions are depicted below by thick and thin red lines, respectively, whereas boxed regions represent the two functional domains of the 1a protein: the NTPase and the helicase domains. The sequenced areas are represented by dashed lines, marking the two separately cloned fragments of the RNA1 molecule: Fragments 1 and 2. The total numbers of cDNA clones sequenced and the total fraction (%) of recombinants (RF) are shown by numbers at the bottom. The right-most column shows the total RF. The total RF values cannot be calculated for barley because of missing sequence data for Fragment 1.
To map and compare the probability of recombination along the RNA1 molecule, the values of RFN were calculated for the regions delimited by the single nt markers (see Section 2 for definition of RFN). As shown by the red line in Fig. 2, there was one region (hot spot II) of elevated recombination activity in the NTPase domain and a slightly increased activity at the 3′-noncoding region, observed in N. benthamiana.
More meaningful data about the distribution of recombination hot spots in RNA1 (Supplementary Fig. S1) were observed in C. quinoa, the local lesion host. Here, among sixty-seven cDNA clones covering the shorter fragment (Fig. 2), twenty-one F clones and twelve R clones represented the wt (un-recombined) sequence, showing a dominance of the F strain. In addition, eighteen clones were the recombinant ones yielding an RF of 26 per cent. Similarly, sixty-three clones that covered the larger fragment of RNA1 encompassed twenty-five wt F clones, fourteen wt R clones, and seventeen recombinant clones, corresponding to an RF of 27 per cent. Six recombination hot spots (marked with Roman numerals I through VI), altered with the regions of lower activity (Fig. 2, green line). Hot spot I covered the 5′-noncoding region, hot spots II and III were located within the NTPase domain of protein 1a open reading frame (ORF), hot spot IV mapped within the linker central region of the ORF, and Regions V and VI were within the helicase domain. Interestingly, the 3′-noncoding region supported a low level of recombination. Among the regions of elevated activity, the sequence within hot spot II had an RFN of 0.017 per cent, while hot spots V (nts 1979–2273) and VI (nts 2810–2814) had the highest RFNs, above 0.22 per cent.
Limited data on RNA1 were obtained in barley (Fig. 2, blue line), with only nine cDNA clones sequenced and one recombinant found, corresponding to an RF of 11 per cent. In this recombinant, the crossover occurred near hot spot V in a central portion of the helicase domain. Sequencing of a higher number of clones is required to fully assess the frequency of recombination in RNA1 in barley. With these limited data for barley and very few crossovers observed in N. benthamiana, the calculated Pearson correlation coefficients showed low statistical linear relationships and high P values when pairwise comparisons of the corresponding sets of RFNs were done among the three hosts (Table 1).
Table 1.
Pearson correlation data between pairs of the sets of RFN values for BMV RNA recombinants identified in different hosts.a
| BMV RNA | Host pairs | Pearson correlation coefficient | P | Degrees of freedom |
|---|---|---|---|---|
| RNA1 | Barley/C. quinoa | −0.1522136 | 0.6034 | 12 |
| RNA1 | Barley/N. benthamiana | −0.09031762 | 0.7588 | 12 |
| RNA1 | N. benthamiana/C. quinoa | 0.0468351 | 0.8129 | 26 |
| RNA2 | Barley/C. quinoa | −0.2099357 | 0.2933 | 25 |
| RNA2 | Barley/N. benthamiana | 0.1600686 | 0.4251 | 25 |
| RNA2 | Barley/protoplasts 1:1 | 0.4365035 | 0.02282 | 25 |
| RNA2 | Barley/protoplasts 3:1 | −0.01613249 | 0.9363 | 25 |
| RNA2 | N. benthamiana/C. quinoa | 0.3810301 | 0.009814 | 43 |
| RNA2 | N. benthamiana/protoplasts 1:1 | 0.6522988 | 1.21E-06 | 43 |
| RNA2 | N. benthamiana/protoplasts 3:1 | 0.08308495 | 0.5874 | 43 |
| RNA2 | C. quinoa/protoplasts 1:1 | 0.07462209 | 0.6261 | 43 |
| RNA2 | C. quinoa/protoplasts 3:1 | 0.1884978 | 0.215 | 43 |
| RNA2 | Protoplasts1:1/protoplasts 3:1 | 0.1785824 | 0.2405 | 43 |
| RNA3 | Barley/protoplasts 1:1 | 0.5198842 | 0.039 | 14 |
| RNA3 | Barley/protoplasts 1:3 | 0.5799374 | 0.01853 | 14 |
| RNA3 | Barley/protoplasts 3:1 | 0.01146229 | 0.9664 | 14 |
| RNA3 | Protoplasts 1:1/protoplasts 1:3 | 0.6443845 | 0.00705 | 14 |
| RNA3 | Protoplasts 1:1/protoplasts 3:1 | −0.2542184 | 0.342 | 14 |
| RNA3 | Protoplasts 1:3/protoplasts 3:1 | −0.1720674 | 0.524 | 14 |
aColumn 2 shows the host pair that was compared and analyzed for both the linear similarity at recombination sites and the frequency at given BMV RNA segment (indicated in column 1). Column 3 shows the calculated Pearson correlation coefficient for each respective pair of hosts. A coefficient of 0.5 and higher suggests a high similarity in recombination profiles in the given pair of hosts. Column four presents the corresponding P values that reflect the reliability of the Pearson correlation coefficient. A P value of 0.05 and lower means a 95 per cent chance the stated correlation being correct. The fifth column displays the degrees of freedom, which was used to calculate the correlations; they simply represent the number of fragments being analyzed minus 2.
The RNA2 molecule (2.8 kB nts) was cloned in three fragments, as illustrated in Fig. 3. The cumulative RF reached 58 per cent in N. benthamiana and 41 per cent in C. quinoa. For barley, the sequencing data covered only Fragments 1 and 2, with an RF of 6 per cent. Full sequence coverage of RNA2 from N. benthamiana and C. quinoa revealed five regions of increased crossover activity, with Regions II–IV within the 2a (RNA-dependent RNA polymerase, RdRp) protein ORF. Interestingly, the GDD RdRp motif was recombinationally silent. Hot spots I and V were in the 5′- and 3′-UTRs, respectively, with the RFNs higher in hot spot I, reaching the highest value in N. benthamiana (RFN = 0.175%). Interestingly, all the hot spots mapped to similar regions of RNA2 in all three hosts. The statistical relationship between the RFN data sets for RNA2 was significant for pair of N. benthamiana versus C. quinoa, with correlation coefficient 0.38 and P value 0.0098, differing significantly from other much lower coefficients (Table 1). This suggests that RNA2 recombined in a similar way in both hosts. The regions between the hot spots were less active, again located at similar positions for both hosts. For pairs of barley versus C. quinoa and barley versus N. benthamiana, there were lower correlation coefficients and higher P values (Table 1), likely due to incomplete data from barley.
Figure 3.

Mapping of recombination regions between BMV RNAs 2 in three co-infected hosts. The locations of nt markers alongside the BMV RNA2 sequence, the calculation, plotting, and color coding of RFN lines, and the 2a ORF are all marked as described in Fig. 2. The position of GDD motif, a characteristic feature of RdRp polymerases, is marked with a black vertical bar. Similar to Fig. 2, the areas of the separately cloned and sequenced Fragments 1, 2, and 3 are marked with dashed lines below. The numerals at the bottom show the total numbers of cDNA clones sequenced, and the total fraction (%) of recombinants that defines the RF for each fragment, followed by the total RF in the rightmost column.
The majority of RNA2 recombinants involved single-crossover events. Three recombinants were the double-cross variants and two were the triple-cross variants in N. benthamiana (Supplementary Fig. S2). Likewise, in C. quinoa, there were two double crossovers found in Fragments 1 and 2, while Fragment 3 generated two double-cross and one triple-cross recombinants (not shown).
There was a slight domination of R BMV RNA2 sequences observed among the un-recombined clones in C. quinoa for Fragments 1 and 2, but the F and R sequences were nearly equally represented for Fragment 3. In un-recombined clones from barley, the R BMV sequences dominated for Fragment 1 (thirty-six of fifty clones), Fragment 2 (thirty-six of fifty clones), and Fragment 3 (forty-two of forty-nine clones). Finally, among un-recombined clones from N. benthamiana (Supplementary Fig. S2), both strains were represented approximately equally: for Fragment 1, there were twenty-one F and fourteen R clones; for Fragment 2, there were twenty F and eighty R clones, and for Fragment 3, there were twenty F and twenty-one R clones.
The RNA3 molecule is 2.1 kB long, and there were fewer single-nucleotide markers that distinguish between R and F strains, with none in the 5′- and 3′-UTRs (Fig. 4). Thus, the cDNA clones generated for RNA3 were missing both termini. Both 5′- and 3′-primers, as well as an internal primer, were used for sequencing. The RF in barley plants reached 60 per cent. Among the forty-seven cDNA clones sequenced from barley, there were fourteen R and five F parental clones (Supplementary Fig. S3).
Figure 4.

Mapping of recombination regions between BMV RNA3s in co-infected barley plants. The locations of markers on the RNA3 sequence, the calculation, plotting, and color coding of RFN lines, and the 3a and CP ORFs are all marked as described in Fig. 2. The mapped RNA3 sequences responsible for CP binding (PE site and B-box site) are marked with purple bars below. Similar to Fig. 2, the separately sequenced areas of RNA3 cDNA clones are depicted with dashed lines below. The numerals at the bottom show total amounts of cDNA clones sequenced and the total RF values (%).
The RFN profiles in barley (Fig. 4) revealed five active regions (Regions I–V), respectively, on the C-side of the 3a ORF, the intercistronic region, the short N-terminal portion of the coat protein (CP) ORF, and the C-side of the CP ORF. The intercistronic region supported high RFN values, with a hot spot (Region IV) covering its downstream portion and the beginning of the CP ORF, between nts 1196 and 1292. Hot spot IV included the subgenomic RNA4 promoter (Haasnoot et al. 2002), known before as an active recombination site (Wierzchoslawski et al. 2003; Wierzchoslawski, Dzianott, and Bujarski 2004). Hot spot III included the B-box region, which is known to bind the CP molecules. Also, a more upstream CP binding site, known as the PE site (Fig. 4), supported recombination (hot-spot I). These results confirmed our prior data about the recombinationally active elements in RNA3 (Bruyere et al. 2000; Urbanowicz et al. 2005; Sztuba-Solinska et al. 2012). There were two low-activity regions in RNA3, within the N-side of the 3a ORF (nts 172–332) and within the central portion of the CP ORF (nts 1334–1598). However, RNA3 data from N. benthamiana and C. quinoa are required to calculate the statistical pairwise linear correlations among the three hosts.
3.3 Recombination in protoplasts
To test recombination with reduced selection pressure, the co-infection experiment was performed in a single cell protoplast system. Barley protoplasts have been used in the past to study BMV RNA replication (Sivakumaran, Hema, and Kao 2003; Sztuba-Solinska and Bujarski 2008). Mixtures of F and R BMV RNAs were co-transfected onto barley protoplasts, and the BMV RNA2 and RNA3 components were amplified by RT-PCR, followed by cloning and sequencing. The protoplasts were inoculated with two different ratios (1F to 1R and 3F to 1R ratio) of BMV RNAs. It has been reported previously that the composition of the BMV RNA inoculum influences the recombinant profiles (Kwon and Rao 2012). To analyze RNA2 recombinants, forty-one clones from the 1F to1R ratio were sequenced and six recombinants were identified, corresponding to an RF of 15 per cent (Fig. 5A, blue line). For hot spots I, II, and III, the distribution of crossovers followed the patterns found for RNA2 in whole barley plants. The Pearson correlation coefficients for the pairs of barley plants versus 1F to 1R protoplasts and N. benthamiana versus 1F to 1R protoplasts (Table 1) were high (0.437 at P = 0.023 and 0.652 at P = 1.21E-06, respectively). However, those for 1F to 1R and 3F to 1R protoplasts correlated to a much lesser extent with the plant hosts. Hot spot Ia (nts 340–484) was much more active in barley protoplasts than in whole plants. Interestingly, both hot spots Ia and V disappeared for the 3F to 1R inoculum ratio (yellow lines). Also, the RF increased to 36 per cent with the 3F to 1R ratio. Overall, these observations not only reveal limited effect of the host on recombinant spots but also suggest some role of the initial availability of viral RNAs for recombination.
Figure 5.
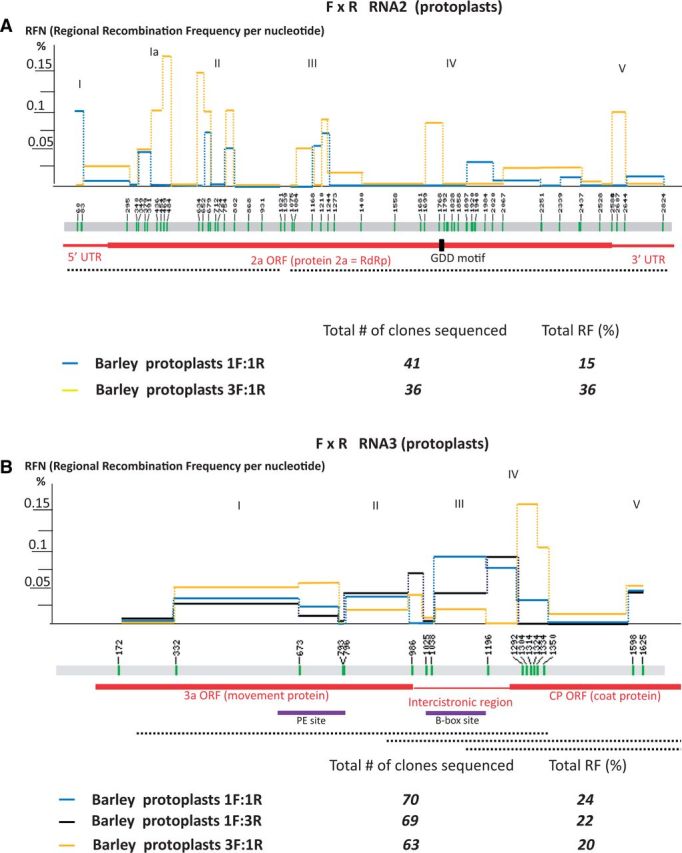
Mapping of recombination regions between BMV RNAs 2 (A) and RNAs 3 (B) in co-transfected barley protoplasts. The locations of nt differences (markers) on the BMV RNA sequence, the calculation, plotting, and depicting the ORFs all are as those in Figs 2 and 3. Two different ratios of F to R BMV RNA inoculums were tested for RNA2, and three ratios were tested for RNAs 3 inocula: 1F to 1R (blue line), 3F to 1R (yellow line), and 1F to 3R (black line). The separately sequenced areas of cDNA clones are depicted with dashed lines below. The numerals at the bottom show total numbers of cDNA clones sequenced and the total RF values (%).
Three F to R RNA inoculum ratios were also tested for their effect on RNA3 recombination in protoplasts (Supplementary Fig. S4). For 1F to 1R ratio, seventy clones were sequenced, with an RF of 24 per cent. Both 1F to 3R and 3F to 1R ratios had similar RFs (22 and 20%, respectively). Similar to whole barley plants, five active regions were mapped (hot spots I–V, Fig. 5B), including the 3a ORF, the intercistronic region, and a short region at the N-side of the CP ORF. However, there were significant differences at hot spots II, III, and IV. Hot spot II had its highest RFN value for 1F to 3R ratio (black line) and the lowest for 3F to 1R ratio (yellow lines). At the intercistronic region (hot spot III), the 1F to 1R ratio (blue line) supported the highest RFN, whereas the 3F to 1R ratio had the lowest RFN. The observed hot spot activity in the intercistronic region confirmed our prior observations (Wierzchoslawski et al. 2003; Wierzchoslawski, Dzianott, and Bujarski 2004). For hot spot IV, the 3F to 1R ratio had the highest RFN, but the 1F to 3R ratio had no recombinants. Significantly, a central portion of the CP ORF (nts 1350–1598) did not support recombination with any of the three F to R ratios in protoplasts or in whole barley plants. Apparently, there were some constraints, of a mechanistic rather than of a selection-based nature that prevented crossovers at these locations. The correlation coefficients between barley plants and both 1F to 1R and 1F to 3R protoplasts were high (0.520 and 0.580, respectively) at high confidence (P = 0.039 and P = 0.019, respectively). Also, the patterns between protoplasts 1F to 1R and 1F to 3R correlated well with each other (0.644 at P = 0.007). It remains to be demonstrated whether recombination of RNA1 in barley protoplasts is as low as in barley plants (shown in Fig. 2).
4 Discussion
This co-infection study reveals homologous recombination activity in all three BMV RNAs. Our data confirm the existence of previously reported recombination sites (Bruyere et al. 2000; Urbanowicz et al. 2005) and also identify several new active sequences. The calculated RFN values were used as measures of RF within the individual BMV RNA regions. In general, the error bars (based on a 95% binomial confidence interval distribution) were large for RFNs in most of the recombination hot spots (see Supplementary Fig. S5). This was due to a limited number of cloned and sequenced recombinants. Most likely, their accuracy could be increased with the use of methods of next-generation sequencing (especially RNASeq).
In BMV RNA1, six apparent recombination hot spots were mapped (in C. quinoa): in the 5′-UTR and within the 1a ORF, in both domains of protein 1a as well as between the domains. The crossovers, however, depended on the host because in N. benthamiana, active hot spots were found only within the NTP-ase domain and within the 3′-UTR; the latter has been reported previously (Bujarski and Kaesberg 1986). These host effects may reflect both the role of host factors and/or selection pressure. Data from barley were limited and therefore are not discussed.
The data for crossovers in RNA2 were more complete, as they were obtained from three plant hosts, as well as from protoplasts. Similar to RNA1, the recombination rates were higher in C. quinoa and N. benthamiana than in barley, and the patterns of crossovers covered the 5′-UTR, some overlapping regions in the 2a ORF, and the proximal portion of the 3′-UTR (Figs 3 and 5A). Interestingly, the rates of crossovers within the tRNA-like structure (distal portion of 3′-UTR) were low in all three hosts and also in protoplasts. Although, as in RNA1, the host did affect the rate of crossovers in RNA2, the distribution of crossover spots was affected to a much lesser degree. In fact, good statistical linear correlations were apparent between patterns of crossover sites in C. quinoa versus N. benthamiana, and even stronger correlations with barley protoplasts (Table 1). These correlations reveal that recombination in the three different hosts occurs at similar positions, most likely as a viral feature.
For RNA3, the recombination sites were generally similar in barley plants and barley protoplasts, again with strong statistical correlations (Table 1), although in protoplasts some spots depended on the initial F to R ratio in the RNA inoculum (Figs 4 and 5B). The previously reported hot spot within the intercistronic region was confirmed (Wierzchoslawski et al. 2003; Wierzchoslawski, Dzianott, and Bujarski 2004; Sztuba-Solińska et al. 2012). Also, the PE region (nts 620–800, Region I, Figs 4 and 5B) has been previously mapped as the CP binding/encapsidation site and found to be a CP-dependent recombination region (Sztuba-Solińska et al. 2012). In this work, PE region displayed a high recombination activity.
The structural complexity of the recombining RNA molecules can affect the distribution of recombination sites, as has been shown for HIV-1 (Simon-Loriere et al. 2010) and numerous plant viruses (Carpenter et al. 1995; Nagy and Bujarski 1995). In HIV-1, studies have revealed a clear bias for more frequent recombination inside hairpins than in regions outside hairpin structures (Simon-Loriere et al. 2010). Our studies show that one large portion of the CP ORF (nts 1350–1598, Figs 4 and 5A) represented a low crossover frequency region in RNA3, in both barley plants and protoplasts. It remains to be determined whether the folding of this region reveals a structural complexity similar to that of recombination-active regions. If yes, then the RNA folding complexity would not be the sole determinant of the crossover frequency. Both host and viral factors may contribute to recombination activity at the hot spots (Knies et al. 2008). It has been shown that the binding of both CP and replicase proteins to PE and the intercistronic regions of RNA3 affect recombination (Sztuba-Solinska et al. 2012). For Tobacco bushy stunt virus, various cellular pathways and factors were found to be major drivers of viral recombination in yeast (Nagy 2011), affecting the ‘molecular crowdedness’ within the viral replicase (Nagy and Pogany 2011).
A small fraction of F x R RNA recombinants arose via multiple crossovers, for all three BMV RNAs. These data, previously reported for barley and C. quinoa (Urbanowicz et al. 2005), further confirm the possibility of exchange of RNA portions between viral RNA genomes. Multiple crossover events were also reported during mixed infections with other RNA viruses, for example, between CMV and TAV (Morroni et al. 2013; reviewed in Sztuba-Solinska et al. 2011 and Bujarski 2013). The multiple crossovers confirm that the virus is available for exchanges of internal portions in the RNA genome and further prove its mosaic nature.
The precision of F x R RNA crossovers was striking, as there were no recombinants found with missed or added nucleotides over the sequence length. Because this high accuracy was observed both in whole plants as well as in barley protoplasts, this feature seems to be an intrinsic characteristic of viral mechanisms rather than an effect of selection pressure. The high precision was also reported in the CMV/TAV recombination system (Morroni et al. 2013). At the least, imprecise crossovers must occur at a much lower frequency than precise events.
Our studies reveal the dynamic character of the BMV RNA genome. In all three RNAs, homologous crossovers can generate a significant degree of mosaicism in the BMV genome, with sequence blocks derived from either parent. There are limited reports of homologous recombinants in natural virus populations (Morroni et al. 2013). A study revealed a dynamic mosaic populations of HIV-1 RNAs, with the rate of homologous exchanges reaching 0.1 per cent per nucleotide (Vuilleumier and Bonhoeffer 2015). Our results indicate that BMV recombination frequencies are lower by an order of magnitude from that of HIV-1 in each BMV RNA component: 0.016 per cent per nt for RNA1 (highest in C. quinoa), 0.02 per cent per nt for RNA2 (highest in N. benthamiana), 0.02 per cent per nt for RNA3 in barley plants, and 0.01 per cent per nt for RNA3 in barley protoplasts.
The homologous RNA recombination described here could be considered a functional analogue of DNA crossing-over in DNA organisms although the molecular mechanism is completely different. Both mechanisms can recombine functional units. Notable examples in this work include the exchanges between the two BMV RNA3 ORFs, and the exchanges between two functional domains within the 1a protein ORF in RNA1. Extensive crosses between two ORFs in RNA3 were also reported in natural strains of CMV (Nouri et al. 2014). Such exchanges can reduce the stochastic degradation of already fit RNA populations (Worobey and Holmes 1999; Bedhomme, Hillung, and Elena 2015).
Supplementary data
Supplementary data are available at Virus Evolution online.
Acknowledgements
We thank R. King for invaluable advice during statistical analyses, R. Nelson and X. S. Ding for providing the Fescue strain of BMV, the University of Chicago DNA Sequencing and Genotyping Facility (http://cancer-seqbase.uchicago.edu/) for Sanger sequencing, and Barb Ball for graphical assistance. This work was supported by a grant from National Science Foundation (MCB-0920617) and through the Plant Molecular Biology Center and the Graduate School, both at Northern Illinois University.
Conflict of interest: None declared.
References
- Awadalla P. (2003) ‘The Evolutionary Genomics of Pathogen Recombination’, Nature Reviews Genetics, 4: 50–60. [DOI] [PubMed] [Google Scholar]
- Bedhomme S., Hillung J., Elena S. F. (2015) ‘Emerging Viruses: Why They are Not Jacks of All Trades?’, Current Opinion in Virology, 10: 1–6. [DOI] [PubMed] [Google Scholar]
- Bruyere A., et al. (2000) ‘Frequent Homologous Recombination Events Between Molecules of One RNA Component in a Multipartite RNA Virus’, Journal of Virology, 74: 4214–9. [DOI] [PMC free article] [PubMed] [Google Scholar]
- Bujarski J. J. (1998) Bromovirus isolation. In: Foster G., Taylor S. (eds.) Plant Virology Protocols: From Virus Isolation to Transgenic Resistance, pp. 183-188. Totowa, NJ: Humana Press. [Google Scholar]
- Bujarski J. J. (2013) ‘Genetic Recombination in Plant-Infecting Messenger-Sense RNA Viruses: Overview and Research Perspectives’, Frontiers in Plant Science, 4: 68. [DOI] [PMC free article] [PubMed] [Google Scholar]
- Bujarski J. J., Kaesberg P. (1986) ‘Genetic Recombination Between RNA Components of a Multipartite Plant Virus’, Nature, 321: 528–31. [DOI] [PMC free article] [PubMed] [Google Scholar]
- Carpenter C. D., et al. (1995) ‘Involvement of a Stem-Loop Structure in the Location of Junction Sites in Viral RNA Recombination’, Journal of Molecular Biology, 245: 608–22. [DOI] [PubMed] [Google Scholar]
- Carvalho S. E., et al. (2010) ‘Comparative Analysis of American Dengue Virus Type 1 Full-Genome Sequences’, Virus Genes, 40: 60–6. [DOI] [PubMed] [Google Scholar]
- Clopper C., Pearson E. S. (1934) ‘The Use of Confidence or Fiducial Limits Illustrated in the Case of the Binomial’, Biometrika, 26: 404–13. [Google Scholar]
- Cocquet J., et al. (2006) ‘Reverse Transcriptase Template Switching and False Alternative Transcripts’, Genomics, 88: 127–31. [DOI] [PubMed] [Google Scholar]
- Codoñer F. M., Elena S. F. (2008) ‘The Promiscuous Evolutionary History of the Family Bromoviridae’, Journal of General Virology, 89: 1739–47. [DOI] [PubMed] [Google Scholar]
- Delviks-Frankenberry K., et al. (2011) ‘Mechanisms and Factors That Influence High Frequency Retroviral Recombination’, Viruses, 3: 1650–80. [DOI] [PMC free article] [PubMed] [Google Scholar]
- Ding X. S., et al. (2006) ‘Characterization of a Brome Mosaic Virus Strain and Its Use as a Vector for Gene Silencing in Monocotyledonous Hosts’, Molecular Plant-Microbe Interactions, 19: 1299–39. [DOI] [PubMed] [Google Scholar]
- Furusawa I., et al. (1994) ‘Nucleotide Sequence of a Set of cDNA Clones Derived from the Brome Mosaic Virus ATCC 66 Strain and Comparison with the Russian Strain Genome’, Japanese Journal of Phytopathology, 60: 454–62. [Google Scholar]
- Gadiou S., Kundu J. K. (2010) ‘Complete Genome Sequence of a Brome Mosaic Virus Isolate from the Czech Republic’, Czech Journal of Genetics and Plant Breeding, 46: 178–82. [Google Scholar]
- Graham R. L., Baric R. S. (2010) ‘Recombination, Reservoirs, and the Modular Spike: Mechanisms of Coronavirus Cross-Species Transmission’, Journal of Virology, 84: 3134–46. [DOI] [PMC free article] [PubMed] [Google Scholar]
- Haasnoot P. C., Olsthoorn R. C., Bol J. F. (2002) ‘The Brome Mosaic Virus Subgenomic Promoter Hairpin is Structurally Similar to the Iron-Responsive Element and Functionally Equivalent to the Minus-Strand Core Promoter Stem-Loop C’, RNA, 8: 110–22. [DOI] [PMC free article] [PubMed] [Google Scholar]
- Han G. Z., Worobey M. (2011) ‘Homologous Recombination in Negative Sense RNA Viruses’, Viruses, 3: 1358–73. [DOI] [PMC free article] [PubMed] [Google Scholar]
- Jin M. J., et al. (1994) ‘Mosaic Genome Structure of Simian Immunodeficiency Virus from West African Green Monkeys’, The EMBO Journal, 13: 2935–47. [DOI] [PMC free article] [PubMed] [Google Scholar]
- Knies J. L., et al. (2008) ‘Compensatory Evolution in RNA Secondary Structures Increases Difference Rate Variation among Sites’, Molecular Biology and Evolution, 25: 1778–87. [DOI] [PMC free article] [PubMed] [Google Scholar]
- Koonin E. V., Dolja V. V., Krupovic M. (2015) ‘Origins and Evolution of Viruses of Eukaryotes: The Ultimate Modularity’, Virology, 479-480: 2–25. [DOI] [PMC free article] [PubMed] [Google Scholar]
- Krupovic M., Dolja V. V., Koonin E. V. (2015) ‘Plant Viruses of the Amalgaviridae Family Evolved via Recombination Between Viruses with Double-Stranded and Negative-Strand RNA Genomes’, Biology Direct, 10: 12. [DOI] [PMC free article] [PubMed] [Google Scholar]
- Kwon S. J., Rao A. L. (2012) ‘Emergence of Distinct Brome Mosaic Virus Recombinants is Determined by the Polarity of the Inoculum RNA’, Journal of Virology, 86: 5204–20. [DOI] [PMC free article] [PubMed] [Google Scholar]
- Lam T. T., et al. (2013) ‘Systematic Phylogenetic Analysis of Influenza A Virus Reveals Many Novel Mosaic Genome Segments’, Infection Genetics and Evolution, 18: 367–78. [DOI] [PubMed] [Google Scholar]
- Li B., et al. (2009) ‘Recombination in Vaccine and Circulating Strains of Porcine Reproductive and Respiratory Syndrome Viruses’, Emerging Infectious Diseases, 15: 2032–5. [DOI] [PMC free article] [PubMed] [Google Scholar]
- Lukashev A. N. (2010) ‘Recombination among Picornaviruses’, Reviews in Medical Virology, 20: 327–37. [DOI] [PubMed] [Google Scholar]
- Martín-Valls G. E., et al. (2014) ‘Analysis of ORF5 and Full-Length Genome Sequences of Porcine Reproductive and Respiratory Syndrome Virus Isolates of Genotypes 1 and 2 Retrieved Worldwide Provides Evidence that Recombination is a Common Phenomenon and may Produce Mosaic Isolates’, Journal of Virology, 88: 3170–81. [DOI] [PMC free article] [PubMed] [Google Scholar]
- Morroni M., Jacquemond M., Tepfer M. (2013) ‘Deep Sequencing of Recombinant Virus Populations in Transgenic and Nontransgenic Plants Infected with Cucumber Mosaic Virus’, Molecular Plant-Microbe Interactions, 26: 801–11. [DOI] [PubMed] [Google Scholar]
- Nagy P. D. (2011) ‘The Roles of Host Factors in Tombusvirus RNA Recombination’, Advances in Virus Research, 81: 63–84. [DOI] [PubMed] [Google Scholar]
- Nagy P. D., Bujarski. J. J. (1995) ‘Efficient System of Homologous RNA Recombination in Brome Mosaic Virus: Sequence and Structure Requirements and Accuracy of Crossovers’, Journal of Virology, 69: 131–40. [DOI] [PMC free article] [PubMed] [Google Scholar]
- Nagy P. D., Pogany J. (2011) ‘The Dependence of Viral RNA Replication on Co-Opted Host Factors’, Nature Reviews Microbiology, 10: 137–49 [DOI] [PMC free article] [PubMed] [Google Scholar]
- Nouri S., et al. (2014) ‘Genetic Structure and Molecular Variability of Cucumber Mosaic Virus Isolates in the United States’, PLoS One, 9: e96582. [DOI] [PMC free article] [PubMed] [Google Scholar]
- Pagán I., Holmes E. C. (2010) ‘Long-Term Evolution of the Luteoviridae: Time Scale and Mode of Virus Speciation’, Journal of Virology, 84: 6177–87. [DOI] [PMC free article] [PubMed] [Google Scholar]
- Palasingam K., Shaklee P. N. (1992) ‘Reversion of Q Beta RNA Phage Mutants By homologous RNA Recombination’, Journal of Virology, 66: 2435–42. [DOI] [PMC free article] [PubMed] [Google Scholar]
- Pérez L., et al. (2006) ‘HIV Type 1 Molecular Epidemiology in Cuba: High Genetic Diversity, Frequent Mosaicism, and Recent Expansion of BG Intersubtype Recombinant Forms’, AIDS Research and Human Retroviruses, 22: 724–33. [DOI] [PubMed] [Google Scholar]
- Pita J. S., Roossinck M. J. (2013) ‘Fixation of Emerging Interviral Recombinants in Cucumber Mosaic Virus Populations’, Journal of Virology, 87: 1264–9. [DOI] [PMC free article] [PubMed] [Google Scholar]
- Rao A. L., Kao C. C. (2015) ‘The Brome Mosaic Virus 3' Untranslated Sequence Regulates RNA Replication, Recombination, and Virion Assembly’, Virus Research, 206: 46–52. [DOI] [PubMed] [Google Scholar]
- Sandoval C., et al. (2008) ‘Use Of A Defective RNA Of Broad Bean Mottle Bromovirus For Stable Gene Expression In Legumes’, Archives of Virology, 153: 1755–8. [DOI] [PubMed] [Google Scholar]
- Shi M., et al. (2013) ‘Recombination is Associated with an Outbreak of Novel Highly Pathogenic Porcine Reproductive and Respiratory Syndrome Viruses in China’, Journal of Virology, 87: 10904–7. [DOI] [PMC free article] [PubMed] [Google Scholar]
- Simon-Loriere E., Holmes E. C. (2011) ‘Why do RNA Viruses Recombine?’, Nature Reviews Microbiology, 9: 617–26. [DOI] [PMC free article] [PubMed] [Google Scholar]
- Simon-Loriere E., Holmes E. C., et al. (2010) ‘RNA Structures Facilitate Recombination-Mediated Gene Swapping in HIV-1’, Journal of Virology, 84: 12675–82. [DOI] [PMC free article] [PubMed] [Google Scholar]
- Sivakumaran K., Hema M., Kao C. C. (2003) ‘Brome Mosaic Virus RNA Syntheses In Vitro and in Barley Protoplasts’, Journal of Virology, 77: 5703–11. [DOI] [PMC free article] [PubMed] [Google Scholar]
- Smura T., et al. (2014) ‘Recombination in the Evolution of Enterovirus C Species Sub-Group that Contains Types CVA-21, CVA-24, EV-C95, EV-C96 and EV-C99’, PLoS One, 9: e94579. [DOI] [PMC free article] [PubMed] [Google Scholar]
- Sztuba-Solinska J., Bujarski J. J. (2008) ‘Insights into the Single-Cell Reproduction Cycle of Members of the Family Bromoviridae: Lessons from the Use of Protoplast Systems’, Journal of Virology, 82: 10330–40. [DOI] [PMC free article] [PubMed] [Google Scholar]
- Sztuba-Solinska J., Bujarski J. J., Dzianott A., Bujarski J. J. (2011) ‘Recombination of 5′ Subgenomic RNA3a with Genomic RNA3 of Brome Mosaic Bromovirus In Vitro and In Vivo’, Virology, 410: 129–682. [DOI] [PMC free article] [PubMed] [Google Scholar]
- Sztuba-Solinska J., Bujarski J. J., et al. (2011) ‘RNA-RNA Recombination in Plant Virus Replication and Evolution’, Annual Review of Phytopathology, 49: 415–43. [DOI] [PubMed] [Google Scholar]
- Sztuba-Solinska J., Bujarski J. J., et al. (2012) ‘Mutations in the Coat Protein-Binding Cis-Acting RNA Motifs Debilitate RNA Recombination of Brome Mosaic Virus’, Virus Research, 170: 138–49. [DOI] [PMC free article] [PubMed] [Google Scholar]
- Urbanowicz A., et al. (2005) ‘Homologous Crossovers among Molecules of Brome Mosaic Bromovirus RNA1 or RNA2 Segments In Vivo’, Journal of Virology, 79: 5732–42. [DOI] [PMC free article] [PubMed] [Google Scholar]
- Villabona-Arenas C. J., de Brito A. F., de Andrade Zanotto P. M. (2013) ‘Genomic Mosaicism in Two Strains of Dengue Virus Type 3’, Infection, Genetics and Evolution, 18: 202–12. [DOI] [PubMed] [Google Scholar]
- Visser J. C., Bellstedt D. U. (2009) ‘An Assessment of Molecular Variability and Recombination Patterns in South African Isolates of Potato Virus Y’, Archives of Virology, 154: 1891–900. [DOI] [PubMed] [Google Scholar]
- Vuilleumier S., Bonhoeffer S. (2015) ‘Contribution of Recombination to the Evolutionary History of HIV’, Current Opinion in HIV AIDS, 10: 84–9. [DOI] [PubMed] [Google Scholar]
- Weiss B. G., Schlesinger S. (1991) ‘Recombination Between Sindbis Virus RNAs’, Journal of Virology, 65: 4017–25. [DOI] [PMC free article] [PubMed] [Google Scholar]
- Wierzchoslawski R., Dzianott A., Bujarski J. (2004) ‘Dissecting the Requirement for Subgenomic Promoter Sequences by RNA Recombination of Brome Mosaic Virus In Vivo: Evidence for Functional Separation of Transcription and Recombination’, Journal of Virology, 78: 8552–64. [DOI] [PMC free article] [PubMed] [Google Scholar]
- Wierzchoslawski R., Dzianott A., Bujarski J., et al. (2003) ‘A Transcriptionally Active Subgenomic Promoter Supports Homologous Crossovers in a Plus-Strand RNA Virus’, Journal of Virology, 77: 6769–76. [DOI] [PMC free article] [PubMed] [Google Scholar]
- Woo P. C., et al. (2006) ‘Comparative Analysis of 22 Coronavirus HKU1 Genomes Reveals a Novel Genotype and Evidence of Natural Recombination in Coronavirus HKU1’, Journal of Virology, 80: 7136–45. [DOI] [PMC free article] [PubMed] [Google Scholar]
- Worobey M., Holmes E. C. (1999) ‘Evolutionary Aspects of Recombination in RNA Viruses’, Journal of General Virology, 80: 2535–43. [DOI] [PubMed] [Google Scholar]
- Yamasaki S., et al. (2010) ‘Comparisons among Isolates of Sweet Potato Feathery Mottle Virus Using Complete Genomic RNA Sequences’, Archives of Virology, 155: 795–800. [DOI] [PubMed] [Google Scholar]
- Zar J. H. (2009) Biostatistical Analysis, 5th edn New York: Pearson. [Google Scholar]
Associated Data
This section collects any data citations, data availability statements, or supplementary materials included in this article.