

Abstract
Mass spectrometry is a powerful analytical tool for identifying and characterizing structural modifications to the four canonical bases in RNA, information that is lost when using techniques such as PCR for RNA analysis. Here we described an updated method for sequence mapping of modified nucleosides in transfer RNA. This modification mapping approach utilizes knowledge of the modified nucleosides present in the sample along with the genome-derived tRNA sequence to readily locate modifications site-specifically in the tRNA sequence. The experimental approach involves isolation of the tRNA of interest followed by separate enzymatic digestion to nucleosides and oligonucleotides. Both samples are analyzed by liquid chromatography tandem mass spectrometry (LC-MS/MS) and the data sets are then combined to yield the modification profile of the tRNA. Data analysis is facilitated by the use of unmodified sequence exclusion lists and new developments in software that can automate MS/MS spectral annotation. The method is illustrated using tRNA-Asn isolated from Thermus thermophilus.
Keywords: modified nucleosides, RNA sequencing, tRNA, modified bases, tandem mass spectrometry, LC-MS/MS
1. Introduction
Transfer ribonucleic acids (tRNAs) are the most extensively post-transcriptionally modified RNA. To date, ca. 105 chemical modifications have been identified with tRNAs from organisms throughout the three kingdoms [1, 2]. These modifications range from simple methylations to complex structures requiring multiple enzymatic steps and cofactors [3]. The biological functions of many modifications are still being determined, but it is clear that these chemical changes can impact tRNA structure and biological activity [4–8].
Among the limitations in understanding the diversity of chemical modifications and their biological functions is the challenge in identifying modifications within a particular tRNA sequence context, especially when present at low levels [9–11]. Liquid chromatography tandem mass spectrometry (LC-MS/MS) is well-recognized as a powerful bioanalytical platform for the characterization of modified nucleosides in RNA [12]. Detection of modified nucleosides is readily accomplished by complete enzymatic digestion of the RNA [13], whereby the resulting nucleosides can be separated based on hydrophobicity differences by HPLC [14]. Modified nucleosides can be detected after HPLC separation using spectroscopy (e.g., UV) or by mass spectrometry [15]. Nucleoside identification is made by means of the measured mass-to-charge ratio (m/z) of the ionized nucleosides and through HPLC retention time comparison with known standards. Structural information can be gleaned via collision induced dissociation (CID) tandem mass spectrometry (MS/MS), providing a sensitive and useful analytical method for obtaining the total census of modified nucleosides in any RNA sample.
A limitation of nucleoside analysis is that the sample preparation step removes the sequence context. For tRNAs, this is less problematic for specialized modifications that are found only in the anticodon loop (usually positions 34 and 37), but for other modifications, including methylations and pseudouridines, individual tRNAs may possess more than one sequence location of the same chemical modification. To enable sequence mapping of tRNA modifications, McCloskey and co-workers adapted the ribonuclease (RNase) fingerprinting approach developed in the early 1960’s for sequence and structural analysis of ribonucleic acid (RNA) [16] into a protocol that utilized LC and MS, rather than electrophoresis and radioactivity, for the mapping of modifications onto any particular RNA sequence [17].
While the modification mapping by mass spectrometry approach is over 20 years old, recent developments in analytical instrumentation, methods and bioinformatics have significantly improved, now allowing the routine mapping of known or previously unknown modifications directly onto RNA sequences quickly and with low sample requirements. One of the most enabling aspects in recent years has been the dramatic increase in genomic data. The availability of such data allows RNA modification mapping by mass spectrometry to be tailored to focus on simply placing modified nucleosides onto already known sequences, rather than requiring the complete sequence characterization of the tRNA of interest [18, 19].
Here we describe an optimized protocol for RNA modification mapping by mass spectrometry that can be applied to tRNAs isolated from minimal cell cultures (e.g., 10-mL bacterial cell cultures) or from small primary tissue samples (e.g., 200 mg mammalian tissue). The LC-MS instrumentation required for such analyses is generally available in any mass spectrometry lab or facility, and the presence of open source or freely available software simplifies data interpretation. Using this method, we demonstrate the sequence specific placement of modified nucleosides in tRNAs obtained from the thermophilic organism Thermus thermophilus as well as human placenta.
2. Materials and methods
RNase T1, RNase A, Nuclease P1, triethylamine, TRI-Reagent®, sodium citrate, sodium chloride, sodium dodecyl sulfate and 1,1,1,3,3,3-Hexafluoro-2-propanol (HFIP) were purchased from Sigma Aldrich. Snake venom phosphodiesterase was purchased from Worthington Biochemical Corporation (Lakewood, NJ). Antarctic phosphatase was purchased from New England Biolabs (Ipswich, MA). Nucleobond AX 500 columns were purchased from Macherey-Nagel (Bethlehem, PA). Streptavidin agarose beads, Hypercarb Hypersep Spin Tips, Eppendorf tubes and conicals, ammonium acetate, LC-MS grade formic acid, ethanol and isopropyl alcohol were purchased from Fisher Science (Fair Lawn, NJ). LC-MS grade water and acetonitrile was purchased from Honeywell B&J (Morristown, NJ). The biotinylated DNA probe (5′ – /5Biosg/GGA CTC GAA CCT GCG ACC TAC CGG T – 3′) was purchased from Integrated DNA Technologies (Coralville, IA).
2.1 Sample Preparation
2.1.1 Total tRNA isolation
2.1.1.1 Cell Lysing and Total RNA Precipitation
A 25 mL culture of T. thermophilus HB27 was grown under standard conditions [20]. The culture volume was lysed by adding 2 mL of TRI-Reagent®, followed by vortexing to ensure complete mixing. A de-identified, discard waste human placenta obtained from the University of Cincinnati Medical Center, was processed by removal of membrane, cord and vessels, then rinsed with a 1 M CaCl2 solution. A 200 mg tissue slice was obtained and added to 2 mL of TRI-Reagent®. The tissue was then mechanically disrupted with a tissue homogenizer. Both samples were rested for ten minutes before proceeding.
Two hundred microliters of chloroform were added to each sample for every mL of TRI-Reagent®. The tubes were vortexed vigorously then centrifuged at 1000 × g for 10 min. After centrifugation, the upper aqueous layer containing total RNA was removed to a clean tube. To this was added 2X volume of room temperature isopropyl alcohol, and the solution was vortexed then placed in a −80°C freezer (1 hr) or −20°C freezer (overnight). Tubes were centrifuged at 1500 × g for 30 min at 4°, and the supernatant was carefully removed. A translucent pellet of total RNA should be visible along the bottom of the tube. Residual isopropyl alcohol was allowed to evaporate by inverting the tube. After drying, the total RNA was reconstituted with a minimal amount of sterile water and the UV260 measured to determine RNA concentration [21].
2.1.1.2 Anion Exchange Separation of total tRNA from Total RNA
Transfer RNAs are purified from total RNA using anion exchange chromatography. Nucleobond AX 500 columns were used following the manufacturer’s instructions. The Nucleobond AX 500 column can bind up to 500 μg of RNA; for less than 100 μg the Nucleobond AX 80 column should be used. The tRNA fractions were collected into isopropanol, stored at −80 °C for 1 h, then centrifuged at 1500 × g for 30 min. After centrifugation, the supernatant was carefully removed and the total tRNA pellet was air-dried by inversion. Once dry, 10 μL of sterile water was added to each sample and the tRNA pellet was dissolved by pulse centrifugation before total tRNA (ttRNA) concentration was determined by UV260 measurement.
2.1.2 Specific tRNA Isolation with Biotinylated DNA probes
125 μL of streptavidin agarose beads were pipetted into a 1.5 mL Eppendorf tube and washed three times with 6X saline sodium citrate (SSC) then suspended in 375 μl 6X SSC. Into a separate Eppendorf was pipetted 10 μL (1 μg/μl) of tRNA specific biotinylated DNA probe. This solution was heated at 70 °C for 5 min, then added to the streptavidin beads and placed on a turnstile for 1 h at room temperature. The probe and beads were centrifuged at 1000 × g for 5 min and supernatant was then removed. The beads with bound DNA probe were then washed three times with 6X SSC. Total tRNA (0.5 mg) was made 6X SSC, by addition of 20X SSC, heated to 85°C for 10 min then allowed to equilibrate at 70 °C. The beads were then added to the ttRNA, transferred to a hot water bath at 37 °C and allowed to hybridize for 2 h with periodic shaking. Tubes were removed from the water bath and centrifuged at 1000 × g for 5 min. The supernatant was removed and beads were washed three times with 3X SSC. The hybridized tRNA(s) can be eluted by addition of 400 μL elution buffer (0.8 mL 10% SDS, 0.5 mL 10X SSC in 50 mL H2O). This elution step is repeated three times to increase the overall sample yield. To each elution was added 132 μL of 7.5 M ammonium acetate, tubes were vortexed, then 3 volumes of ethanol were added. The tRNA is precipitated as the ammonium salt by storing at −80 °C for 1 h (minimum) or at −20 °C overnight. Samples were centrifuged at 1500 × g for 30 min at 4 °C. The supernatant was removed by pipetting, being careful not to disturb the visible pellet, and the remaining pellet was air dried by inversion. To one tube is added 10 μL of sterile water and slowly pipetted up and down to dissolve the pellet, being careful not to cause bubbles. The solution is then pipetted into the second tube, then the third until all elutions are combined. The concentration of the purified tRNA was determined by UV260 measurement. NOTE: Purified tRNA concentrations and sample volumes typically require the use of a nanospectrophotometer for concentration and purity measurements. A ratio of A260/A280 ≥ 1.8 indicates RNA of appropriate purity.
2.1.3 Total Nucleoside Preparation
For a ttRNA nucleoside digestion we have found that for the chromatographic conditions listed in Section 2.2, a minimum of 12 μg of sample is needed for detection of the lowest abundance modification although these amounts are dependent on the mass spectrometer sensitivity and chromatographic conditions used. For a single tRNA, a minimum of 2 μg is needed. The purified tRNA was denatured by heating for 3 min at 100 °C then rapidly chilled by placing in an ice water bath. The purified tRNA was buffered by adding 1/10 volume of 0.1 M ammonium acetate. Next, 2U (units) of nuclease P1 were added for every 20 μg of tRNA and the mixture was incubated at 45 °C for 2 h. After incubation, 1/10 volume of 1 M ammonium carbonate was added to the mixture. Then 1.2 × 10⁻⁴ U of snake venom phosphodiesterase (Phosphodiesterase I) and 0.003 U Antarctic Phosphatase were added per microgram of tRNA, and the solution was incubated at 37 °C for 2 h. The sample was dried using a speed vac after incubation.
Hypersep spin tips have yielded excellent desalting and protein removal capabilities for nucleoside analysis [22]. The lyophilized samples were reconstituted in 0.1% formic acid in LC-MS grade water to a volume of 50 μL. The tips were equilibrated with three washings of 0.1% formic acid in a micro centrifuge at 845 × g for 30 s. Samples were then introduced to the tips and centrifuged. Tips were washed three times with 0.1% formic acid in LC-MS grade water. Tips were transferred to a clean Eppendorf tube and samples can be eluted with a solution of 0.1% formic acid in 80% acetonitrile. Two 50 μL elutions were performed, and the combined eluents were dried in a speed vac and reconstituted with mobile phase to desired concentration.
2.1.4 Ribonuclease Digestion of Purified tRNA
For a ttRNA oligonucleotide digestion we have found that for the chromatographic conditions listed in Section 2.2, a minimum of 5 μg is needed. For a specific tRNA digestion, a minimum of 1 μg is required although these amounts are dependent on the mass spectrometer sensitivity and chromatographic conditions used.
Here, 1 μg of probe-purified tRNA was made 200 mM in ammonium acetate. RNase T1 was added at a concentration of 50 U per μg tRNA and the sample was incubated at 37 °C for 2 h. The digestion mixture was lyophilized and reconstituted in mobile phase A (Section 2.2.2) to the desired injection volume of 5 μL. NOTE: Overdigestion with RNase T1 will result in guanosine cleavage as well as sporadic cleavage at adenosine.
A second 1 μg sample of the probe-purified tRNA in 200 mM ammonium acetate was digested with 0.01 U of RNase A by incubation at 37 °C for 2 h. As RNase A is a contaminant of LC-MS systems, 20 μL of saturated phenol and 10 μL of chloroform were added to the mixture after the 2 h incubation time to remove RNase A. The digestion mixture was vortexed and centrifuged at 1000 × g for 5 min, after which the phenol/chloroform layer was removed by pipet. The digestion mixture was lyophilized and reconstituted in mobile phase A as above.
2.2 Liquid Chromatography
2.2.1 LC conditions for nucleosides
Nucleoside separations were performed on a Hitachi 7400 UPLC using a Phenomenex Hydro-RP (3 μm, 1.0 × 250 mm) column and a diode array detector at a flow rate of 100 μL/min. All of the original tubing past the injection port was replaced with PEEK tubing (1/16″ OD × 0.005″ ID) having stainless steel flanges and fittings. Flow from the UV cell was routed into the mass spectrometer without splitting. Samples were gradient separated using Mobile Phase A (5 mM ammonium acetate pH 5.3, MPA) and Mobile Phase B (60% MPA, 40% acetonitrile, MPB). The previously reported gradient [15] was used with slight modifications. The gradient started at 1 %B and increased as follows: 5 %B at 5 min, 7 %B at 9 min, 10 %B at 11 min, 15 %B at 13 min, 40 %B at 32 min, 50 %B at 38 min, 75 %B at 43 min (hold for 2 min), 99 %B at 50 min (hold for 5 min), then returning to 1 %B at 60 min. The column should be re-equilibrated at 1 %B for at least 15 min prior to the next injection.
2.2.2 LC conditions for RNase digestion products
Oligonucleotide separations were performed on a Thermo Finnigan Surveyor MS Pump. Samples were injected using a Thermo Finnigan micro AS auto sampler. RNase digestion products were separated on an Waters XBridge™ C18 column (3.5 um, 1.0 × 150 mm) with MPA of 200 mM HFIP, 8 mM triethylamine (TEA) in water, pH 7.0 and MPB of 50% MPA and 50% methanol at a flow rate of 30 μL/min. RNase digestion products were eluted using a gradient from 5 %B to 20 %B in 5 min, followed by 1.7% increase of B/min until 95 %B. NOTE: HFIP and TEA will contaminate the HPLC and mass spectrometer ionization source. Removing this contamination is time consuming, so the use of a dedicated platform for RNA modification mapping is recommended.
2.3 Mass Spectrometry
2.3.1 Nucleoside detection
A Thermo LTQ-XL ion trap mass spectrometer equipped with an Ion Max electrospray source was used for the LC-MS identification of nucleosides. Mass spectra were recorded in positive polarity over an m/z range of 105-1200. The capillary temperature was set to 275°C, spray voltage 3.5 kV, tube lens 150V and 30, 15, 10 arbitrary flow units of sheath, auxiliary, and sweep gas, respectively. An exclusion list containing the canonical nucleoside masses was entered into the method and data dependent MS/MS of each of the two most abundant ions were recorded throughout the LC-MS run.
2.3.2 Analysis of oligonucleotides
The same Thermo LTQ-XL ion trap mass spectrometer was also used for the LC-MS/MS mapping of modifications on RNase digestion products. The mass spectrometer was tuned with a mixture of 5 pmol/μL dT5 and 5 pmol/μL dT15 to generate two separate tune files: one for dT5 and the second for dT15. An instrumental method file of 80 min was created having two sections. The first twenty minutes uses the dT5 tune file, where the second section uses the dT15 tune file. The use of separate tune files per section creates optimum conditions for changes in ionization for the varying sizes of the oligonucleotide digestion products. Each analysis segment contains a full scan from m/z 550 to 2000 (scan event 1) followed by four data-dependent scans triggered by the four most abundant precursors from scan event 1 (scan events 2–5). The maximum injection period for MS/MS was fixed at 200 ms with an intensity threshold of 500 counts. Each ion selected for collision-induced dissociation (CID) was analyzed for up to 8 scans before it was added to a dynamic exclusion list for 45 s. An exclusion list [23] created by in silico digestion [24] of the unmodified RNA sequence(s) created from the genomic DNA [25] improves modification mapping onto RNase digestion products. Mass spectra were recorded in negative polarity. A capillary temperature of 275 °C, spray voltage of 4 kV, and 25, 14, and 10 arbitrary flow units of sheath, auxiliary and sweep gas, respectively, were used for all electrospray ionization mass spectrometry experiments.
2.4 Data Analysis
Transfer RNA genomic sequences can be obtained from the Genomic tRNA Database (http://gtrnadb.ucsc.edu/) [25]. A variety of approaches are available to analyze LC-MS/MS data from RNase digestion products [26]. Manual annotation of MS/MS spectra was performed by calculating expected m/z values of all RNase digestion products based on the parent genomic tRNA sequence(s) using the MongoOligo on-line calculator (http://mods.rna.albany.edu/masspec/Mongo-Oligo) or a stand-alone version offering the same capabilities (http://bearcatms.uc.edu/new/limbachgroup_publication/mo-predict-software.html). Automated annotation was conducted using RoboOligo [27] and in-house software. The criterion for detection of a particular RNase digestion product based on MS/MS analysis was at least 80% of the expected c- and y-type ions [28] were found during spectral annotation, except for 7-methylguanosine containing digestion products, which fragment uniquely [29].
3. Results and Discussion
3.1 Census of modified nucleosides
As originally described by Kowalak et al. [17], a census of modified nucleosides is helpful in RNA modification mapping as it limits the possible basis set of modified nucleosides that must be placed on the tRNA sequence(s). Figure 1 is representative LC-MS data obtained from analysis of a total nucleoside digest. The total ion chromatogram (TIC), Figure 1A, represents a plot of all detected m/z signals over the time period of the LC separation. For simple mixtures, the TIC can often be used to determine the number of unique modified nucleosides in the sample. Identification of each modified nucleoside is performed by creating an extracted ion chromatogram (XIC or EIC), Figure 1B, which are plots of a single m/z value over the time period of the chromatography. The m/z values correspond to the protonated mass of each nucleoside (M+H)+, and mass values for modified nucleosides are readily obtained from on-line databases such as Modomics [30] or the RNA Modification Database [31].
Figure 1.
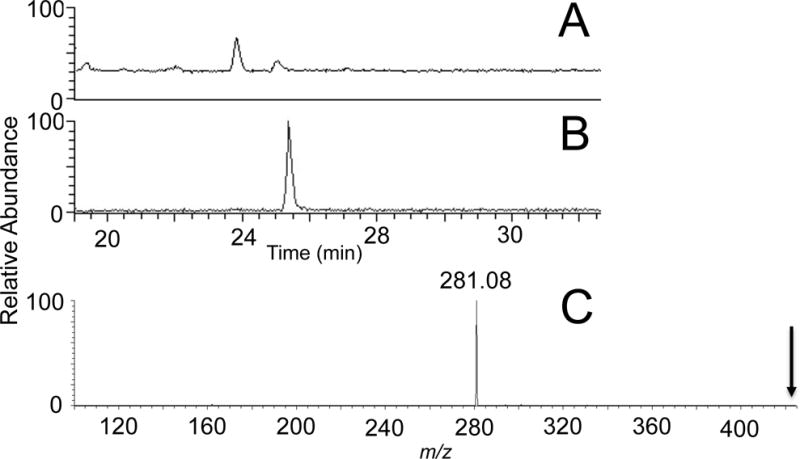
T. thermophiles HB27 tRNAASN nucleoside digest. A) Total ion chromatogram, B) Extracted ion chromatogram of the nucleoside N6-threonylcarbamoyladenosine, t6A m/z 413. C) Tandem mass spectrum of t6A showing nucleobase fragment ion (m/z 281.08) as the major ion product. Arrow denotes location of molecular ion, demonstrating complete fragmentation.
Nucleosides can typically be differentiated from any other contaminating m/z values by the fragmentation of the nucleoside into a charged nucleobase (and neutral, undetected sugar). Given the lability of the glycosidic bond between nucleobase and ribose sugar, the mass spectrum associated with any XIC will yield two major peaks – one arising from the protonated nucleoside and the other arising from in-source fragmentation into the protonated nucleobase. Generally, the instrument is tuned so that the relative abundance of the product ion from the precursor due to source fragmentation is around 50%. Alternatively, MS/MS of each nucleoside will generate a characteristic fragmentation pattern where the nucleobase tends to be the dominant m/z value detected (Figure 1C).
When analyzing tRNAs whose modification status is unknown, it is best to search the LC-MS data against the entire list of known modifications. Once all of the known modifications are identified within the data, unknowns are evaluated by a step-by-step examination looking for characteristic loss of neutral ribose sugar or neutral methylribose sugar. Ion signals detected at this stage are compared against the previous list identified by searching for EICs of known modification mass. Once the modification masses and retention times are identified, these modified nucleosides are then used as the basis set for subsequent sequence mapping. The use of standards can help with the identification of positional isomers, which may be present (e.g., m5C vs m3C). For T. thermophilis tRNAAsn, the detected modified nucleosides included 4-thiouridine (s4U), 2′-O-methylguanosine (Gm), 2′-O-methylcytidine (Cm), 6-threonylcarbamoyladenosine (t6A), 7-methylguanosine (m7G), 5-methyl-2-thiouridine (m5s2U), and 1-methyladenosine (m1A).
3.2 Sequence mapping modifications onto RNase digestion products
Base specific RNase digestion of a purified tRNA will generate oligonucleotides of known 5′- or 3′-nucleotide identity [32–34]. These oligonucleotides are then separated by HPLC, detected by MS and subjected to CID MS/MS to generate fragment ions, which allows for ‘mapping’ the modification to a specific nucleobase within the RNase digestion product.
RNase T1 should always be included in any RNA modification mapping protocol as it cleaves specifically at unmodified guanosines, leaving the oligonucleotide with a phosphate bound guanosine at the 3′ end. The only known guanosine modification that is recognized and cleaved by RNase T1 is 2-methylguanosine (m2G) [35]. RNase A cleaves nonspecifically at pyrimidine residues and RNase U2 cleaves at purines with a slight specificity to adenosine cleavage [34]. RNase MC1 cleaves RNA at the 5′-termini of uridine and pseudouridine [33]. The use of MC1 has the benefit that it does not cleave at a modified uridine or at a uridine adjacent to a nucleoside with a bulky modification. By using multiple RNases with different base specificity, oligonucleotide “reads” can be overlapped during sequence mapping to provide higher sequence coverage and additional confirmation regarding the sequence locations of modifications within any tRNA.
An advantage of RNA modification mapping by mass spectrometry is the reproducible nature of fragmentation of RNase digestion products. With few exceptions [36], oligoribonucleotides fragment during CID along the phosphodiester backbone generating a ladder of sequence fragments that can be interpreted manually or in an automated fashion. The specific bonds that fragment most often are the most labile bonds in the molecule, which for most digestion products will be the 5′ P-O inter-nucleotide bond. Fragment ions where the charge is retained on the 5′-fragment are denoted as c-type fragment ions, and fragment ions where the charge is retained on the 3′-fragment are denoted as y-type fragment ions [28]. The nomenclature allows the inter-nucleotide phosphodiester bond that fragments to be identified by using subscripts following the c- and y-type designations (Figure 2). Upon MS/MS, mapping a modification to a specific nucleobase is a function of simple addition of the masses of the individual nucleotides starting with the mass of the nucleotide at either end of the oligonucleotide.
Figure 2.
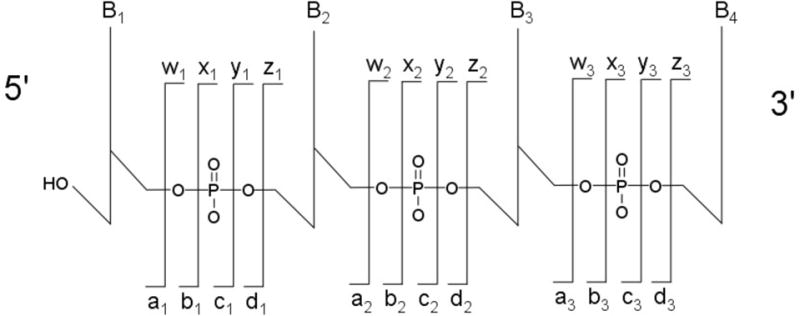
Standard nomenclature for annotation of CID fragment ions for oligonucleotides. Figure adapted from [28].
The MS/MS data in Figure 3 is from the oligonucleotide ACCGp from a human placenta ttRNA T1 digestion and will be used to illustrate the process of annotation of fragment ions in MS/MS spectra. One begins with the 3′ guanosine monophosphate ion at m/z 362 (y1) and manually evaluates the addition of any three of the remaining canonical nucleosides (RNase T1 digestion products contain only a single unmodified guanosine) to this starting m/z value. Doing so reveals a match at m/z 667 (y2) yielding the partial sequence −CGp. The addition of another cytidine residue to m/z 667 identifies y3 (−CCGp) and the process continues.
Figure 3.
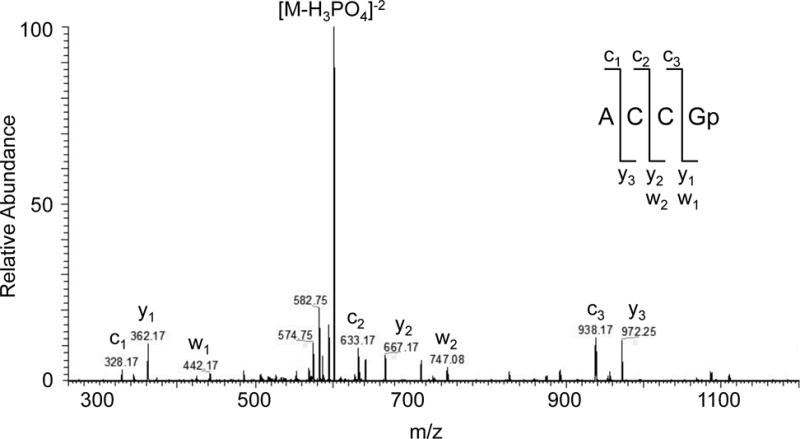
Tandem mass spectrum of RNase T1 digestion product from human placenta ttRNA. MS/MS annotation is consistent with the sequence ACCGp.
Because the genomic tRNA sequence is available, the identified 3′-end can be used as a sequence tag to search the genomic tRNA sequence and identify the expected (unmodified) RNase T1 digestion product. At that stage, one can use the available MS calculators (Section 2.4) to generate predicted MS/MS fragment ions for the RNase T1 digestion product incorporating the modified nucleosides found in the nucleoside analysis step. Modifications are mapped when the predicted MS/MS fragments ions can be matched in the experimental data using the criteria described above (Section 2.4). Alternatively, one can use the residue masses of the modified nucleosides in addition to the residue masses of the canonical nucleosides to build the complete RNase digestion product sequence with mapped modifications [37].
Figure 4 is an example of an atypical tandem mass spectrum from an RNase T1 digestion product of T. thermophilus tRNAAsn. As noted above, during CID the weakest bond fragments easiest, which usually results in the loss of the 3′-phosphate from RNase T1 digestion products, yielding [M-98] as the most abundant ion in the MS/MS spectrum. In this example, however, the RNase T1 digestion product yields an abundant fragment ion corresponding to the loss of C5H9NO4 (147 Th) generating m/z 1122 as the most abundant ion in the mass spectrum. When the most abundant fragment is not described by phosphate loss (−98 Th) or is less than the mass of any of the canonical nucleosides, one can anticipate that the fragment arises from a labile side chain of a modified nucleoside. Table 1 lists side chain fragment masses. As noted there, the loss of 147 is consistent with the modified nucleoside N6-threonylcarbamoyladenosine (t6A). Thus, sequence mapping will have to account for this modified nucleoside, how it may fragment, plus any other modifications that may be present. With experience, mapping modifications onto a single tRNA sequence is feasible by the manual approach described above. However, the introduction of new software tools [26, 27, 38, 39] has simplified and automated most of these sequence reconstruction and modification mapping steps. Pretreating the oligonucleotides to remove the terminal phosphate in a T1 digestion increases the fragmentation pattern in the tandem mass spectrum [40], which increases the number of recognition elements for software analysis. The use of the exclusion list during LC-MS/MS of RNase digestion products enriches the MS/MS data set in digestion products whose m/z values do not correspond to ions without modifications, excepting pseudouridine. As pseudouridine is an isomer of uridine, the mass of the modified nucleoside is equivalent to the canonical uridine mass. The approaches described above cannot reveal the location of pseudouridine, and alternative strategies are necessary [41].
Figure 4.
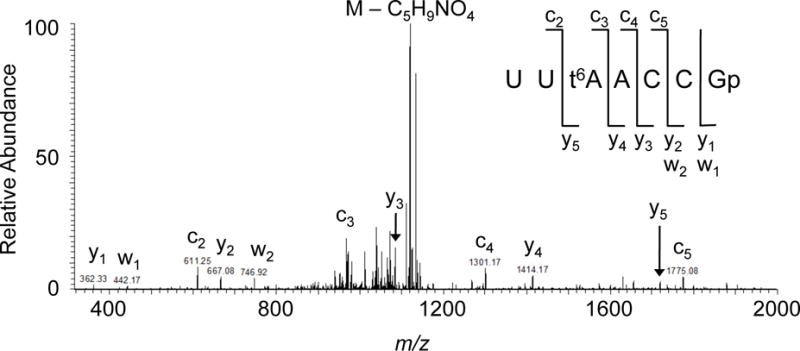
Tandem mass spectrum of RNase T1 digestion product from T. thermophilus tRNAAsn. MS/MS annotation is consistent with the sequence UU[t6A]ACCGp. The most abundant peak in the spectrum is the loss of the t6A side chain (Table 1).
Table 1.
Neutral loss occurs when a labile nucleobase fragments instead of the phosphodiester backbone. The neutral losses in this table are those that have been found to dominate MS/MS spectra when present in oligoribonucleotides, often making sequence determination difficult. Key: m7G – 7-methylguanosine; k2C – lysidine; Q – queuosine; oQ – epoxyqueuosine; t6A – N6-threonylcarbamoyladenosine
| Ion | Neutral Loss (u) |
|---|---|
| PO3H2 | 80.974 |
| [m7G] | 165.065 |
| [k2C] | 144.090 |
| [Q] | 115.064 |
| [oQ] | 131.058 |
| [t6A] | 147. 053/162.064 |
Once the digestion products have been analyzed from RNase T1, a second digestion should then be performed using a different RNase. By using multiple base-specific RNases, higher RNA sequence coverage results enabling verification of initial modification mapping results from RNase T1. Table 2 shows the sequence placement of the modifications identified in a purified tRNAAsn from Thermus thermophilus HB27 with the guanosine at position 7 underlined. It is known that ribonuclease T1 will cleave after m2G [35] so the identification of this guanosine would be lost if only RNase T1 data was evaluated. A look at the published tRNA sequences for T. thermophilus HB27 on the Modomics website shows that in tRNAPhe the guanosine at position seven is m2G. Since many of the other modifications in the published sequences have homology, a separate digestion with a different nucleobase specificity allows the identification of the position, here an unmodified guanosine (Figure 5).
Table 2.
The RNase T1 and A sequence map for T. thermophilus HB27 tRNAASN. Position 7 guanosine, bold and underlined, would be unidentified by using just RNase T1.
| tRNA Sequence | Enzyme | % Coverage | Sequence |
|---|---|---|---|
| (1 – 39) | UCCGCGG[s4U]AGCUCAGCA[Gm]GUAGAGCAGCCGG[Cm]UGUU[t6A]AC | ||
| RNase T1 | 92 | UCCGCG [s4U]AGCUCAGCA[Gm]GUAGAGCAGCCG [Cm]UGUU[t6A]AC | |
| 78 | GCGG[s4U]AGC CAGCA[Gm]GUAGAGCAGC GG[Cm] GU [t6A]AC | ||
|
| |||
| (40 – 76) | CGGUAG[m7G]UCGCAGG[m5s2U]UCG[m1A] GUCCUGCCCGCGGAGCCA | ||
| RNase T1 | CG UAG UCGCAG [m5s2U]UCG[m1A]GUCCUGCCCGCG AGCCA | ||
| RNase A | CGGUAG[m7G]U GCAGG[m5s2U]U G[m1A]GU GCGGAGC | ||
Figure 5.
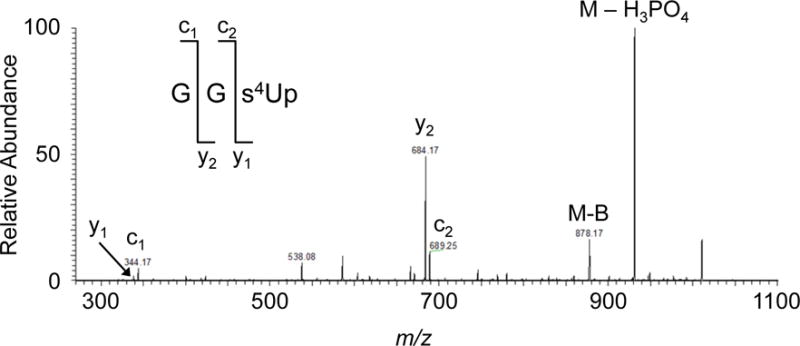
Tandem mass spectrum of RNase A digestion product from T. thermophilus tRNAAsn. MS/MS annotation is consistent with the sequence GG[s4U]p. Standard modification mapping takes advantage of overlaps to increase sequence coverage and confirm modification placement (Table 2).
4. Conclusion
Understanding the biological role of tRNA modifications remains challenging given the relatively few tRNA sequences with completely mapped modifications at the organism level. The recent advances in mass spectrometry technologies and software now enable the routine sequence mapping of modifications from much less material than in the past. While strategies have been developed to map modifications at the level of ttRNA [23, 36, 42–45], the use of biotinylated probes for (single) tRNA capture, RNase digestion and LC-MS/MS remains the gold standard for structural characterization at a high level of confidence. As illustrated here, starting from routine amounts of cells, both the complete nucleoside profile and sequence modification map of a previously uncharacterized tRNA, T. thermophilus tRNAAsn, is feasible with nearly 100% sequence coverage. Additional strategies for single tRNA purification, especially approaches that allow in-line purification [46], can further reduce the sample preparation steps ahead of RNA modification mapping. As emerging high-throughput technologies reveal modification patterns at the global stage [47, 48], methods such as that described here will remain important validation tools. Further advances in technology that reduce sample requirements will be key in keeping mass spectrometry compatible with sampling amounts used for high-throughput studies.
Acknowledgments
The authors would like to thank Prof. B. Addepalli and other members of the laboratory for their helpful discussions. Funding for this research was provided by the National Science Foundation (CHE1507357), the National Institutes of Health (GM058843) and a University of Cincinnati Department of Chemistry RITE Award to R.R.
Footnotes
Publisher's Disclaimer: This is a PDF file of an unedited manuscript that has been accepted for publication. As a service to our customers we are providing this early version of the manuscript. The manuscript will undergo copyediting, typesetting, and review of the resulting proof before it is published in its final citable form. Please note that during the production process errors may be discovered which could affect the content, and all legal disclaimers that apply to the journal pertain.
Submitted to Methods as an invited contribution to Special Issue on Nucleic Acids
References
- 1.Cantara WA, Crain PF, Rozenski J, McCloskey JA, Harris KA, Zhang X, Vendeix FA, Fabris D, Agris PF. Nucleic Acids Res. 2011;39:D195–201. doi: 10.1093/nar/gkq1028. [DOI] [PMC free article] [PubMed] [Google Scholar]
- 2.Machnicka MA, Milanowska K, Osman Oglou O, Purta E, Kurkowska M, Olchowik A, Januszewski W, Kalinowski S, Dunin-Horkawicz S, Rother KM, Helm M, Bujnicki JM, Grosjean H. Nucleic Acids Res. 2013;41:D262–267. doi: 10.1093/nar/gks1007. [DOI] [PMC free article] [PubMed] [Google Scholar]
- 3.Miles ZD, McCarty RM, Molnar G, Bandarian V. Proceedings of the National Academy of Sciences of the United States of America. 2011;108:7368–7372. doi: 10.1073/pnas.1018636108. [DOI] [PMC free article] [PubMed] [Google Scholar]
- 4.Helm M, Alfonzo JD. Chemistry & biology. 2014;21:174–185. doi: 10.1016/j.chembiol.2013.10.015. [DOI] [PMC free article] [PubMed] [Google Scholar]
- 5.Jackman JE, Alfonzo JD. Wiley interdisciplinary reviews RNA. 2012;4:35–48. doi: 10.1002/wrna.1144. [DOI] [PMC free article] [PubMed] [Google Scholar]
- 6.Phizicky EM, Alfonzo JD. FEBS letters. 2010;584:265–271. doi: 10.1016/j.febslet.2009.11.049. [DOI] [PMC free article] [PubMed] [Google Scholar]
- 7.Agris P. RNA. 2015;21:552–554. doi: 10.1261/rna.050575.115. [DOI] [PMC free article] [PubMed] [Google Scholar]
- 8.Kirchner S, Ignatova Z. Nat Rev Genet. 2015;16:98–112. doi: 10.1038/nrg3861. [DOI] [PubMed] [Google Scholar]
- 9.Blobstein SH, Grunberger D, Weinstein IB, Nakanishi K. Biochemistry. 1973;12:188–193. doi: 10.1021/bi00726a002. [DOI] [PubMed] [Google Scholar]
- 10.Harada F, Nishimura S. Biochemistry. 1974;13:300–307. doi: 10.1021/bi00699a011. [DOI] [PubMed] [Google Scholar]
- 11.Muramatsu T, Yokoyama S, Horie N, Matsuda A, Ueda T, Yamaizumi Z, Kuchino Y, Nishimura S, Miyazawa T. Journal of Biological Chemistry. 1988;263:9261–9267. doi: 10.1351/pac198961030573. [DOI] [PubMed] [Google Scholar]
- 12.Su D, Chan CTY, Gu C, Lim KS, Chionh YH, McBee ME, Russell BS, Babu IR, Begley TJ, Dedon PC. Nat Protocols. 2014;9:828–841. doi: 10.1038/nprot.2014.047. [DOI] [PMC free article] [PubMed] [Google Scholar]
- 13.Crain PF. Methods in Enzymology. 1990;193:782–790. doi: 10.1016/0076-6879(90)93450-y. [DOI] [PubMed] [Google Scholar]
- 14.Pomerantz SC, McCloskey JA. Methods in Enzymology. 1990;193:796–824. doi: 10.1016/0076-6879(90)93452-q. [DOI] [PubMed] [Google Scholar]
- 15.Russell SP, Limbach PA. Journal of chromatography. B, Analytical technologies in the biomedical and life sciences. 2013;923–924:74–82. doi: 10.1016/j.jchromb.2013.02.010. [DOI] [PMC free article] [PubMed] [Google Scholar]
- 16.Sanger F, Brownlee GG, Barrell BG. Journal of Molecular Biology. 1965;13:373–IN374. doi: 10.1016/s0022-2836(65)80104-8. [DOI] [PubMed] [Google Scholar]
- 17.Kowalak JA, Pomerantz SC, Crain PF, McCloskey JA. Nucleic Acids Research. 1993;21:4577–4585. doi: 10.1093/nar/21.19.4577. [DOI] [PMC free article] [PubMed] [Google Scholar]
- 18.Douthwaite S, Kirpekar F. Methods Enzymol. 2007;425:1–20. doi: 10.1016/S0076-6879(07)25001-3. [DOI] [PubMed] [Google Scholar]
- 19.Matthiesen R, Kirpekar F. Nucleic Acids Res. 2009;37:e48. doi: 10.1093/nar/gkp139. [DOI] [PMC free article] [PubMed] [Google Scholar]
- 20.Degryse E, Glansdorff N, Piérard A. Arch Microbiol. 1978;117:189–196. doi: 10.1007/BF00402307. [DOI] [PubMed] [Google Scholar]
- 21.Sambrook J, Russell DW. Molecular Cloning: A Laboratory Manual, Cold Spring Harbor Laboratory Press. 2001 [Google Scholar]
- 22.Alings F, Sarin LP, Fufezan C, Drexler HCA, Leidel SA. RNA. 2015;21:202–212. doi: 10.1261/rna.048199.114. [DOI] [PMC free article] [PubMed] [Google Scholar]
- 23.Cao X, Limbach PA. Analytical Chemistry. 2015;87:8433–8440. doi: 10.1021/acs.analchem.5b01826. [DOI] [PMC free article] [PubMed] [Google Scholar]
- 24.Xu H, Freitas MA. BMC bioinformatics. 2007;8:133. doi: 10.1186/1471-2105-8-133. [DOI] [PMC free article] [PubMed] [Google Scholar]
- 25.Lowe TM, Eddy SR. Nucleic Acids Research. 1997;25:0955–0964. doi: 10.1093/nar/25.5.955. [DOI] [PMC free article] [PubMed] [Google Scholar]
- 26.Nakayama H, Takahashi N, Isobe T. Mass Spectrom Rev. 2011;30:1000–1012. doi: 10.1002/mas.20325. [DOI] [PubMed] [Google Scholar]
- 27.Sample PJ, Gaston KW, Alfonzo JD, Limbach PA. Nucleic Acids Research. 2015;43:e64. doi: 10.1093/nar/gkv145. [DOI] [PMC free article] [PubMed] [Google Scholar]
- 28.McLuckey S, Berkel G, Glish G. J Am Soc Mass Spectrom. 1992;3:60–70. doi: 10.1016/1044-0305(92)85019-G. [DOI] [PubMed] [Google Scholar]
- 29.Wong SY, Javid B, Addepalli B, Piszczek G, Strader MB, Limbach PA, Barry CE., 3rd Antimicrobial agents and chemotherapy. 2013;57:6311–6318. doi: 10.1128/AAC.00905-13. [DOI] [PMC free article] [PubMed] [Google Scholar]
- 30.Machnicka MA, Milanowska K, Osman Oglou O, Purta E, Kurkowska M, Olchowik A, Januszewski W, Kalinowski S, Dunin-Horkawicz S, Rother KM, Helm M, Bujnicki JM, Grosjean H. Nucleic Acids Research. 2013;41:D262–D267. doi: 10.1093/nar/gks1007. [DOI] [PMC free article] [PubMed] [Google Scholar]
- 31.Agris P, Crain P, Rozenski J, Fabris D, Vendeix F. 2016 [Google Scholar]
- 32.Pomerantz SC, Kowalak JA, McCloskey JA. J Am Soc Mass Spectrom. 1993;4:204–209. doi: 10.1016/1044-0305(93)85082-9. [DOI] [PubMed] [Google Scholar]
- 33.Addepalli B, Lesner NP, Limbach PA. RNA. 2015;21:1746–1756. doi: 10.1261/rna.052472.115. [DOI] [PMC free article] [PubMed] [Google Scholar]
- 34.Houser WM, Butterer A, Addepalli B, Limbach PA. Analytical Biochemistry. 2015;478:52–58. doi: 10.1016/j.ab.2015.03.016. [DOI] [PubMed] [Google Scholar]
- 35.Mengel-Jørgensen J, Kirpekar F. Nucleic Acids Research. 2002;30:e135–e135. doi: 10.1093/nar/gnf135. [DOI] [PMC free article] [PubMed] [Google Scholar]
- 36.Wetzel C, Limbach PA. Analyst. 2016;141:16–23. doi: 10.1039/c5an01797a. [DOI] [PMC free article] [PubMed] [Google Scholar]
- 37.Rozenski J, McCloskey JA. J Am Soc Mass Spectrom. 2002;13:200–203. doi: 10.1016/S1044-0305(01)00354-3. [DOI] [PubMed] [Google Scholar]
- 38.Nakayama H, Akiyama M, Taoka M, Yamauchi Y, Nobe Y, Ishikawa H, Takahashi N, Isobe T. Nucleic Acids Research. 2009;37:e47. doi: 10.1093/nar/gkp099. [DOI] [PMC free article] [PubMed] [Google Scholar]
- 39.Nyakas A, Blum LC, Stucki SR, Reymond JL, Schürch S. J Am Soc Mass Spectrom. 2013;24:249–256. doi: 10.1007/s13361-012-0529-1. [DOI] [PubMed] [Google Scholar]
- 40.Krivos KL, Addepalli B, Limbach PA. Rapid communications in mass spectrometry : RCM. 2011;25:3609–3616. doi: 10.1002/rcm.5266. [DOI] [PubMed] [Google Scholar]
- 41.Durairaj A, Limbach PA. Anal Chim Acta. 2008;623:117–125. doi: 10.1016/j.aca.2008.06.027. [DOI] [PMC free article] [PubMed] [Google Scholar]
- 42.Li S, Limbach PA. Analytical Chemistry. 2012;84:8607–8613. doi: 10.1021/ac301638c. [DOI] [PubMed] [Google Scholar]
- 43.Wetzel C, Limbach PA. Journal of Proteomics. 2012;75:3450–3464. doi: 10.1016/j.jprot.2011.09.015. [DOI] [PubMed] [Google Scholar]
- 44.Li S, Limbach PA. Analyst. 2013;138:1386–1394. doi: 10.1039/c2an36515d. [DOI] [PubMed] [Google Scholar]
- 45.Wetzel C, Limbach PA. Analyst. 2013;138:6063–6072. doi: 10.1039/c3an01224g. [DOI] [PubMed] [Google Scholar]
- 46.Miyauchi K, Ohara T, Suzuki T. Nucleic acids research. 2007;35:e24. doi: 10.1093/nar/gkl1129. [DOI] [PMC free article] [PubMed] [Google Scholar]
- 47.Cozen AE, Quartley E, Holmes AD, Hrabeta-Robinson E, Phizicky EM, Lowe TM. Nature Methods. 2015;12:879–884. doi: 10.1038/nmeth.3508. [DOI] [PMC free article] [PubMed] [Google Scholar]
- 48.Hauenschild R, Tserovski L, Schmid K, Thüring K, Winz M-L, Sharma S, Entian K-D, Wacheul L, Lafontaine DLJ, Anderson J, Alfonzo J, Hildebrandt A, Jäschke A, Motorin Y, Helm M. Nucleic Acids Research. 2015:gkv895. doi: 10.1093/nar/gkv895. [DOI] [PMC free article] [PubMed] [Google Scholar]