

Abstract
Background
Metabolic impairment is an important contributor to heart failure (HF) pathogenesis and progression. Dysregulated metabolic pathways remain poorly characterized in patients with HF and preserved ejection fraction (HFpEF). We sought to determine metabolic abnormalities in HFpEF and identify pathways differentially altered in HFpEF versus HF with reduced ejection fraction (HFrEF).
Methods and Results
We identified HFpEF cases, HFrEF controls, and no‐HF controls from the CATHGEN study of sequential patients undergoing cardiac catheterization. HFpEF cases (N=282) were defined by left ventricular ejection fraction (LVEF) ≥45%, diastolic dysfunction grade ≥1, and history of HF; HFrEF controls (N=279) were defined similarly, except for having LVEF <45%. No‐HF controls (N=191) had LVEF ≥45%, normal diastolic function, and no HF diagnosis. Targeted mass spectrometry and enzymatic assays were used to quantify 63 metabolites in fasting plasma. Principal components analysis reduced the 63 metabolites to uncorrelated factors, which were compared across groups using ANCOVA. In basic and fully adjusted models, long‐chain acylcarnitine factor levels differed significantly across groups (P<0.0001) and were greater in HFrEF than HFpEF (P=0.0004), both of which were greater than no‐HF controls. We confirmed these findings in sensitivity analyses using stricter inclusion criteria, alternative LVEF thresholds, and adjustment for insulin resistance.
Conclusions
We identified novel circulating metabolites reflecting impaired or dysregulated fatty acid oxidation that are independently associated with HF and differentially elevated in HFpEF and HFrEF. These results elucidate a specific metabolic pathway in HF and suggest a shared metabolic mechanism in HF along the LVEF spectrum.
Keywords: fatty acid oxidation, heart failure, metabolism, metabolomics, mitochondrial dysfunction
Subject Categories: Heart Failure, Metabolism, Translational Studies
Introduction
Heart failure (HF) is a complex clinical syndrome affecting 5.7 million people in the United States.1 Over the past 2 decades, the proportion of patients with HF and preserved ejection fraction (HFpEF) has increased relative to HF with reduced ejection fraction (HFrEF).2, 3 Currently, HFpEF comprises approximately half of the HF population and has morbidity and mortality on par with HFrEF.4, 5 A major public health burden, HFpEF may become the predominant form of HF in the future.1, 2, 4
Despite its epidemiological importance, there are no proven effective therapies for reducing morbidity or mortality in HFpEF; evidence‐based interventions are limited to conventional therapies for symptom relief and comorbidity management.6 An important obstacle to therapeutic development is poor understanding of HFpEF pathogenesis and pathophysiology.7, 8, 9 Thus, elucidating molecular mechanisms and identifying novel therapeutic targets in HFpEF are critical unmet needs in cardiovascular medicine.6, 10
Initially, mechanistic investigations in HFpEF centered on myocardial abnormalities, such as diastolic dysfunction and left ventricular hypertrophy, and traditional HF risk factors, such as hypertension and neurohormonal activation. In recent years, greater attention has been focused on systemic mediators, such as oxidative stress, inflammation, and mitochondrial dysfunction.8, 9, 11 Emerging evidence is also reviving interest in metabolic impairment as a contributor to HFpEF development and progression.8, 9, 12, 13 However, these investigations have largely been conducted in animal models; there is a paucity of data characterizing metabolism in human HFpEF.
Metabolomic profiling is an ideal tool for filling this knowledge gap, given that it allows for simultaneous quantification of a wide variety of molecular intermediates from multiple major bioenergetic pathways.14, 15, 16 Thus, in this investigation, we performed targeted, quantitative metabolomic profiling on a cohort of patients with HFpEF and compared profiles to patients with HFrEF and controls without HF. Our primary objective was to determine metabolic abnormalities in HFpEF and identify pathways differentially altered in HFpEF versus HFrEF.
Methods
Study Population
Our study population was selected from the CATHGEN biorepository, which contains clinical data and biological specimens from 9334 patients who underwent cardiac catheterization at Duke University Medical Center (Durham, NC) between January 2001 and December 2010. Details about the CATHGEN biorepository have been previously published.17, 18 After obtaining written informed consent, peripheral blood samples were collected from each patient in EDTA tubes by femoral artery sheath before heparin administration. Samples were immediately cooled to 4°C, centrifuged for 30 minutes to separate plasma, and frozen at −80°C. All patients had been fasting for at least 6 hours before sample collection. As part of the biorepository, targeted quantitative metabolomic profiling has been performed on ≈4000 individuals.
From these CATHGEN subjects, we identified HFpEF cases, HFrEF controls, and controls without HF or diastolic dysfunction (no‐HF controls). HFpEF cases were defined by left ventricular ejection fraction (LVEF) ≥45%, diastolic dysfunction grade ≥1, and history of HF.6, 19, 20 HFrEF controls were defined by LVEF <45%, diastolic dysfunction grade ≥1, and history of HF. No‐HF controls were defined by LVEF ≥45%, normal diastolic function, and no history of HF. Patients were excluded from analysis if they had a history of congenital heart disease, moderate‐to‐severe valvular disease on echocardiography, cardiac transplantation, or end‐stage renal disease.
Given plurality of HFpEF definitions in professional guidelines and in clinical trials,6, 10, 19, 20, 21, 22, 23, 24, 25 we sought to determine whether results would change significantly with variations of inclusion criteria. Thus, we modified case‐control definitions for exploratory sensitivity analyses: Inclusion criteria for the first set of sensitivity cohorts retained all specifications described above, but also required presence or absence of objective HF indicators (elevated n‐terminal prohormone of brain natriuretic peptide >400 pg/mL, loop diuretic use, or HF International Classification of Diseases, Ninth Revision code) and excluded all patients with major adverse cardiac events (defined as myocardial infarction consistent with the universal definition,26 percutaneous coronary intervention, or coronary artery bypass grafting) 1 month before sample collection. Inclusion criteria for the second set of sensitivity cohorts varied only in its LVEF thresholds: HFpEF and no‐HF groups had LVEF ≥50% and HFrEF had LVEF <35%. Detailed case‐control descriptions are provided in Data S1.
Clinical Phenotyping
Cardiologists providing clinical care at the time of catheterization determined history of HF. Estimates of LVEF were obtained using a ventriculogram at time of cardiac catheterization; if a ventriculogram was not performed, then echocardiogram, nuclear, or cardiac MRI studies within 60 days of sample collection were used. Diastolic function was obtained from echocardiographic assessments made during routine clinical care. To ensure accuracy of previous assessments, a blinded overread of diastolic function in 10% of the study population was performed by cardiologists specializing in echocardiography (S.H.S. amd M.G.K.; Data S2; Table S1).27 Baseline demographics and clinical characteristics of the study population were collected by the Duke Databank for Cardiovascular Disease using previously described methods.28 Objective indicators of HF history used for sensitivity analyses were generated during routine clinical care and extracted by automated search of medical records. Insulin resistance (IR) was measured for sensitivity analyses using the Lipoprotein Insulin Resistance Index (LP‐IR), a validated IR score having strong associations with glucose disposal rates and homeostasis model assessment of IR in the Multi‐Ethnic Study of Atherosclerosis (see Data S3 for additional details).29 This research was approved by the Duke University Institutional Review Board.
Laboratory Methods
Tandem flow‐injection targeted mass spectrometry (MS/MS) was used to quantify levels of 60 metabolites in each plasma sample: 45 acylcarnitines and 15 amino acids (full metabolite list in Data S4 and Table S2). Absolute quantification of the metabolites was performed using stable isotope dilution as we have done previously.30, 31 Three conventional metabolites (ketones, nonesterified fatty acids, and 3‐hydroxybutyrate) were assayed using a Beckman‐Coulter DXC600 analyzer and reagents from Wako Chemicals (Richmond, VA). More‐detailed methodology and coefficients of variation have been previously reported.32, 33, 34, 35, 36 Metabolite measurements were performed at the Sarah W. Stedman Nutrition Center and Metabolomics Core Laboratory at the Duke Molecular Physiology Institute. IR scores were derived from lipoprotein particle measurements, which were obtained using nuclear magnetic resonance spectroscopy at LipoScience Incorporated (Raleigh, NC).29, 37 Team members were blinded to group status and samples were randomly distributed to mitigate biases.
Statistical Analysis
Metabolites with >25% of values below the lower limit of quantification were excluded from analysis (hexanoyl carnitine, pimelyl‐l‐carnitine). Three subjects had missing values for ketone metabolites and free fatty acids, which were imputed with full cohort mean values. All metabolites failed formal tests of normality and were log transformed to approximate normal distributions when used in linear regression models.
The 63 plasma metabolites measured for each subject reside in overlapping biological pathways and are thus potentially correlated. To identify metabolite correlations and reduce the burden of multiple comparisons, we performed principal components analysis (PCA) with varimax rotation.38, 39 To aid in factor selection, we used the Kaiser criterion, which retains all factors with eigenvalues greater than 1.0.40 This reduced the full set of 63 metabolites into 14 uncorrelated factors, which altogether explained 44.6% of the data variance. Individual metabolites with absolute value of factor load ≥0.4 are reported as composing a given factor, as is commonly done based on convention.30, 41, 42, 43 To facilitate factor comparisons across groups, general linear models were constructed: “basic” models (adjusted for age, race, and sex) and “fully adjusted” models (adjusted for age, race, sex, body mass index [BMI], diabetes mellitus, hypertension, dyslipidemia, smoking, glomerular filtration rate [GFR], batch, and number of diseased coronary arteries [number of epicardial vessels with ≥75% stenosis graded by 2 observers at the time of catheterization]).
Metabolite factor levels were compared across groups using ANCOVA with Bonferroni‐corrected significance of P<0.0036 given 14 factor comparisons. Significant metabolite factors were then compared between groups using pair‐wise contrasts generated from the fully adjusted ANCOVA. Individual analytes composing significant metabolite factors were compared across groups using ANCOVA; metabolites reaching Bonferroni corrected significance (0.05 divided by the number of metabolite comparisons) were compared between groups using pair‐wise contrasts. Significance threshold for all between‐group pairwise contrasts was set at P<0.05 to limit type 2 error in the setting of Bonferroni‐corrected omnibus tests and multiple confirmatory analyses. Unadjusted correlations were evaluated using Spearman's rho. Statistical analyses were performed by D.M.C. and W.G.H. with SAS software (version 9.4; SAS Institute Inc., Cary, NC). All authors had access to the data, take responsibility for its integrity, and have agreed to the manuscript as written.
Results
Baseline Characteristics of the Study Population
Table 1 presents the baseline demographic and clinical characteristics of the study population. When compared to HFrEF controls, HFpEF cases were older (mean age, years: 66±12 vs 61±13), more likely to be women (42% vs 30%), have lower GFR (mean GFR, mL/min per 1.73 m2: 64±25 vs 66±23), higher BMI (mean BMI, kg/m2: 31±7 vs 29±8), and more likely to have traditional cardiovascular risk factors, such as hypertension (75% vs 67%), diabetes mellitus (39% vs 37%), and dyslipidemia (60% vs 58%). In contrast, patients with HFrEF were more likely than those with HFpEF to have severe coronary artery disease (CAD; 38% vs 23%) and smoke (51% vs 48%). These characteristics were in alignment with those from major epidemiological studies, thus supporting generalizability of our HFpEF and HFrEF cohorts to broader populations.44, 45
Table 1.
Baseline Patient Characteristics
| HFrEF (N=279) | HFpEF (N=282) | No‐HF (N=191) | P Valuea | |
|---|---|---|---|---|
| Age, y | 61 (13) | 66 (12) | 55 (13) | <0.0001 |
| Sex, male | 70% | 58% | 61% | 0.02 |
| BMI, kg/m2 | 29 (8) | 31 (7) | 30 (7) | 0.007 |
| Race | ||||
| Caucasian | 66% | 70% | 80% | 0.06 |
| African American | 30% | 27% | 17% | |
| Hispanic | 3% | 1% | 1% | |
| Other | 1% | 2% | 2% | |
| LVEF, % | 28 (9) | 58 (8) | 58 (7) | <0.0001 |
| GFR, mL/min per 1.73 m2 | 66 (23) | 64 (25) | 84 (23) | <0.0001 |
| Hypertension | 67% | 75% | 56% | 0.001 |
| Diabetes mellitus | 37% | 39% | 18% | <0.0001 |
| Diseased coronary vesselsb | ||||
| 0 | 33% | 43% | 45% | <0.0001 |
| 1 | 16% | 19% | 22% | |
| 2 | 14% | 15% | 17% | |
| 3 | 38% | 23% | 16% | |
| Dyslipidemia | 58% | 60% | 52% | 0.32 |
| Smoking | 51% | 48% | 41% | 0.26 |
Values are % or mean±SD. BMI indicates body mass index; GFR, estimated glomerular filtration rate; HFpEF, heart failure with preserved ejection fraction; HFrEF, heart failure with reduced ejection fraction; LVEF, left ventricular ejection fraction.
P values calculated using chi‐square tests or Kruskal–Wallis tests, as appropriate.
Coronary vessel diseased if stenosed >75% when visualized on coronary angiography.
Plasma levels of the N‐terminal prohormone of brain natriuretic peptide (NT‐proBNP) were measured as part of routine clinical care for 34% of the overall cohort in the year before sample collection. Median and interquartile (IQR) ranges for each cohort were as follows: HFpEF, 876 pg/mL (IQR, 251–2391); HFrEF, 2641 pg/mL (IQR, 1023–5256); and no‐HF, 136 pg/mL (55–378).
Comparison of Metabolite Factor Levels Between HFpEF, HFrEF, and No‐HF Patients
Fourteen PCA‐derived metabolite factors were identified, clustering in biologically related groupings similar to our previous studies (detailed PCA results in Data S5; Table S3).30, 46 In the basic model, omnibus ANCOVA identified 2 metabolite factors significant at the Bonferroni‐corrected significance threshold (P<0.0036); both were composed of acylcarnitines of varying chain length (Table 2). In the fully adjusted model, the long‐chain acylcarnitine (LCAC) factor remained statistically significant (P<0.0001) at the Bonferroni‐corrected significance threshold. Mean levels of the LCAC factor were significantly greater in HFrEF controls than HFpEF cases (least square means±SD: 0.504±0.161 vs 0.131±0.162; P=0.0004). Both HFrEF and HFpEF LCAC factor levels were significantly greater than no‐HF controls (−0.245±0.173; P<0.0001 and P=0.003 for comparisons with HFrEF and HFpEF, respectively).
Table 2.
Metabolite Factor Means and Comparisons Between HFpEF, HFrEF, and No‐HF Controls
| Factor | Description | ANCOVAa | Pair‐wise Comparisonsb | Metabolite Factor Mean Valuesc | |||||
|---|---|---|---|---|---|---|---|---|---|
| Basicd | Fully Adjustede | HFrEF vs HFpEF | HFrEF vs No‐HF | HFpEF vs No‐HF | HFrEF (N=273) | HFpEF (N=263) | No‐HF (N=180) | ||
| 1 | Medium‐chain acylcarnitines | 0.04 | 0.13 | ||||||
| 2 | Long‐chain dicarboxyl‐acylcarnitines | 0.008 | 0.04 | 0.05 | 0.30 | 1.00 | 0.339 (0.176) | 0.084 (0.178) | 0.136 (0.190) |
| 3 | Short‐chain dicarboxyl‐acylcarnitines | 0.005 | 0.07 | ||||||
| 4 | Long‐chain acylcarnitines | <0.0001 | <0.0001 | 0.0004 | <0.0001 | 0.003 | 0.504 (0.161) | 0.131 (0.162) | −0.245 (0.173) |
| 5 | Ketones and related metabolites | 0.13 | 0.15 | ||||||
| 6 | C8–C10 acylcarnitines | 0.0001 | 0.09 | ||||||
| 7 | BCAA and related metabolites | 0.04 | 0.005 | 0.03 | 0.01 | 1.00 | 0.041 (0.148) | −0.187 (0.150) | −0.254 (0.160) |
| 8 | Various amino acids | 0.14 | 0.07 | ||||||
| 9 | Short‐chain acylcarnitines | 0.13 | 0.95 | ||||||
| 10 | Asparagine, aspartate, 3‐hydroxyisovaleryl/malonyl carnitine | 0.17 | 0.11 | ||||||
| 11 | Histidine, arginine, tigylcarnitine, 3‐hydroxylinoleyl/hexadecadienedioyl carnitine | 0.11 | 0.01 | 1.00 | 0.001 | 0.05 | −0.352 (0.111) | −0.320 (0.112) | −0.132 (0.119) |
| 12 | Valine, glutamine, glutamate | 0.008 | 0.004 | 0.03 | 0.008 | 1.00 | −0.447 (0.151) | −0.217 (0.152) | −0.134 (0.162) |
| 13 | Alanine, proline, free fatty acids | 0.02 | 0.03 | 0.40 | 0.02 | 0.60 | 0.125 (0.140) | −0.006 (0.141) | −0.133 (0.151) |
| 14 | Docosanoyl‐carnitine | 0.004 | 0.03 | 1.00 | 0.03 | 0.20 | 0.003 (0.135) | 0.68 (0.137) | 0.247 (0.145) |
BCAA indicates branched‐chain amino acids; C, carbon chain length; HF, heart failure; HFpEF, heart failure with preserved ejection fraction; HFrEF, heart failure with reduced ejection fraction.
Statistical significance in omnibus ANCOVA analyses was P<0.0036, reflecting Bonferroni correction for 14 factor comparisons.
Pair‐wise comparisons for factors significant at Bonferroni corrected threshold test for significant between‐group differences. P values for factors significant at nominal threshold of P<0.05 are reported for exploratory purposes. P values reflect between‐group pair‐wise contrasts generated from the fully adjusted ANCOVA procedure.
Values are least square means, adjusted for all 11 covariates. SEM is provided beneath each value.
P values for basic model, adjusted for age, race, and sex.
P values for full model, adjusted for age, race, sex, body mass index, number of diseased coronary arteries, history of diabetes mellitus, hypertension, dyslipidemia, smoking, glomerular filtration rate, and batch.
Confirmation of LCAC Factor Findings by Analysis of Individual Metabolites
The PCA‐derived LCAC factor was primarily composed of 6 individual LCAC metabolites (Table 3), which all differed significantly among the 3 groups in omnibus ANCOVA analyses (all P≤0.0001), corroborating the overall PCA factor results. Plasma concentrations of all 6 metabolites were greatest in HFrEF, intermediate in HFpEF, and lowest in no‐HF controls. Five of 6 LCAC metabolite concentrations differed significantly between HFpEF and HFrEF; 4 of 6 differed significantly between HFpEF and no‐HF.
Table 3.
Individual Metabolite Means and Comparisons Between HFpEF, HFrEF, and No‐HF Controls
| Metabolites | ANCOVA | Pair‐wise Comparisonsa | Mean Concentration in μmol/Lb | ||||||
|---|---|---|---|---|---|---|---|---|---|
| Structure | Trivial Name | Basicc | Fully Adjustedd | HFrEF vs HFpEF | HFrEF vs No‐HF | HFpEF vs No‐HF | HFrEF (N=273) | HFpEF (N=263) | No‐HF (N=180) |
| C16 | Palmitoyl‐carnitine | <0.0001 | <0.0001 | 0.001 | <0.0001 | 0.0007 | 0.105 (0.04) | 0.097 (0.03) | 0.084 (0.03) |
| C18:2 | Linoleyl‐carnitine | <0.0001 | <0.0001 | <0.0001 | <0.0001 | 0.04 | 0.099 (0.05) | 0.084 (0.04) | 0.072 (0.03) |
| C18:1 | Oleyl‐carnitine | <0.0001 | <0.0001 | <0.0001 | <0.0001 | 0.01 | 0.185 (0.08) | 0.161 (0.07) | 0.137 (0.05) |
| C18 | Stearoyl‐carnitine | <0.0001 | <0.0001 | 0.09 | <0.0001 | 0.007 | 0.050 (0.02) | 0.047 (0.02) | 0.041 (0.02) |
| C16:1‐OH/C14:1‐DC | 3‐hydroxy‐palmitoleoyl‐carnitine or cis‐5‐tetradecenedioyl‐carnitine | <0.0001 | <0.0001 | 0.002 | <0.0001 | 0.21 | 0.011 (0.01) | 0.010 (0.005) | 0.009 (0.004) |
| C20:4 | Arachidinoyl‐carnitine | <0.0001 | <0.0001 | 0.0007 | <0.0001 | 0.49 | 0.010 (0.01) | 0.008 (0.01) | 0.007 (0.004) |
C indicates carbon chain length; HF, heart failure; HFpEF, heart failure with preserved ejection fraction; HFrEF, heart failure with reduced ejection fraction.
P values reflect between‐group pair‐wise contrasts generated from the fully adjusted ANCOVA.
Values are unadjusted mean concentrations. SD is provided beneath each value.
P values for basic model, adjusted for age, race, and sex.
P values for full model, adjusted for age, race, sex, body mass index, number of diseased coronary arteries, and history of diabetes mellitus, hypertension, dyslipidemia, smoking, glomerular filtration rate, and batch.
Sensitivity Analyses of LCAC Factor
The significant difference observed across groups in LCAC factor levels was confirmed in 3 sensitivity analyses: (1) more strictly defined cohorts using additional objective inclusion criteria to confirm presence or absence of clinical HF; (2) alternate LVEF inclusion criteria with HFpEF and no‐HF groups having LVEF ≥50% and HFrEF having LVEF <35%; and (3) adjustment for IR as an additional or surrogate covariate (replacing “history of diabetes mellitus”). In all sensitivity analyses, LCAC factor levels were highest in HFrEF, intermediate in HFpEF, and lowest in no‐HF (Datas S1 and S3; Tables S4 through S9), again corroborating the overall results. When compared to the primary analysis, the alternative LVEF threshold and IR sensitivity analyses showed greater HFpEF‐HFrEF differences (all P≤0.0002). Differences between HFpEF and no‐HF LCAC factor levels were similar in all analyses (P=0.003–0.004).
To provide further confirmation and insight into LCAC factor findings, we combined the primary HFpEF and HFrEF groups into a single HF cohort and stratified patients into 5 groups by LVEF (≥50%, 40–49%. 30–39%, 20–29%, and <20%). We observed a significant linear trend of increasing LCAC levels by decreasing LVEF that persisted after adjustment for 10 clinical covariables (group factor means in fully adjusted model by descending LVEF: 0.20, 0.07, 0.41, 0.57, and 0.83, respectively; trend, P<0.0001).
Discussion
Using targeted, quantitative metabolomic profiling in a large cohort of HFpEF cases with relevant HFrEF and no‐HF controls, we successfully identified a group of circulating metabolites that were significantly elevated in HFpEF and HFrEF when compared to no‐HF controls, and which discriminate HFpEF from HFrEF. These metabolites, LCACs, were significantly higher in HFrEF than HFpEF, increasing linearly with declining LVEF.
This represents the largest study of circulating metabolites in HFpEF to date. Reflecting impaired or dysregulated fatty acid oxidation, the LCAC elevations observed in this investigation implicate a specific metabolic pathway in HF, identify biomarkers revealing extent of myocardial impairment beyond LVEF, and also suggest a shared metabolic mechanism in HF regardless of LVEF.
Cardiac and peripheral organ metabolic impairment have been long recognized as an intrinsic component of HF pathophysiology.47, 48 Although metabolic derangements have been well described in HFrEF patients and animal models, limited data exist characterizing metabolic impairments in HFpEF.8, 9, 13 To our knowledge, only 1 other study has investigated circulating metabolites in patients with HFpEF: Zordoky et al. compared plasma metabolite profiles of 24 patients with HFpEF to 20 with HFrEF and 38 without HF. They identified metabolite profiles providing incremental capacity for distinguishing HFpEF from HFrEF and no‐HF controls over natriuretic peptides alone.49 Despite small sample sizes, their results suggest the existence of circulating metabolite abnormalities in HFpEF that differ in severity from HFrEF. We now confirm this by demonstrating significant and differential elevations of plasma LCAC in HFpEF and HFrEF using cohorts 10‐fold larger in size and additionally controlling for many confounders, such as CAD angiographic phenotype, IR, renal function, and BMI.
Although novel in the setting of HFpEF, elevated plasma LCACs have been found in previous studies of human HFrEF: Cheng et al. demonstrated significant elevations in plasma LCAC in Ammerican College of Cardiology/American Heart Association Stage C HF patients compared to normal controls.50 Interestingly, they also found that Stage A HF patients had plasma LCAC levels higher than normal controls, but lower than Stage C HF patients. Similarly, our group recently found that patients with end‐stage HF had significantly higher plasma LCAC levels than those with chronic, stable HFrEF.51 Furthermore, we demonstrated that greater plasma LCAC levels were independently associated with worse functional status and mortality in chronic stable HFrEF.51 Altogether, the plasma LCAC elevations in HFpEF and HFrEF observed in our study and previous investigations may highlight a shared metabolic impairment characteristic of the HF state. Moreover, plasma LCAC concentrations actually may be indicative of the degree of left ventricular dysfunction or HF decompensation; whether they track longitudinally with changes in cardiac function will require other studies.
Biochemically, LCACs are intermediates in the fatty acid ß‐oxidation pathway.52 Structurally, they are long‐chain fatty acids (LCFA) esterified to carnitine. Functionally, they facilitate transfer of LCFAs into the mitochondria for ß‐oxidation.52 Although typically short‐lived, LCAC accumulate in states of inefficient fatty acid oxidation (FAO), which may be attributed to (1) defects in mitochondrial FAO enzymes or (2) increased FAO relative to tricarboxylic acid (TCA) flux; this leads to a bottleneck of carbon substrates at the TCA cycle.53, 54 Such defects can be caused or exacerbated by IR, which has, in turn, been associated with elevations in plasma LCAC.54, 55, 56, 57 However, we found no correlation between plasma LCAC and IR in this study; this suggests that the observed LCAC elevations were not driven by IR.54, 55, 56, 57 Regardless of the precise cause, LCAC are transported out to the plasma, where they are subsequently metabolized in several tissues (especially skeletal muscle, liver, and heart) or excreted in urine or bile.52, 56, 57 The relative contribution of individual organs to the plasma LCAC pool has not been well characterized in humans; however, animal and cell culture studies suggest that plasma LCAC levels predominantly reflect liver and skeletal muscle secretion as well as renal excretion.56, 57, 58
Despite incomplete understanding of their sources, LCAC are circulating biomarkers reflecting several pathophysiological processes relevant to HF.13 When elevated, plasma LCAC reflect underlying mitochondrial dysfunction and dysregulated carbohydrate/fatty acid metabolism, which have both been recognized as viable therapeutic targets in HF.52, 56, 59, 60 Similarly, elevated plasma LCAC has been used for decades as a screening measure for genetic deficiencies of FAO enzymes.59 Furthermore, elevated plasma LCACs are associated with impaired physical performance in geriatric populations61 and also shown to be predictive of poorer physical function, worsened anemia, and increased cardiovascular mortality in hemodialysis‐dependent patients.62
From a mechanistic standpoint, mounting evidence suggests that plasma LCACs have direct, adverse cellular and physiological effects.63, 64, 65, 66, 67, 68 First, by activating cyclooxygenase‐2 signaling and increasing interleukin‐6 release, LCACs may promote local skeletal muscle inflammation and systemic inflammation, which are both pathophysiological targets in HF.63, 64, 65, 69 Second, LCACs stimulate reactive oxygen species production and promote cellular stress through activation of c‐Jun amino‐terminal kinase, p38 mitogen‐activated protein kinase, and the apoptotic caspase‐3 protein.56, 63 Third, LCACs may promote malignant arrhythmias by (1) modulating deactivation kinetics of voltage‐gated potassium channels and (2) broadly increasing intracellular calcium concentrations by promoting net calcium efflux from the sarcoplasmic reticulum.66, 67, 68 Last, LCACs may not only reflect, but also exacerbate IR by inducing serine phosphorylation of insulin receptor substrate 1.56 Through these actions and potential downstream effects on the cyclic guanosine monophosphate/protein kinase G pathway, elevated LCACs may reflect, promote, or exacerbate myocardial and peripheral pathologies contributing to the HF phenotype (Figure).9
Figure 1.
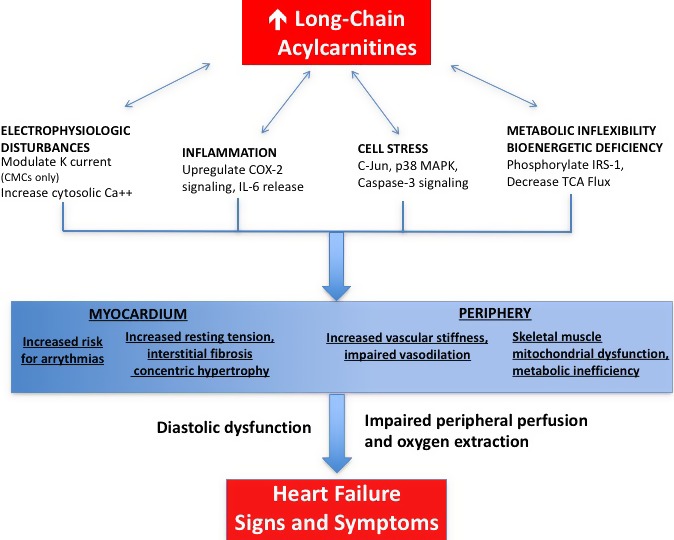
Proposed model for plasma long‐chain acylcarnitine contributions to the heart failure phenotype. Long‐chain acylcarnitines accumulate in tissues and plasma in states of inefficient ß‐oxidation.59 Such accumulation causes electrophysiological disturbances, cell stress, and release of circulating inflammatory mediators.63, 64, 65, 66, 67, 68 These may, in turn, activate the cyclic guanosine monophosphate/protein kinase G pathway, previously implicated in the genesis of ventricular fibrosis and hypertrophy as well as vascular stiffness and impaired vasodilation.9, 56 Through these mechanisms, long‐chain acylcarnitines may contribute to the heart failure phenotype. Ca++ indicates calcium; CMC, cardiomyocyte; COX, cyclooxygenase; IL, interleukin; IRS, insulin receptor substrate; K, potassium; MAPK, mitogen‐associated protein kinase; TCA, tricarboxylic acid.
Study Strengths and Limitations
The findings observed in this study were robust, observed using broad cohort inclusion criteria mirroring day‐to‐day clinical practice6 and confirmed in 3 sensitivity analyses featuring (1) stricter inclusion criteria resembling clinical trials20; (2) alternate LVEF inclusion criteria thresholds; and (3) adjustment for IR as an additional or surrogate covariate (in lieu of diabetes mellitus). In addition, we studied 3 major groups along the HF spectrum; used large cohort sizes compared with previous HF metabolomic analyses; used a targeted metabolomic approach permitting metabolite quantitation; and used state‐of‐the‐art assessment and analytic techniques.18, 30, 31, 32
Nevertheless, there were several limitations. First, this study lacked replication cohorts; however, plasma levels of individual LCAC metabolites in our HFpEF and no‐HF patients were similar to those in corresponding external cohorts from the RELAX trial and the CATHGEN biorepository at large (Data S6; Table S10), thereby supporting generalizability of our results to broader populations. Nevertheless, our findings should be validated in other, well‐defined HFpEF, HFrEF, and no‐HF cohorts. Second, the study population was comprised of patients undergoing cardiac catheterization, which could bias our findings by over‐representation of ischemic phenotypes. We suggest that such bias is unlikely for the following 2 reasons: (1) Results were adjusted for an angiographically determined number of diseased coronary vessels as well as 9 other demographic and clinical risk factors; (2) and the prevalence of CAD in our HF cohorts (57% in HFpEF, 67% in HFrEF) was in alignment with epidemiological estimates.70, 71, 72
The third limitation of this study was that clinical data were obtained from routine care and thus may have suboptimal accuracy. For this reason, we assessed the accuracy of diastolic dysfunction class with a 10% blinded over read by experienced echocardiographers. We found a good concordance between past and present assessments, which justified our use of the routine clinical measurements (Data S2). We did not evaluate the accuracy of all clinical variables (eg, LVEF, number of diseased coronary vessels, clinical history of HF, GFR, or diabetes mellitus); we rather relied on clinical assessments made by Duke cardiologists and the rigorous data collection practices of the Duke Databank for Cardiovascular Disease, which has been used in many previous studies.
Fourth, the use of targeted metabolite profiling allowed for absolute quantitation of metabolite concentrations, but limited the breadth of analysis; we measured 45 acylcarnitines and 15 amino acids in this study. Although these metabolites represent a small portion of the human metabolome in terms of absolute numbers, they report on pathways critical for cellular and organism‐level homeostasis: fatty acid, carbohydrate, amino acid, and urea metabolism. These particular metabolites were chosen for several reasons: (1) An expanding body of evidence has implicated impairments in fatty acid and carbohydrate oxidation in HF pathophysiology, which could be reflected in acylcarnitine elevations13, 50, 73, 74, 75, 76, 77; (2) previous metabolomics investigations have identified derangements in plasma levels of these metabolites in HF patients49, 50, 78, 79, 80; and (3) acylcarnitines and their derivatives have been suggested to have intrinsic physiological effects that could contribute to the HF phenotype.66, 67, 68, 81, 82
Fifth, our study highlights potentially provocative associations, but does not prove a causal role for elevated LCAC in the generation or exacerbation of HF phenotypes. Last, this investigation was agnostic to tissue source of circulating metabolites; obtaining more insight as to the mechanisms of these findings will be important for understanding the role of LCAC and FAO deficiencies in HF pathophysiology.
Conclusions
In the largest metabolomic investigation of HFpEF to date, we identified a signature of circulating metabolites significantly elevated in patients with HFpEF and HFrEF compared to no‐HF controls. Importantly, these LCAC metabolites were significantly higher in HFrEF than HFpEF, inversely related to LVEF. As a reflection of impaired or dysregulated FAO, the elevated plasma LCAC observed may suggest a shared metabolic impairment of the HF clinical syndrome independent of LVEF.13, 53, 54 Given that FAO impairments or dysregulation may result from a variety of mitochondrial insults, further investigation will be needed to identify the causal processes underlying the LCAC elevations reported in this study.12, 83 Given mounting evidence that LCACs are proinflammatory, arrhythmogenic, and induce cell stress, our findings may suggest a benefit for mitochondrial therapies that decrease LCAC production by increasing glucose oxidation, decreasing FAO flux, or improving mitochondrial function by antioxidant activity.63, 64, 65, 66, 67, 68 Future studies should assess the value of LCAC levels in risk‐stratifying HFpEF and HFrEF populations and further investigate the mechanisms by which they reflect, generate, and/or exacerbate HF pathophysiology.
Sources of Funding
This investigation was funded, in part, by grant R01HL095987 (Shah) from the National Institutes of Health; a sponsored research agreement from Bristol‐Meyers Squibb (BMS) to Duke (PI Shah); NIH grant TL1TR001116 (Hunter); T32HL7101‐39 (Kelly, McGarrah); and Alpha Omega Alpha Honor Society (postgraduate award, McGarrah).
Disclosures
Newgard, PhD, has received funding support from Pfizer, and is a member of the Pfizer CVMED scientific advisory board. Felker, MD, MHS, has received funding support from Amgen, Ostuka, and Roche Diagnostics, and consultant fees or honoraria from Amgen, Novartis, Trevena, Singulex, and Medtronic. Hernandez, MD, MHS, has received funding support from Amgen, AstraZeneca, BMS, Janssen, Novartis, and Portola, and consultant fees or honoraria from BMS, Boston Scientific, Gilead, Janssen, and Novartis. Velazquez, MD, has received funding support from Ikaria Pharmaceuticals, and consultant fees or honoraria from Novartis. Kraus, MD, has received funding support from Liposcience, Pfizer, Gilead, and the Health Effects Institute. Shah, MD, MS, MHS, has received funding support through a sponsored research agreement between BMS and Duke University, and a family member has received consultant fees or honoraria from Biosense Webster, Boston Scientific, CardioNet, and St. Jude. The remaining authors have no disclosures to report.
Supporting information
Data S1. Sensitivity analyses to determine impact of alternate cohort definitions.
Data S2. Approach to diastolic dysfunction classification.
Data S3. Sensitivity analyses to determine the impact of insulin resistance.
Data S4. Complete list of measured metabolites.
Data S5. Detailed results of principal components analysis.
Data S6. Plasma LCAC means for additional HFpEF, HFrEF, and control cohorts.
Table S1. Parameters Used in Diastolic Dysfunction Class Over‐reading
Table S2. List of Measured Metabolites
Table S3. Peripheral Blood Metabolite Principal Components
Table S4. Metabolite Factor Means and Comparisons Between HFpEF, HFrEF, and No‐HF Controls Using Strict Cohort Definitions
Table S5. Metabolite Factor Means and Comparisons Between HFpEF, HFrEF, and No‐HF Controls Using Alternate LVEF Thresholds
Table S6. Adjusted Metabolite Factor Means and Comparisons Between HFpEF, HFrEF, and No‐HF Controls, Controlling for History of Diabetes Mellitus and Insulin Resistance*
Table S7. Adjusted Metabolite Factor Means and Comparisons Between HFpEF, HFrEF, and No‐HF Controls, Controlling for Insulin Resistance but Not Diabetes Mellitus*
Table S8. Adjusted Individual Metabolite Means and Comparisons Between HFpEF, HFrEF, and No‐HF Controls, Controlling for History of Diabetes Mellitus and Insulin Resistance
Table S9. Adjusted Individual Metabolite Means and Comparisons Between HFpEF, HFrEF, and No‐HF Controls, Controlling for Insulin Resistance but Not Diabetes Mellitus
Table S10. Plasma LCAC Means for Primary and Additional Cohorts*
Acknowledgments
We would like to thank the CATHGEN participants for taking part in this study, Elaine Dowdy for study coordination, and Huaxia Cui and Haijing Song for technical assistance with metabolomic analyses.
(J Am Heart Assoc. 2016;5:e003190 doi: 10.1161/JAHA.115.003190)
Preliminary data for this project was presented at the American College of Cardiology Scientific Sessions, San Diego, CA, March 14‐‐16, 2015.
References
- 1. Mozaffarian D, Benjamin EJ, Go AS, Arnett DK, Blaha MJ, Cushman M, de Ferranti S, Després JP, Fullerton HJ, Howard VJ, Huffman MD, Judd SE, Kissela BM, Lackland DT, Lichtman JH, Lisabeth LD, Liu S, Mackey RH, Matchar DB, McGuire DK, Mohler ER III, Moy CS, Muntner P, Mussolino ME, Nasir K, Neumar RW, Nichol G, Palaniappan L, Pandey DK, Reeves MJ, Rodriguez CJ, Sorlie PD, Stein J, Towfighi A, Turan TN, Virani SS, Willey JZ, Woo D, Yeh RW, Turner MB; American Heart Association Statistics Committee and Stroke Statistics Subcommittee . Executive summary: heart disease and stroke statistics—2015 update: a report from the American Heart Association. Circulation. 2015;131:434–441. [DOI] [PubMed] [Google Scholar]
- 2. Owan TE, Hodge DO, Herges RM, Jacobsen SJ, Roger VL, Redfield MM. Trends in prevalence and outcome of heart failure with preserved ejection fraction. N Engl J Med. 2006;355:251–259. [DOI] [PubMed] [Google Scholar]
- 3. Hogg K, Swedberg K, McMurray J. Heart failure with preserved left ventricular systolic function; epidemiology, clinical characteristics, and prognosis. J Am Coll Cardiol. 2004;43:317–327. [DOI] [PubMed] [Google Scholar]
- 4. Steinberg BA, Zhao X, Heidenreich PA, Peterson ED, Bhatt DL, Cannon CP, Hernandez AF, Fonarow GC; Get With the Guidelines Scientific Advisory Committee and Investigators . Trends in patients hospitalized with heart failure and preserved left ventricular ejection fraction: prevalence, therapies, and outcomes. Circulation. 2012;126:65–75. [DOI] [PubMed] [Google Scholar]
- 5. Senni M, Redfield MM. Heart failure with preserved systolic function: a different natural history? J Am Coll Cardiol. 2001;38:1277–1282. [DOI] [PubMed] [Google Scholar]
- 6. Yancy CW, Jessup M, Bozkurt B, Butler J, Casey DE Jr, Drazner MH, Fonarow GC, Geraci SA, Horwich T, Januzzi JL, Johnson MR, Kasper EK, Levy WC, Masoudi FA, McBride PE, McMurray JJ, Mitchell JE, Peterson PN, Riegel B, Sam F, Stevenson LW, Tang WH, Tsai EJ, Wilkoff BL; American College of Cardiology Foundation; American Heart Association Task Force on Practice Guidelines . ACCF/AHA guideline for the management of heart failure: a report of the American College of Cardiology Foundation/American Heart Association Task Force on Practice Guidelines. J Am Coll Cardiol. 2013;62:e147–e239. [DOI] [PubMed] [Google Scholar]
- 7. Kitzman DW, Upadhya B, Vasu S. What the dead can teach the living: systemic nature of heart failure with preserved ejection fraction. Circulation. 2015;131:522–524. [DOI] [PMC free article] [PubMed] [Google Scholar]
- 8. Sharma K, Kass DA. Heart failure with preserved ejection fraction: mechanisms, clinical features, and therapies. Circ Res. 2014;115:79–96. [DOI] [PMC free article] [PubMed] [Google Scholar]
- 9. Paulus WJ, Tschöpe C. A novel paradigm for heart failure with preserved ejection fraction. J Am Coll Cardiol. 2013;62:263–271. [DOI] [PubMed] [Google Scholar]
- 10. McMurray JJ, Adamopoulos S, Anker SD, Auricchio A, Böhm M, Dickstein K, Falk V, Filippatos G, Fonseca C, Gomez‐Sanchez MA, Jaarsma T, Køber L, Lip GY, Maggioni AP, Parkhomenko A, Pieske BM, Popescu BA, Rønnevik PK, Rutten FH, Schwitter J, Seferovic P, Stepinska J, Trindade PT, Voors AA, Zannad F, Zeiher A; Task Force for the Diagnosis and Treatment of Acute and Chronic Heart Failure 2012 of the European Society of Cardiology , Bax JJ, Baumgartner H, Ceconi C, Dean V, Deaton C, Fagard R, Funck‐Brentano C, Hasdai D, Hoes A, Kirchhof P, Knuuti J, Kolh P, McDonagh T, Moulin C, Popescu BA, Reiner Z, Sechtem U, Sirnes PA, Tendera M, Torbicki A, Vahanian A, Windecker S, McDonagh T, Sechtem U, Bonet LA, Avraamides P, Ben Lamin HA, Brignole M, Coca A, Cowburn P, Dargie H, Elliott P, Flachskampf FA, Guida GF, Hardman S, Iung B, Merkely B, Mueller C, Nanas JN, Nielsen OW, Orn S, Parissis JT, Ponikowski P; ESC Committee for Practice Guidelines . ESC guidelines for the diagnosis and treatment of acute and chronic heart failure 2012: the Task Force for the Diagnosis and Treatment of Acute and Chronic Heart Failure 2012 of the European Society of Cardiology. Developed in collaboration with the Heart Failure Association (HFA) of the ESC. Eur Heart J. 2012;33:1787–1847. [DOI] [PubMed] [Google Scholar]
- 11. Tschöpe C, Van Linthout S. New insights in (inter)cellular mechanisms by heart failure with preserved ejection fraction. Curr Heart Fail Rep. 2014;11:436–444. [DOI] [PMC free article] [PubMed] [Google Scholar]
- 12. Carley AN, Taegtmeyer H, Lewandowski ED. Matrix revisited: mechanisms linking energy substrate metabolism to the function of the heart. Circ Res. 2014;114:717–729. [DOI] [PMC free article] [PubMed] [Google Scholar]
- 13. Doehner W, Frenneaux M, Anker SD. Metabolic impairment in heart failure. J Am Coll Cardiol. 2014;64:1388–1400. [DOI] [PubMed] [Google Scholar]
- 14. Shah SH, Kraus WE, Newgard CB. Metabolomic profiling for the identification of novel biomarkers and mechanisms related to common cardiovascular diseases: form and function. Circulation. 2012;126:1110–1120. [DOI] [PMC free article] [PubMed] [Google Scholar]
- 15. Shah SH, Newgard CB. Integrated metabolomics and genomics: systems approaches to biomarkers and mechanisms of cardiovascular disease. Circ Cardiovasc Genet. 2015;8:410–419. [DOI] [PMC free article] [PubMed] [Google Scholar]
- 16. Turer AT. Using metabolomics to assess myocardial metabolism and energetics in heart failure. J Mol Cell Cardiol. 2013;55:12–18. [DOI] [PubMed] [Google Scholar]
- 17. Shah SH, Granger CB, Hauser ER, Kraus WE, Sun J‐L, Pieper K, Nelson CL, Delong ER, Califf RM, Newby LK; MURDOCK Horizon 1 Cardiovascular Disease Investigators . Reclassification of cardiovascular risk using integrated clinical and molecular biosignatures: design of and rationale for the Measurement to Understand the Reclassification of Disease of Cabarrus and Kannapolis (MURDOCK) Horizon 1 Cardiovascular Disease Study. Am Heart J. 2010;160:371–379.e2. [DOI] [PubMed] [Google Scholar]
- 18. Kraus WE, Granger CB, Sketch MH, Donahue MP, Ginsburg GS, Hauser ER, Haynes C, Newby LK, Hurdle M, Dowdy ZE, Shah SH. A guide for a cardiovascular genomics biorepository: the CATHGEN experience. J Cardiovasc Transl Res. 2015;8:1–9. [DOI] [PMC free article] [PubMed] [Google Scholar]
- 19. Pitt B, Pfeffer MA, Assmann SF, Boineau R, Anand IS, Claggett B, Clausell N, Desai AS, Diaz R, Fleg JL, Gordeev I, Harty B, Heitner JF, Kenwood CT, Lewis EF, O'Meara E, Probstfield JL, Shaburishvili T, Shah SJ, Solomon SD, Sweitzer NK, Yang S, McKinlay SM; TOPCAT Investigators . Spironolactone for heart failure with preserved ejection fraction. N Engl J Med. 2014;370:1383–1392. [DOI] [PubMed] [Google Scholar]
- 20. Solomon SD, Zile M, Pieske B, Voors A, Shah A, Kraigher‐Krainer E, Shi V, Bransford T, Takeuchi M, Gong J, Lefkowitz M, Packer M, McMurray JJ. The angiotensin receptor neprilysin inhibitor LCZ696 in heart failure with preserved ejection fraction: a phase 2 double‐blind randomised controlled trial. Lancet. 2012;380:1387–1395. [DOI] [PubMed] [Google Scholar]
- 21. Paulus WJ, Tschöpe C, Sanderson JE, Rusconi C, Flachskampf FA, Rademakers FE, Marino P, Smiseth OA, De Keulenaer G, Leite‐Moreira AF, Borbély A, Edes I, Handoko ML, Heymans S, Pezzali N, Pieske B, Dickstein K, Fraser AG, Brutsaert DL. How to diagnose diastolic heart failure: a consensus statement on the diagnosis of heart failure with normal left ventricular ejection fraction by the Heart Failure and Echocardiography Associations of the European Society of Cardiology. Eur Heart J. 2007;28:2539–2550. [DOI] [PubMed] [Google Scholar]
- 22. Massie BM, Carson PE, McMurray JJ, Komajda M, McKelvie R, Zile MR, Anderson S, Donovan M, Iverson E, Staiger C, Ptaszynska A; I‐PRESERVE Investigators . Irbesartan in patients with heart failure and preserved ejection fraction. N Engl J Med. 2008;359:2456–2467. [DOI] [PubMed] [Google Scholar]
- 23. Redfield MM, Chen HH, Borlaug BA, Semigran MJ, Lee KL, Lewis G, LeWinter MM, Rouleau JL, Bull DA, Mann DL, Deswal A, Stevenson LW, Givertz MM, Ofili EO, O'Connor CM, Felker GM, Goldsmith SR, Bart BA, McNulty SE, Ibarra JC, Lin G, Oh JK, Patel MR, Kim RJ, Tracy RP, Velazquez EJ, Anstrom KJ, Hernandez AF, Mascette AM, Braunwald E; RELAX Trial . Effect of phosphodiesterase‐5 inhibition on exercise capacity and clinical status in heart failure with preserved ejection fraction: a randomized clinical trial. JAMA. 2013;309:1268–1277. [DOI] [PMC free article] [PubMed] [Google Scholar]
- 24. Kosmala W, Holland DJ, Rojek A, Wright L, Przewlocka‐Kosmala M, Marwick TH. Effect of If‐channel inhibition on hemodynamic status and exercise tolerance in heart failure with preserved ejection fraction: a randomized trial. J Am Coll Cardiol. 2013;62:1330–1338. [DOI] [PubMed] [Google Scholar]
- 25. Heart Failure Society of America , Lindenfeld J, Albert NM, Boehmer JP, Collins SP, Ezekowitz JA, Givertz MM, Katz SD, Klapholz M, Moser DK, Rogers JG, Starling RC, Stevenson WG, Tang WH, Teerlink JR, Walsh MN. HFSA 2010 comprehensive heart failure practice guideline. J Cardiac Fail. 2010;16:e1–e194. [DOI] [PubMed] [Google Scholar]
- 26. Thygesen K, Alpert JS, White HD; Joint ESC/ACCF/AHA/WHF Task Force for the Redefinition of Myocardial Infarction . Universal definition of myocardial infarction. J Am Coll Cardiol. 2007;50:2173–2195. [DOI] [PubMed] [Google Scholar]
- 27. Nagueh SF, Appleton CP, Gillebert TC, Marino PN, Oh JK, Smiseth OA, Waggoner AD, Flachskampf FA, Pellikka PA, Evangelista A. Recommendations for the evaluation of left ventricular diastolic function by echocardiography. J Am Soc Echocardiogr. 2009;22:107–133. [DOI] [PubMed] [Google Scholar]
- 28. Harris PJ, Lee KL, Harrell FE, Behar VS, Rosati RA. Outcome in medically treated coronary artery disease. Ischemic events: nonfatal infarction and death. Circulation. 1980;62:718–726. [DOI] [PubMed] [Google Scholar]
- 29. Shalaurova I, Connelly MA, Garvey WT, Otvos JD. Lipoprotein insulin resistance index: a lipoprotein particle‐derived measure of insulin resistance. Metab Syndr Relat Disord. 2014;12:422–429. [DOI] [PMC free article] [PubMed] [Google Scholar]
- 30. Shah SH, Bain JR, Muehlbauer MJ, Stevens RD, Crosslin DR, Haynes C, Dungan J, Newby LK, Hauser ER, Ginsburg GS, Newgard CB, Kraus WE. Association of a peripheral blood metabolic profile with coronary artery disease and risk of subsequent cardiovascular events. Circ Cardiovasc Genet. 2010;3:207–214. [DOI] [PubMed] [Google Scholar]
- 31. Shah AA, Craig DM, Sebek JK, Haynes C, Stevens RC, Muehlbauer MJ, Granger CB, Hauser ER, Newby LK, Newgard CB, Kraus WE, Hughes GC, Shah SH. Metabolic profiles predict adverse events after coronary artery bypass grafting. J Thorac Cardiovasc Surg. 2012;143:873–878. [DOI] [PMC free article] [PubMed] [Google Scholar]
- 32. Newgard CB, An J, Bain JR, Muehlbauer MJ, Stevens RD, Lien LF, Haqq AM, Shah SH, Arlotto M, Slentz CA, Rochon J, Gallup D, Ilkayeva O, Wenner BR, Yancy WS Jr, Eisenson H, Musante G, Surwit RS, Millington DS, Butler MD, Svetkey LP. A branched‐chain amino acid‐related metabolic signature that differentiates obese and lean humans and contributes to insulin resistance. Cell Metab. 2009;9:311–326. [DOI] [PMC free article] [PubMed] [Google Scholar]
- 33. Patterson BW, Zhao G, Elias N, Hachey DL, Klein S. Validation of a new procedure to determine plasma fatty acid concentration and isotopic enrichment. J Lipid Res. 1999;40:2118–2124. [PubMed] [Google Scholar]
- 34. Shah SH, Hauser ER, Bain JR, Muehlbauer MJ, Haynes C, Stevens RD, Wenner BR, Dowdy ZE, Granger CB, Ginsburg GS, Newgard CB, Kraus WE. High heritability of metabolomic profiles in families burdened with premature cardiovascular disease. Mol Syst Biol. 2009;5:258. [DOI] [PMC free article] [PubMed] [Google Scholar]
- 35. An J, Muoio DM, Shiota M, Fujimoto Y, Cline GW, Shulman GI, Koves TR, Stevens R, Millington D, Newgard CB. Hepatic expression of malonyl‐CoA decarboxylase reverses muscle, liver and whole‐animal insulin resistance. Nat Med. 2004;10:268–274. [DOI] [PubMed] [Google Scholar]
- 36. Chace DH, Hillman SL, Millington DS, Kahler SG, Roe CR, Naylor EW. Rapid diagnosis of maple syrup urine disease in blood spots from newborns by tandem mass spectrometry. Clin Chem. 1995;41:62–68. [PubMed] [Google Scholar]
- 37. Jeyarajah EJ, Cromwell WC, Otvos JD. Lipoprotein particle analysis by nuclear magnetic resonance spectroscopy. Clin Lab Med. 2006;26:847–870. [DOI] [PubMed] [Google Scholar]
- 38. Kaiser HF. The application of electronic computers to factor analysis. Educ Psychol Meas. 1960;20:141–151. [Google Scholar]
- 39. Kaiser HF. The varimax criterion for analytic rotation in factor analysis. Psychometrika. 1958;23:187–200. [Google Scholar]
- 40. Yeomans KA, Golder PA. The Guttman‐Kaiser criterion as a predictor of the number of common factors. Statistician. 1982;31:221. [Google Scholar]
- 41. Stevens JP. Applied Multivariate Statistics for the Social Sciences. 4th ed Mahwah, NJ: Lawrence Erlbaum Associates; 2002. [Google Scholar]
- 42. Lawlor DA, Ebrahim S, May M, Davey Smith G. (Mis)use of factor analysis in the study of insulin resistance syndrome. Am J Epidemiol. 2004;159:1013–1018. [DOI] [PubMed] [Google Scholar]
- 43. Manly B. Multivariate Statistical Methods: A Primer. London: Chapman and Hall/CRC; 2004. [Google Scholar]
- 44. Andersson C, Vasan RS. Epidemiology of heart failure with preserved ejection fraction. Heart Fail Clin. 2014;10:377–388. [DOI] [PMC free article] [PubMed] [Google Scholar]
- 45. Bui AL, Horwich TB, Fonarow GC. Epidemiology and risk profile of heart failure. Nat Rev Cardiol. 2010;8:30–41. [DOI] [PMC free article] [PubMed] [Google Scholar]
- 46. Shah SH, Sun J‐L, Stevens RD, Bain JR, Muehlbauer MJ, Pieper KS, Haynes C, Hauser ER, Kraus WE, Granger CB, Newgard CB, Califf RM, Newby LK. Baseline metabolomic profiles predict cardiovascular events in patients at risk for coronary artery disease. Am Heart J. 2012;163:844–850.e1. [DOI] [PubMed] [Google Scholar]
- 47. Herrman G, Decherd GM. The chemical nature of heart failure. Ann Intern Med. 1939;12:1233. [Google Scholar]
- 48. Neubauer S. The failing heart—an engine out of fuel. N Engl J Med. 2007;356:1140–1151. [DOI] [PubMed] [Google Scholar]
- 49. Zordoky BN, Sung MM, Ezekowitz J, Mandal R, Han B, Bjorndahl TC, Bouatra S, Anderson T, Oudit GY, Wishart DS, Dyck JRB; Alberta HEART . Metabolomic fingerprint of heart failure with preserved ejection fraction. PLoS One. 2015;10:e0124844. [DOI] [PMC free article] [PubMed] [Google Scholar]
- 50. Cheng M‐L, Wang C‐H, Shiao M‐S, Liu M‐H, Huang Y‐Y, Huang C‐Y, Mao C‐T, Lin J‐F, Ho H‐Y, Yang N‐I. Metabolic disturbances identified in plasma are associated with outcomes in patients with heart failure: diagnostic and prognostic value of metabolomics. J Am Coll Cardiol. 2015;65:1509–1520. [DOI] [PubMed] [Google Scholar]
- 51. Ahmad T, Kelly JP, McGarrah RW, Hellkamp AS, Fiuzat M, Testani JM, Wang TS, Verma A, Samsky MD, Donahue MP, Ilkayeva OR, Bowles DE, Patel CB, Milano CA, Rogers JG, Felker GM, O'Connor CM, Shah SH, Kraus WE. Prognostic implications of long‐chain acylcarnitines in heart failure and reversibility with mechanical circulatory support. J Am Coll Cardiol. 2016;67:291–299. [DOI] [PMC free article] [PubMed] [Google Scholar]
- 52. Reuter SE, Evans AM. Carnitine and acylcarnitines: pharmacokinetic, pharmacological and clinical aspects. Clin Pharmacokinet. 2012;51:553–572. [DOI] [PubMed] [Google Scholar]
- 53. Noland RC, Koves TR, Seiler SE, Lum H, Lust RM, Ilkayeva O, Stevens RD, Hegardt FG, Muoio DM. Carnitine insufficiency caused by aging and overnutrition compromises mitochondrial performance and metabolic control. J Biol Chem. 2009;284:22840–22852. [DOI] [PMC free article] [PubMed] [Google Scholar]
- 54. Koves TR, Ussher JR, Noland RC, Slentz D, Mosedale M, Ilkayeva O, Bain J, Stevens R, Dyck JRB, Newgard CB, Lopaschuk GD, Muoio DM. Mitochondrial overload and incomplete fatty acid oxidation contribute to skeletal muscle insulin resistance. Cell Metab. 2008;7:45–56. [DOI] [PubMed] [Google Scholar]
- 55. Mai M, Toenjes A, Kovacs P, Stumvoll M, Fiedler GM, Leichtle AB. Serum levels of acylcarnitines are altered in prediabetic conditions. PLoS One. 2013;8:e82459. [DOI] [PMC free article] [PubMed] [Google Scholar]
- 56. Aguer C, McCoin CS, Knotts TA, Thrush AB, Ono‐Moore K, McPherson R, Dent R, Hwang DH, Adams SH, Harper M‐E. Acylcarnitines: potential implications for skeletal muscle insulin resistance. FASEB J. 2015;29:336–345. [DOI] [PMC free article] [PubMed] [Google Scholar]
- 57. Schooneman MG, Vaz FM, Houten SM, Soeters MR. Acylcarnitines: reflecting or inflicting insulin resistance? Diabetes. 2013;62:1–8. [DOI] [PMC free article] [PubMed] [Google Scholar]
- 58. Bell FP, DeLucia A, Bryant LR, Patt CS, Greenberg HS. Carnitine metabolism in Macaca arctoides: the effects of dietary change and fasting on serum triglycerides, unesterified carnitine, esterified (acyl) carnitine, and beta‐hydroxybutyrate. Am J Clin Nutr. 1982;36:115–121. [DOI] [PubMed] [Google Scholar]
- 59. Pollitt RJ. Disorders of mitochondrial long‐chain fatty acid oxidation. J Inherit Metab Dis. 1995;18:473–490. [DOI] [PubMed] [Google Scholar]
- 60. Rinaldo P, Cowan TM, Matern D. Acylcarnitine profile analysis. Genet Med. 2008;10:151–156. [DOI] [PubMed] [Google Scholar]
- 61. Lum H, Sloane R, Huffman KM, Kraus VB, Thompson DK, Kraus WE, Bain JR, Stevens R, Pieper CF, Taylor GA, Newgard CB, Cohen HJ, Morey MC. Plasma acylcarnitines are associated with physical performance in elderly men. J Gerontol A Biol Sci Med Sci. 2011;66:548–553. [DOI] [PMC free article] [PubMed] [Google Scholar]
- 62. Kalim S, Clish CB, Wenger J, Elmariah S, Yeh RW, Deferio JJ, Pierce K, Deik A, Gerszten RE, Thadhani R, Rhee EP. A plasma long‐chain acylcarnitine predicts cardiovascular mortality in incident dialysis patients. J Am Heart Assoc. 2013;2:e000542 doi: 10.1161/JAHA.113.000542. [DOI] [PMC free article] [PubMed] [Google Scholar]
- 63. McCoin CS, Knotts TA, Ono‐Moore KD, Oort PJ, Adams SH. Long‐chain acylcarnitines activate cell stress and myokine release in C2C12 myotubes: calcium‐dependent and ‐independent effects. Am J Physiol Endocrinol Metab. 2015;308:E990–E1000. [DOI] [PMC free article] [PubMed] [Google Scholar]
- 64. Rutkowsky JM, Knotts TA, Ono‐Moore KD, McCoin CS, Huang S, Schneider D, Singh S, Adams SH, Hwang DH. Acylcarnitines activate proinflammatory signaling pathways. Am J Physiol Endocrinol Metab. 2014;306:E1378–E1387. [DOI] [PMC free article] [PubMed] [Google Scholar]
- 65. Weigert C, Brodbeck K, Staiger H, Kausch C, Machicao F, Häring HU, Schleicher ED. Palmitate, but not unsaturated fatty acids, induces the expression of interleukin‐6 in human myotubes through proteasome‐dependent activation of nuclear factor‐kappaB. J Biol Chem. 2004;279:23942–23952. [DOI] [PubMed] [Google Scholar]
- 66. Yamada KA, Kanter EM, Newatia A. Long‐chain acylcarnitine induces Ca2+ efflux from the sarcoplasmic reticulum. J Cardiovasc Pharmacol. 2000;36:14–21. [DOI] [PubMed] [Google Scholar]
- 67. Ferro F, Ouillé A, Tran T‐A, Fontanaud P, Bois P, Babuty D, Labarthe F, Le Guennec J‐Y. Long‐chain acylcarnitines regulate the hERG channel. PLoS One. 2012;7:e41686. [DOI] [PMC free article] [PubMed] [Google Scholar]
- 68. Clancy CE, Rudy Y. Cellular consequences of HERG mutations in the long QT syndrome: precursors to sudden cardiac death. Cardiovasc Res. 2001;50:301–313. [DOI] [PubMed] [Google Scholar]
- 69. Upadhya B, Haykowsky MJ, Eggebeen J, Kitzman DW. Sarcopenic obesity and the pathogenesis of exercise intolerance in heart failure with preserved ejection fraction. Curr Heart Fail Rep. 2015;12:205–214. [DOI] [PMC free article] [PubMed] [Google Scholar]
- 70. Hwang S‐J, Melenovsky V, Borlaug BA. Implications of coronary artery disease in heart failure with preserved ejection fraction. J Am Coll Cardiol. 2014;63:2817–2827. [DOI] [PubMed] [Google Scholar]
- 71. Rusinaru D, Houpe D, Szymanski C, Lévy F, Maréchaux S, Tribouilloy C. Coronary artery disease and 10‐year outcome after hospital admission for heart failure with preserved and with reduced ejection fraction. Eur J Heart Fail. 2014;16:967–976. [DOI] [PubMed] [Google Scholar]
- 72. Mentz RJ, Fiuzat M, Shaw LK, Phillips HR, Borges‐Neto S, Felker GM, O'Connor CM. Comparison of clinical characteristics and long‐term outcomes of patients with ischemic cardiomyopathy with versus without angina pectoris (from the Duke Databank for Cardiovascular Disease). Am J Cardiol. 2012;109:1272–1277. [DOI] [PubMed] [Google Scholar]
- 73. Swan JW, Anker SD, Walton C, Godsland IF, Clark AL, Leyva F, Stevenson JC, Coats AJ. Insulin resistance in chronic heart failure: relation to severity and etiology of heart failure. J Am Coll Cardiol. 1997;30:527–532. [DOI] [PubMed] [Google Scholar]
- 74. AlZadjali MA, Godfrey V, Khan F, Choy A, Doney AS, Wong AK, Petrie JR, Struthers AD, Lang CC. Insulin resistance is highly prevalent and is associated with reduced exercise tolerance in nondiabetic patients with heart failure. J Am Coll Cardiol. 2009;53:747–753. [DOI] [PubMed] [Google Scholar]
- 75. Banerjee D, Biggs ML, Mercer L, Mukamal K, Kaplan R, Barzilay J, Kuller L, Kizer JR, Djousse L, Tracy R, Zieman S, Lloyd‐Jones D, Siscovick D, Carnethon M. Insulin resistance and risk of incident heart failure: Cardiovascular Health Study. Circ Heart Fail. 2013;6:364–370. [DOI] [PMC free article] [PubMed] [Google Scholar]
- 76. Huang Y, Zhou M, Sun H, Wang Y. Branched‐chain amino acid metabolism in heart disease: an epiphenomenon or a real culprit? Cardiovasc Res. 2011;90:220–223. [DOI] [PMC free article] [PubMed] [Google Scholar]
- 77. Sansbury BE, DeMartino AM, Xie Z, Brooks AC, Brainard RE, Watson LJ, DeFilippis AP, Cummins TD, Harbeson MA, Brittian KR, Prabhu SD, Bhatnagar A, Jones SP, Hill BG. Metabolomic analysis of pressure‐overloaded and infarcted mouse hearts. Circ Heart Fail. 2014;7:634–642. [DOI] [PMC free article] [PubMed] [Google Scholar]
- 78. Tenori L, Hu X, Pantaleo P, Alterini B, Castelli G, Olivotto I, Bertini I, Luchinat C, Gensini GF. Metabolomic fingerprint of heart failure in humans: a nuclear magnetic resonance spectroscopy analysis. Int J Cardiol. 2013;168:e113–e115. [DOI] [PubMed] [Google Scholar]
- 79. Wang J, Li Z, Chen J, Zhao H, Luo L, Chen C, Xu X, Zhang W, Gao K, Li B, Zhang J, Wang W. Metabolomic identification of diagnostic plasma biomarkers in humans with chronic heart failure. Mol Biosyst. 2013;9:2618–2626. [DOI] [PubMed] [Google Scholar]
- 80. Alexander D, Lombardi R, Rodriguez G, Mitchell MM, Marian AJ. Metabolomic distinction and insights into the pathogenesis of human primary dilated cardiomyopathy. Eur J Clin Invest. 2010;41:527–538. [DOI] [PMC free article] [PubMed] [Google Scholar]
- 81. Ferrari R, De Giuli F. The propionyl‐L‐carnitine hypothesis: an alternative approach to treating heart failure. J Cardiac Fail. 1997;3:217–224. [DOI] [PubMed] [Google Scholar]
- 82. Gómez LA, Heath S‐HD, Hagen TM. Acetyl‐L‐carnitine supplementation reverses the age‐related decline in carnitine palmitoyltransferase 1 (CPT1) activity in interfibrillar mitochondria without changing the L‐carnitine content in the rat heart. Mech Ageing Dev. 2012;133:99–106. [DOI] [PMC free article] [PubMed] [Google Scholar]
- 83. Stanley WC. Myocardial substrate metabolism in the normal and failing heart. Physiol Rev. 2005;85:1093–1129. [DOI] [PubMed] [Google Scholar]
Associated Data
This section collects any data citations, data availability statements, or supplementary materials included in this article.
Supplementary Materials
Data S1. Sensitivity analyses to determine impact of alternate cohort definitions.
Data S2. Approach to diastolic dysfunction classification.
Data S3. Sensitivity analyses to determine the impact of insulin resistance.
Data S4. Complete list of measured metabolites.
Data S5. Detailed results of principal components analysis.
Data S6. Plasma LCAC means for additional HFpEF, HFrEF, and control cohorts.
Table S1. Parameters Used in Diastolic Dysfunction Class Over‐reading
Table S2. List of Measured Metabolites
Table S3. Peripheral Blood Metabolite Principal Components
Table S4. Metabolite Factor Means and Comparisons Between HFpEF, HFrEF, and No‐HF Controls Using Strict Cohort Definitions
Table S5. Metabolite Factor Means and Comparisons Between HFpEF, HFrEF, and No‐HF Controls Using Alternate LVEF Thresholds
Table S6. Adjusted Metabolite Factor Means and Comparisons Between HFpEF, HFrEF, and No‐HF Controls, Controlling for History of Diabetes Mellitus and Insulin Resistance*
Table S7. Adjusted Metabolite Factor Means and Comparisons Between HFpEF, HFrEF, and No‐HF Controls, Controlling for Insulin Resistance but Not Diabetes Mellitus*
Table S8. Adjusted Individual Metabolite Means and Comparisons Between HFpEF, HFrEF, and No‐HF Controls, Controlling for History of Diabetes Mellitus and Insulin Resistance
Table S9. Adjusted Individual Metabolite Means and Comparisons Between HFpEF, HFrEF, and No‐HF Controls, Controlling for Insulin Resistance but Not Diabetes Mellitus
Table S10. Plasma LCAC Means for Primary and Additional Cohorts*