

Abstract
Background
Healthy People 2020 aim to reduce fatal atherosclerotic cardiovascular disease (ASCVD) by 20%, which translates into 310 000 fewer events annually assuming proportional reduction in fatal and nonfatal ASCVD. We estimated preventable ASCVD events by implementing the American College of Cardiology/American Heart Association (ACC/AHA) 2013 Cholesterol Guideline in all statin‐eligible adults. Absolute risk reduction (ARR) and number needed‐to‐treat (NNT) were calculated.
Methods and Results
National Health and Nutrition Examination Survey data for 2007–2012 were analyzed for adults aged 21 to 79 years and extrapolated to the US population. Literature‐guided assumptions were used including (1) low‐density lipoprotein cholesterol falls 33% with moderate‐intensity statins and 51% with high‐intensity statins; (2) for each 39 mg/dL decline in low‐density lipoprotein cholesterol, 10‐year ASCVD 10 risk would fall 21% when ASCVD 10 risk was ≥20% and 33% when ASCVD 10 risk was <20%; and (3) either all statin‐eligible untreated adults or all with ASCVD 10 risk ≥7.5% would receive statins. Of 175.9 million adults aged 21 to 79 years not taking statins, 44.8 million (25.5%) were statin eligible. Treating all statin‐eligible adults would prevent an estimated 243 589 ASCVD events annually (ARR 5.4%, 10‐year NNT 18). Treating all statin‐eligible adults with ASCVD 10 risk ≥7.5% reduces the number treated to 32.2 million (28.2% fewer), whereas ASCVD events prevented annually fall only 10.5% to 217 974 (6.8% ARR, NNT 15).
Conclusions
Implementing the ACC/AHA 2013 Cholesterol Guideline in all untreated, statin‐eligible adults could achieve ≈78% of the Healthy People 2020 ASCVD prevention goal. Most of the benefit is attained by individuals with 10‐year ASCVD risk ≥7.5%.
Keywords: cardiovascular disease, cholesterol, epidemiology, guideline, primary prevention, secondary prevention, statin
Subject Categories: Vascular Disease, Epidemiology, Primary Prevention, Secondary Prevention
In the US, ≈735 000 myocardial infarctions and 795 000 strokes occur annually, resulting in ≈500 000 deaths including ≈130 000 deaths from stroke and ≈370 000 deaths from coronary disease.1, 2 In 2010, ischemic heart disease was the leading cause of life lost in the United States at 7.2 million life years with stroke third at 1.9 million years.3 Healthy People4 2020 goals include reducing deaths from heart disease and stroke 20%.5 Hypercholesterolemia is a major, modifiable risk factor for coronary heart disease (CHD) and stroke.6 Statins are beneficial for the primary and secondary prevention of fatal and nonfatal CHD and stroke.7, 8
The American College of Cardiology/American Heart Association (ACC/AHA) 2013 Cholesterol Guideline, hereafter the 2013 Cholesterol Guideline, would treat ≈12.8 million additional adults aged 40 to 75 years old for hypercholesterolemia than recommended in the National Cholesterol Education Program/Adult Treatment Panel–3 guideline (NCEP/ATP‐3).9 Moreover, the atherosclerotic cardiovascular disease (ASCVD) risk calculator in the 2013 Cholesterol Guideline is more strongly associated with coronary calcium scores and cardiovascular outcomes than is the CHD risk equation in ATP‐3.10 These observations suggest that cardiovascular health could be improved and Healthy People 2020 goals advanced by implementing the 2013 Cholesterol Guideline.
A prior analysis indicated that full implementation of the 2013 Cholesterol Guideline would prevent an additional ≈475 000 cardiovascular events over 10 years compared with full implementation of the Adult Treatment Panel (ATP)‐3 Guideline.9 A cost‐effectiveness analysis suggested that lowering the threshold for intervention from a 10‐year ASCVD risk (ASCVD10) from ≥7.5% to ≥3.0% would prevent an additional 161 650 ASCVD events over 10 years and was cost effective, especially with low‐cost statins.11 In both reports, only adults aged 40 to 75 years were included, and statins were assumed to reduce CHD by 25% and stroke by 17%, given a 39‐mg/dL reduction in low‐density lipoprotein cholesterol (LDL‐C).
The 2013 Cholesterol Guideline extends to a broader age range than 40 to 75 years for adults with clinical atherosclerotic cardiovascular disease or low‐density lipoprotein cholesterol (LDL‐C) ≥190 mg/dL.6 Moreover, the percentage and absolute reduction in LDL‐C are dose dependent with high‐intensity statins more effective than moderate‐intensity statins in reducing ASCVD,6, 8, 12, 13, 14, 15, 16 although adverse effects also increase.16, 17, 18, 19 The current and previous cholesterol guidelines also identified a favorable risk:benefit ratio for statins in adults aged ≥75 years with clinical ASCVD.6, 20, 21
Given the importance of ASCVD prevention, we examined the impact of implementing the 2013 Cholesterol Guideline on 2 key outcomes. One outcome was to estimate the number of ASCVD events that could be prevented in the United States by providing statins to currently untreated but statin‐eligible adults 21 to 79 years old. A second outcome was to calculate absolute risk reduction (ARR) and 10‐year number needed‐to‐treat (NNT) to prevent a major ASCVD event. This information is important for assessing clinical resource requirements and risk:benefit ratio. Study findings have potentially important implications for healthcare delivery, policy, and payment to enhance cardiovascular health promotion and disease prevention.
Methods
The National Health and Nutrition Examination Surveys (NHANES) assess health and nutritional status in a representative sample of the US noninstitutionalized civilian population. All adults provided written consent, which was approved by the National Center for Health Statistics.22, 23
Participants included adults aged 21 to 79 years in NHANES 2007–2012 with ≥1 recorded blood pressure (BP) and a complete lipid profile.
Statin use was determined from medications reportedly taken in the prior 30 days and a match to known statins.
Race/ethnicity was determined by self‐report and separated into non‐Hispanic white (white), non‐Hispanic black (black), Hispanic ethnicity, and other.
BP was measured and analyzed according to NHANES guidelines.22, 23, 24 Hypertension was defined by systolic BP ≥140 and/or diastolic BP ≥90 mm Hg or positive response to “Are you currently taking prescribed medication to lower your BP?” Systolic BP of 60 to 300 mm Hg and diastolic BP of 30 to 240 mm Hg were accepted as valid.
Prevalent diabetes mellitus included (1) diagnosed diabetes mellitus defined by positive response(s) to ≥1 question, “Have you ever been told by a doctor that you have diabetes mellitus ?” or “Are you now taking insulin?” or “Are you now taking diabetic pills to lower your blood sugar?” and (2) undiagnosed diabetes mellitus was defined by negative responses to the questions and fasting glucose ≥126 mg/dL or glycosylated hemoglobin ≥6.5%.25
Lipid/Lipoprotein Values
As shown in Figure 1, fewer than half of adult participants in NHANES provided fasting blood samples. Total cholesterol and high‐density lipoprotein cholesterol (HDL‐C) were measured on all participants regardless of fasting status, whereas triglycerides were measured and LDL‐C calculated only from fasting samples. For patients with triglyceride levels >400 mg/dL (n=128, representing 3 627 587 US adults [aged 21–79 years]), LDL‐C was not calculated. Total cholesterol of 40 to 800 mg/dL, HDL‐C of 2 to 140 mg/dL, LDL‐C of 20 to 700 mg/dL, and triglycerides of 20 to 12 000 mg/dL were accepted as valid.
Figure 1.
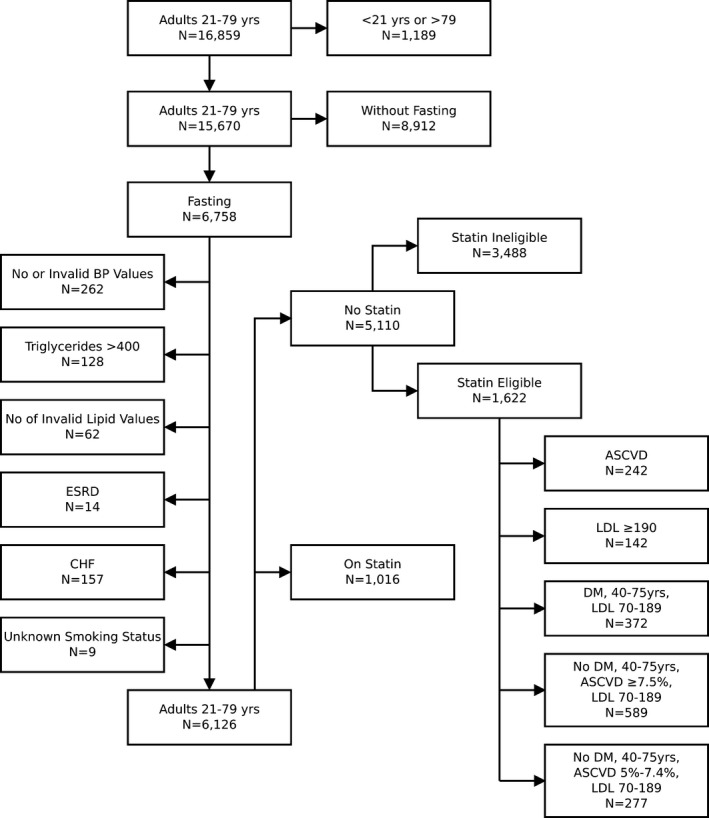
Flow diagram showing derivation of the study sample with numbers and reasons for exclusion from consideration for statin therapy (left). Among adults not taking statins, the numbers of statin‐ineligible and eligible adults are also shown (right).
Inclusion and Exclusion Criteria
Adult men and women aged 21 to 79 years were included with a valid BP and complete lipid profile including calculated LDL‐C. Exclusion criteria were self‐reported congestive heart failure and estimated glomerular filtration rate <15 mL/1.73 m2 per minute.5 Chronic kidney disease was defined by estimated glomerular filtration rate of 15 to 59 mL/1.73 m2 per minute.26
Statin eligibility by the 2013 ACC/AHA Cholesterol Guideline was defined as summarized in Table 1.6
Table 1.
Summary of Statin‐Eligible Groups in the 2013 ACC/AHA Cholesterol Guideline
| 2013 Guideline Statin‐Eligible Groups6 | COR | LOE | LDL‐C, mg/dL | Age, y | Statin Intensity |
|---|---|---|---|---|---|
| 1. ASCVD |
I IIa |
A B |
Any |
21–75 ≥75 |
High Moderate‐high |
| 2. LDL‐C ≥190 | I | B | ≥190 | 21–75 | High |
| 3. Diabetes mellitus—all | I | A | 70–189 | 40–75 | Moderate |
| 4. Diabetes mellitus, ASCVD10 ≥7.5% | IIa | B | 70–189 | 40–75 | High |
| 5. No diabetes mellitus, ASCVD10 ≥7.5% | I | A | 70–189 | 40–75 | Moderate‐high |
| 6. No diabetes mellitus, ASCVD10 5–>7.5% | IIa | B | 70–189 | 40–75 | Moderate |
ACC/AHA indicates American College of Cardiology/American Heart Association; ASCVD, atherosclerotic cardiovascular disease; A, multiple randomized clinical trials or meta‐analyses; B, single randomized trial or nonrandomized studies; COR, class of recommendation; I, benefit ⋙ risk; IIa, benefit ≫ risk; LDL‐C, low‐density lipoprotein cholesterol; LOE, level of evidence.
For the main analysis, we assumed that 75% of adults without diabetes mellitus and ASCVD10 ≥7.5% (1A for moderate‐ to high‐intensity statin) and 50% with diabetes mellitus and ASCVD10 ≥7.5% (IIaB for high‐intensity statin) would receive high‐intensity statin. Assumptions reflect arbitrary estimates of how informed clinicians would balance recommendations and benefit:risk information. For every 2 additional cases of incident diabetes mellitus with high‐ versus moderate‐intensity statin in patients with CHD, 6.5 fewer major vascular events occur.16 Dr Robinson, co‐author of the 2013 Cholesterol Guideline, summarized safety data on statin therapy,14, 27, 28 which indicated that the 5‐year number needed‐to‐harm (NNH) was ≈167 for moderate‐intensity and 63 for high‐intensity statin therapy.19 With regard to rhabdomyolysis, a nonsignificant increase with high‐ versus moderate‐intensity statin was noted in 1 meta‐analysis (odds ratio 1.66, P=0.326).18 Given uncertainty over what intensity statin therapy clinicians would prescribe, a sensitivity analysis was performed for these 2 groups by varying the percentages on moderate‐ and high‐intensity statins from 0% to 100%.
Estimated Decline in ASCVD10 With Statin Therapy
Assumptions included (1) for each 39‐mg/dL decline in LDL‐C, ASCVD events would fall 21% for ASCVD10 ≥20% and 33% for ASCVD10 <20%15; (2) LDL–C would fall 33% with moderate‐intensity and 51% with high‐intensity statin therapy, that is, the conservative end of the estimated 30% to <50% LDL‐C reduction with moderate‐intensity and ≥50% decline with high‐intensity statins6, 29; and (3) for patients with prior stroke or myocardial infarction in whom ASCVD10 is not calculated, a 39% 10‐year risk was assigned. In subjects with angina or transient ischemic attack, a 10‐year risk of 31.5% was assigned. Estimates were derived as follows. Adults with clinical CHD have a ≥26% 10‐year risk of another CHD event. Patients with CHD risk equivalent status, excluding diabetes mellitus,6 have a 10‐year CHD risk of >20%.20, 30, 31 Respective risks of 26% and 21% were multiplied by 1.5, which assumes ASCVD10 event rates were 50% greater than 10‐year CHD risk alone. This assumption is conservative, as annual numbers of strokes (≈795 000) and myocardial infarctions (≈735 000) in the United States are similar.1, 2
ASCVD10, while not required for treating adults aged 21 to 79 years with LDL‐C ≥190 mg/dL,6 was calculated to estimate absolute risk reduction (ARR) and number needed‐to‐treat (NNT). The ACC/AHA ASCVD risk calculator accepts ages 20 to 79 years and limits total cholesterol values to a maximum of 320 mg/dL. In NHANES 2007–2012, 0.59% of adults aged 21 to 79 years in the fasting sample used for this analysis had total cholesterol levels of >320, and all of them had LDL‐C levels of ≥190 mg/dL. Total cholesterol values >320 were entered as 320 in the ASCVD risk calculator.
Data Reporting and Analysis
SAS Enterprise Guide 7.1 was used for all analyses and accounts for complex sampling characteristics of NHANES. One‐half of NHANES participants were studied in the morning and were instructed to fast at least 9 hours before their examination. Triglyceride and calculated LDL‐C values are provided only for the fasting participants studied in the morning. Because fasting is an important defining characteristic of subjects in our analysis, the fasting sample weight, WTSAF2YR, was used.
Descriptive statistics including mean and SE were generated. Wald's F test was applied for continuous variables, and the Rao–Scott modified χ2 test was used for categorical variables. ASCVD reduction was calculated with the use of PROC SURVEYMEANS. Absolute risk reduction (ARR) and number needed‐to‐treat (NNT) were calculated using PROC SURVEYMEANS. Two‐sided P<0.05 were accepted as significant.
Results
The process for selecting adults for statin eligibility and the number of adults in each statin‐eligible group are provided in Figure 1. As shown, 6758 adults 21 to 79 years old were included in the fasting sample for NHANES 2007–2012; 128 (1.9%), or an estimated 3 627 587 adults, had triglyceride levels >400 mg/dL and were excluded from consideration for statin eligibility.
Comparison of Adults Reporting and Not Reporting Current Statin Use
Statin users comprised 32 million (15.4%) of 208 million US adults aged 21 to 79 years. Compared with adults not reporting statin use, those taking statins (1) were older and more likely to be male and white, (2) more often had health insurance, (3) had incomes ≥200% of the federal poverty level, and (4) had more healthcare visits in the previous year, higher body mass indices, and more prevalent obesity, hypertension, diabetes mellitus, stage 3 to 4 chronic kidney disease, clinical ASCVD, systolic BP, and triglycerides but lower diastolic BP, total cholesterol, LDL‐C, and HDL‐C levels and fewer cigarette smokers (Tables 2 and 3).
Table 2.
Demographic, Educational, and Economic Characteristics of Adults 21–79 Years by Statin Use and Eligibility Status
| Group | All Adults | Adults Not Taking Statins | ||||
|---|---|---|---|---|---|---|
| Variable/Subgroup | Taking Statin | No Statin Therapy | P Value | Statin Eligible | Statin Ineligible | P Value |
| NHANES sample, n | 1016 | 5110 | 1622 | 3488 | ||
| Population, N | 32 080 155 | 175 922 845 | 44 843 712 | 131 079 133 | ||
| Population, % | 15.4 | 84.6 | 25.5 | 74.5 | ||
| Age, y | 60.4±0.4 | 43.2±0.4 | <0.0001 | 57.8±0.3 | 38.1±0.4 | <0.0001 |
| Male, n (%) | 534 (53.9) | 2406 (47.3) | 0.005 | 932 (58.0) | 1474 (43.7) | <0.0001 |
| Female, n (%) | 482 (46.1) | 2704 (52.7) | 690 (42.0) | 2014 (56.3) | ||
| Black, n (%)a | 203 (8.9) | 998 (11.6) | <0.0001 | 411 (15.3) | 587 (10.3) | <0.0001 |
| White, n (%)b | 513 (78.0) | 2119 (65.9) | 648 (67.6) | 1471 (65.4) | ||
| Hispanic, n (%) | 225 (7.7) | 1521 (15.3) | 454 (11.8) | 1067 (16.5) | ||
| Other, n (%) | 75 (5.4) | 472 (7.2) | 109 (5.4) | 363 (7.8) | ||
| Visits/y, n (%) | ||||||
| 0–1 | 108 (10.4) | 2149 (39.9) | <0.0001 | 556 (33.2) | 1593 (42.2) | <0.0001 |
| 2–3 | 332 (35.6) | 1364 (28.5) | 403 (24.6) | 961 (29.9) | ||
| ≥4 | 576 (54.0) | 1596 (31.5) | 662 (42.1) | 934 (27.9) | ||
| Education, n (%) | ||||||
| <High school | 284 (17.7) | 1323 (17.3) | 0.10 | 531 (22.3) | 792 (15.6) | <0.0001 |
| High school | 251 (25.1) | 1104 (20.8) | 392 (24.0) | 712 (19.7) | ||
| ≥Some college | 481 (57.2) | 2680 (62.0) | 698 (53.8) | 1982 (64.8) | ||
| FPL, n (%) | ||||||
| <100% | 149 (8.9) | 1040 (14.9) | <0.0001 | 317 (14.5) | 723 (15.0) | 0.60 |
| 100–199% | 212 (16.5) | 1272 (20.5) | 428 (21.7) | 844 (20.0) | ||
| ≥200% | 572 (74.6) | 2369 (64.6) | 724 (63.7) | 1645 (64.9) | ||
| Insurance, n (%) | ||||||
| None | 82 (5.9) | 1531 (23.5) | <0.0001 | 406 (19.5) | 1125 (24.9) | <0.0001 |
| Private | 367 (48.9) | 2323 (57.8) | 548 (44.3) | 1775 (62.4) | ||
| Medicaid/OG | 189 (15.4) | 717 (10.5) | 256 (12.0) | 461 (10.0) | ||
| Medicare | 377 (29.8) | 536 (8.2) | 412 (24.2) | 124 (2.7) | ||
Continuous variables (age) are presented as mean±1 SE. Categorical variables are presented as NHANES sample number (n) and percentage (%) of US population represented by NHANES sample number. The sum of n‐values for participant subgroups on variables, such as visits and education, do not always equal overall NHANES sample N because of missing data. Sample weights on subjects with data were adjusted by NHANES so that summation of subgroup percentages reflect 100% of the US population N for that column, such as taking statins, no statin therapy, statin eligible, and statin ineligible. ASCVD indicates atherosclerotic cardiovascular disease; Educ, highest education level attained; FPL, federal poverty level; N, number represented in US population by NHANES sample; NHANES, national health and nutrition examination surveys; OG, other government.
Non‐Hispanic black.
Non‐Hispanic white.
Table 3.
Selected Medical Characteristics of Adults Aged 21–79 Years by Statin Use and Eligibility Status
| Group | All Adults | Adults Not Taking Statins | ||||
|---|---|---|---|---|---|---|
| Variable/Subgroup | Taking Statins | No Statin Therapy | P Value | Statin Eligible | Statin Ineligible | P Value |
| NHANES sample, n | 1016 | 5110 | 1622 | 3488 | ||
| Population, N | 32 080 155 | 175 922 845 | 44 843 712 | 131 079 133 | ||
| Population, % | 15.4 | 84.6 | 25.5 | 74.5 | ||
| BMI, kg/m2 | 30.3±0.3 | 28.4±0.1 | <0.0001 | 29.7±0.2 | 27.9±0.1 | <0.0001 |
| Obese, n (%) | 496 (48.0) | 1759 (32.5) | <0.0001 | 652 (39.5) | 1107 (30.0) | <0.0001 |
| Hypertension, n (%) | 805 (72.9) | 1437 (24.4) | <0.001 | 910 (52.7) | 527 (14.7) | <0.0001 |
| SBP, mm Hg | 123.6±0.6 | 118.0±0.4 | <0.0001 | 127.5±0.6 | 114.8±0.4 | <0.0001 |
| DBP, mm Hg | 68.6±0.5 | 70.2±0.4 | 0.0004 | 72.6±0.5 | 69.3±0.4 | <0.0001 |
| Total Chol, mg/dL | 180.2±2.1 | 197.6±0.8 | <0.0001 | 217.3±1.7 | 190.9±0.8 | <0.0001 |
| HDL‐Chol, mg/dL | 52.8±0.6 | 54.2±0.3 | 0.02 | 52.4±0.5 | 54.8±0.4 | 0.0001 |
| LDL‐Chol, mg/dL | 100.5±1.7 | 119.7±0.6 | <0.0001 | 136.8±1.5 | 113.8±0.6 | <0.0001 |
| Triglycerides, mg/dL | 134.4±3.4 | 119.0±1.5 | <0.0001 | 140.1±3.0 | 111.7±1.5 | <0.0001 |
| Diabetes mellitus, n (%) | 434 (32.2) | 567 (7.4) | <0.0001 | 451 (23.1) | 116 (2.1) | <0.0001 |
| HbA1c <8%, n (%) | 346 (82.6) | 437 (78.1) | 0.20 | 347 (78.1) | 90 (77.8) | 0.96 |
| Cigarette smoker, n (%) | 152 (15.0) | 1139 (21.3) | <0.0001 | 429 (27.3) | 710 (19.3) | <0.0001 |
| Stage 3–4 CKD, n (%) | 108 (8.5) | 150 (2.5) | <0.0001 | 98 (6.3) | 52 (1.2) | <0.0001 |
| 10‐y ASCVD risk, n (%) | 17.0±0.8 | 5.2±0.2 | <0.0001 | 14.6±0.4 | 2.0±0.1 | <0.0001 |
| ASCVD, n (%) | 252 (23.2) | 242 (3.3) | <0.0001 | 242 (12.8) | 0 (0) | <0.0001 |
Continuous variables are presented as mean±1 SE. Categorical variables are presented as NHANES sample number (n) and percentage (%) of US population represented by NHANES sample number. ASCVD indicates atherosclerotic cardiovascular disease; BMI, body mass index; Chol, cholesterol; CKD, chronic kidney disease; D, diastolic; HbA1c, glycosylated hemoglobin; HDL, high‐density lipoprotein; LDL, low‐density lipoprotein: NHANES, national health and nutrition examination surveys; OG, other governmental insurance; SBP, systolic blood pressure.
Comparing Statin‐Eligible and ‐Ineligible Adults
Of an estimated 175.9 million adults not reporting statin use, 44.8 million (25.5%) were statin eligible by the 2013 Cholesterol Guideline.3 Compared with statin‐ineligible adults, the statin‐eligible group (1) was older, more often male and white or black, and less often Hispanic; (2) had lower educational attainment but similar incomes; (3) more often had health insurance; (4) reported more healthcare visits; (5) more often had hypertension, diabetes mellitus, and chronic kidney disease and smoked cigarettes; and (6) had higher body mass index, systolic and diastolic BP, total cholesterol and LDL‐C, and triglycerides but lower HDL‐C (Tables 2 and 3).
Estimates of ASCVD Prevention in Statin‐Eligible Adults Not Taking Statins
Data are provided for the number of adults in the various groups of statin‐eligible adults, (1) all statin‐eligible adults combined, (2) only statin‐eligible adults with ASCVD10 ≥7.5%, and (3) only statin‐eligible adults with ASCVD10 <7.5%. Treating all statin‐eligible adults is estimated to prevent 2 435 890 events over 10 years or 243 589 events/year. For this group, ARR is 5.4%, with 10‐year NNT of 18. Treating only statin‐eligible adults with ASCVD10 ≥7.5% prevents an estimated 2 179 743 events over 10 years or 217 974 events/year; ARR is 6.8% with NNT of 15. For statin‐eligible adults with ASCVD10 <7.5%, ARR is 2.0% with NNT of 49. Table 3 also provides data assuming that 75% and 50% of all statin‐eligible adults receive statins with the expected proportionate reductions in numbers of individuals treated and ASCVD events prevented (Table 4).
Table 4.
ASCVD Events Prevented in 10 Years by Statin‐Eligible Group and When the Percentages of Statin‐Eligible Adults on Statins Vary
| Variable Statin‐Eligible Group | Sample, n | Population, N | Statin Intensity | ∅Statin ASCVD10, % | ∅Statin ASCVD10, n | ⊕Statin ASCVD10, n | Change ASCVD10 Events, n | ASCVD10 RRR, % | ASCVD10 ARR, % | NNT |
|---|---|---|---|---|---|---|---|---|---|---|
| ASCVD | 242 | 5 734 435 | High | 36.6 | 2 098 412 | 1 472 264 | 626 148 | 30.2 | 10.9 | 9 |
| LDL ≥190 | 142 | 5 016 479 | High | 9.5 | 478 091 | 207 871 | 270 220 | 63.6 | 5.4 | 19 |
| ⊕DM ASCVD10 ≥7.5% | 273 | 5 435 130 | Moderate‐higha | 20.3 | 1 102 617 | 751 566 | 351 051 | 35.0 | 6.5 | 15 |
| ⊕DM ASCVD10 <7.5% | 99 | 3 229 536 | Moderate | 4.3 | 138 162 | 94 013 | 44 148 | 32.2 | 1.4 | 73 |
| ∅DM ASCVD10 ≥7.5% | 589 | 16 022 464 | Moderate‐Highb | 13.5 | 2 161 319 | 1 228 995 | 932 324 | 44.8 | 5.8 | 17 |
| ∅DM ASCVD10 5–7.4% | 277 | 9 405 669 | Moderate | 6.3 | 590 423 | 378 424 | 211 999 | 35.9 | 2.3 | 44 |
| 100% statin‐eligible treated | 1622 | 44 843 712 | 14.6 | 6 569 024 | 4 133 133 | 2 435 890 | 41.1 | 5.4 | 18 | |
| Only ASCVD10 ≥7.5%c | 1246 | 32 208 508 | 18.1 | 5 840 439 | 3 660 696 | 2 179 743 | 43.5 | 6.8 | 15 | |
| Only ASCVD10 <7.5%d | 376 | 12 635 205 | 5.8 | 728 585 | 472 437 | 256 147 | 35.0 | 2.0 | 49 | |
| 75% statin‐eligible treated | 1216 | 33 632 784 | 14.6 | 4 926 768 | 3 099 850 | 1 826 918 | 41.1 | 5.4 | 18 | |
| Only ASCVD10 ≥7.5%c | 934 | 24 156 381 | 18.1 | 4 380 329 | 2 745 522 | 1 634 807 | 43.5 | 6.8 | 15 | |
| Only ASCVD10 <7.5%d | 282 | 9 476 403 | 5.8 | 546 439 | 354 328 | 192 110 | 35.0 | 2.0 | 49 | |
| 50% statin‐eligible treated | 811 | 22 421 856 | 14.7 | 3 284 512 | 2 066 567 | 1 217 945 | 41.1 | 5.4 | 18 | |
| Only ASCVD10 ≥7.5%c | 623 | 16 104 254 | 18.1 | 2 920 220 | 1 830 348 | 1 089 872 | 43.5 | 6.8 | 15 | |
| Only ASCVD10 <7.5%d | 188 | 6 317 602 | 5.8 | 364 292 | 236 218 | 128 074 | 35.0 | 2.0 | 49 |
ASCVD indicates atherosclerotic cardiovascular disease. ⊕ Statin ASCVD10, n indicates number of ASCVD events over 10 years with statins; ⊕DM, DM present; ∅DM, DM absent; ∅Statin ASCVD10, %, 10‐year ASCVD risk without a statin; ∅Statin ASCVD10, n, number of ASCVD events over 10 years without a statin; ARR, absolute risk reduction; DM, diabetes mellitus; NNT, 10‐year number needed‐to‐treat to prevent an ASCVD event; RRR, relative risk reduction.
Fifty percent of patients with (⊕) diabetes mellitus (DM) and ASCVD10 ≥7.5% receive high‐intensity and 50% receive moderate‐intensity statins.
Seventy‐five percent of patients without (∅) diabetes mellitus receive high‐intensity and 25% receive moderate‐intensity statins.
Includes ASCVD, LDL ≥190, and patients with and without diabetes mellitus and 10‐year ASCVD risk (ASCVD10) ≥7.5% and excludes lower‐risk participants with (⊕) diabetes mellitus (DM) and ASCVD10 <7.5% and without (∅) diabetes mellitus (DM) and ASCVD10 5–7.4%.
Includes only lower risk participants with diabetes mellitus and ASCVD10 <7.5% and without diabetes and ASCVD10 5–7.4%.
Changes in ARR and NNT When Varying the Proportion of Adults With ASCVD10 Risk ≥7.5% Taking Moderate‐ or High‐Intensity Statins
Adults with diabetes mellitus and ASCVD10 risk ≥7.5% have a 1A recommendation for moderate‐intensity and a IIaB recommendation for high‐intensity statins (Table 4, Figure 2). Adults without diabetes mellitus and ASCVD10 risk ≥7.5% have a 1A recommendation for moderate‐ to high‐intensity statins. The absolute number of ASCVD events prevented and ARR increase as the proportion of adults on high‐intensity statins increases (Table 5), whereas NNT falls (Figure 2).
Figure 2.

Absolute risk reduction (ARR) in 10‐year risk for atherosclerotic cardiovascular disease (ASCVD)10 and number needed‐to‐treat (NNT) to prevent an ASCVD event are depicted for adults with and without diabetes mellitus and with ASCVD 10 ≥7.5%. The data points reflect changes in ARR and NNT as the proportion of individuals taking moderate‐dose (MD) and high‐dose (HD) statins varies from 0% to 100% in 25% increments.
Table 5.
Sensitivity Analysis on Percentages of Adults With and Without Diabetes Mellitus and ASCVD10 ≥7.5%a Taking High‐ and Moderate‐Intensity Statins
| Variable Statin Eligible Group | Sample, n | Population, N | Statin Intensity | ∅Statin ASCVD10, % | ∅Statin ASCVD10, n | ⊕Statin ASCVD10, n | Change ASCVD10 Events, n | ASCVD10 RRR, % | ASCVD10 ARR, % | NNT |
|---|---|---|---|---|---|---|---|---|---|---|
| 100% Moderate‐intensity statin | ||||||||||
| ⊕DM ASCVD10 ≥7.5%b | 273 | 5 435 130 | Moderate | 20.3 | 1 102 617 | 814 563 | 288 504 | 28.8 | 5.3 | 19 |
| ∅DM ASCVD10 ≥7.5%c | 589 | 16 022 464 | Moderate | 13.5 | 2 161 319 | 1 450 004 | 711 316 | 34.3 | 4.4 | 23 |
| 75% Moderate‐, 25% high‐intensity statin | ||||||||||
| ⊕DM ASCVD10 ≥7.5%b | 273 | 5 435 130 | Moderate‐high | 20.3 | 1 102 617 | 782 347 | 320 270 | 32.0 | 5.9 | 17 |
| ∅DM ASCVD10 ≥7.5%c | 589 | 16 022 464 | Moderate‐high | 13.5 | 2 161 319 | 1 374 589 | 786 730 | 37.9 | 4.9 | 20 |
| 50% Moderate‐ and 50% high‐intensity statin | ||||||||||
| ⊕DM ASCVD10 ≥7.5%b | 273 | 5 435 130 | Moderate‐high | 20.3 | 1 102 617 | 751 566 | 351 051 | 35.0 | 6.5 | 15 |
| ∅DM ASCVD10 ≥7.5%c | 589 | 16 022 464 | Moderate‐high | 13.5 | 2 161 319 | 1 303 415 | 857 905 | 41.3 | 5.4 | 19 |
| 25% Moderate‐ and 75% high‐intensity | ||||||||||
| ⊕DM ASCVD10 ≥7.5%b | 273 | 5 435 130 | Moderate‐high | 20.3 | 1 102 617 | 722 149 | 380 468 | 37.8 | 7.0 | 14 |
| ∅DM ASCVD10 ≥7.5%c | 589 | 16 022 464 | Moderate‐high | 13.5 | 2 161 319 | 1 228 995 | 932 324 | 44.8 | 5.8 | 17 |
| 100% High‐intensity statin | ||||||||||
| ⊕DM ASCVD10 ≥7.5%b | 273 | 5 435 130 | High | 20.3 | 1 102 617 | 694 028 | 408 588 | 40.5 | 7.5 | 13 |
| ∅DM ASCVD10 ≥7.5%c | 589 | 16 022 464 | High | 13.5 | 2 161 319 | 1 172 783 | 988 536 | 47.5 | 6.2 | 16 |
ASCVD indicates atherosclerotic cardiovascular disease; NNT, number needed‐to‐treat.
Participants with (⊕) and without (∅) diabetes mellitus (DM) and 10‐year ASCVD risk (ASCVD10) <7.5% have an indication only for moderate‐intensity statins and were excluded. Participants with ASCVD and LDL ≥190 have an indication for high‐intensity statins and were excluded.
Only participants with (⊕) diabetes mellitus (DM) who also had ASCVD10 ≥7.5% were included.
Only participants without (∅) DM and ASCVD10 ≥7.5% were included.
Discussion
Statins are recommended for the primary and secondary prevention of CHD and stroke.5, 6, 7 Given projections for a rapidly growing burden of cardiovascular disease in the United States,32 the role of statins merits attention. In the United States, there are more statin‐eligible adults not receiving statins than adults reporting statin use (Table 2). If all statin‐eligible adults were treated, or roughly 44.8 million individuals, then ≈243 589 ASCVD events annually or 2 435 890 events over 10 years (Table 4) could be prevented. The number of ASCVD events prevented is ≈78% of the Healthy People 2020 goal for cardiovascular disease prevention. Implementing the 2013 Cholesterol Guideline in statin‐eligible US adults is also relatively efficient with ARR of 5.4% and 10‐year NNT of 18.
Treating only statin‐eligible adults with 10‐year ASCVD risk ≥7.5% reduces the number of adults treated by 12.6 million individuals or 28.2% from 44.8 to 32.2 million. Yet, the number of ASCVD events prevented annually falls only 10.5% from 243 589 to 217 974, which is ≈70% of the Healthy People 2020 goal. For this higher‐risk group, ARR is 6.8% with 10‐year NNT of 15. The 2013 Cholesterol Guideline is less efficient for untreated, statin‐eligible adults with 10‐year ASCVD risk <7.5%, that is, treating 12.6 million adults in this group would prevent ≈256 147 events over 10 years or 25 615 annually, with ARR of 2.0% and 10‐year NNT of 49.
The feasibility of identifying and treating 100% of statin‐eligible but untreated adults is low. As an initial step, treating 50% of untreated, statin‐eligible adults would also have a positive impact on Healthy People 2020 goals for cardiovascular disease prevention and is credible for several reasons. First, 2 of 3 statin‐eligible but untreated adults report ≥2 healthcare visits annually (Table 2), which indicates opportunities for assessing ASCVD risk and statin eligibility. Second, 80% are insured, which suggests some financial support for screening and treatment. Third, treating half of statin‐eligible adults and continuing treatment in those currently on statins would bring statin therapy to 71% of statin‐eligible adults. This is comparable to the proportion of all adults with hypertension receiving pharmacotherapy since 2007–2008.22 Fourth, the majority of statin‐eligible but untreated adults also have hypertension with the majority receiving treatment and having ≥2 healthcare visits annually.22 Fifth, most statins are available as generics with several on discount formularies at <$50/year.33 Individuals prescribed generic statins experience fewer cardiovascular events and deaths than do individuals prescribed proprietary statins,34 which suggests the former are more likely than the latter to obtain and take statin medications. Sixth, the percentage of adults taking statins is growing faster than percentages of adults taking antihypertensive medications; that is, the prescribing gap between statins and antihypertensive medications is closing.35 The points provided could support a more ambitious target than treating 50% of untreated, statin‐eligible adults. Yet, the 50% target is an important step in moving to even higher treatment levels. The impact of raising the percentage of statin‐eligible adults taking statins from 50% to 75% is enumerated in Table 4.
Our principal analysis assumed that among adults with ASCVD ≥7.5%, 50% of those with diabetes mellitus would receive moderate‐intensity and the other would receive 50% high‐intensity statin. For the subset without diabetes mellitus, 25% were estimated to receive moderate‐ and 75% to receive high‐intensity statin. Since those were only estimates, sensitivity analyses were conducted, which varied the proportion taking moderate‐ and high‐intensity statins from 0% to 100%. ARR and the number of ASCVD events prevented rose as the proportion taking high‐intensity statins increased, whereas the NNT to prevent an ASCVD event fell (Table 5, Figure 2).
Cost‐effectiveness of statin therapy, while not the focus of our report, is relevant in extending treatment to millions of additional statin‐eligible patients. The cost per quality adjusted life‐year for adults with 10‐year ASCVD10 risk of 7.5% to <10% was estimated at $37 000.10 Lowering the treatment threshold further to an ASCVD10 of 4.0% raised the cost/quality‐adjusted life‐year to $81 000. Treating all adults ≥75 years old with ASCVD10 ≥7.5% led to a cost estimate of $25 200 per disability‐adjusted life‐year.36 The incremental cost‐effectiveness ratio per quality‐adjusted life‐year for high‐ versus moderate‐dose statins was <$50 000, a commonly accepted threshold for cost‐effectiveness, assuming a cost differential of <$1.70/day between the 2 statin doses.37
Safety is another important consideration when increasing the proportion of adults receiving statin therapy. Dr Robinson, co‐author of the 2013 Cholesterol Guideline,6 summarized safety data on statin therapy,14, 27, 28 which indicated that the 5‐year NNH was ≈167 for moderate‐ and 63 for high‐intensity statin therapy.19 With regard to the risk‐to‐benefit considerations with high‐ versus moderate‐intensity statin therapy, and assuming a linear relationship between 1‐ and 5‐year risk, the 5‐year NNT in adults with CHD taking high‐ versus moderate‐intensity statin is 31 to prevent a major vascular event versus an NNH of 100 for diabetes mellitus.15 Analyses from JUPITER indicate that statin‐related diabetes mellitus reflects a shortening of the latent period from prediabetes to diabetes mellitus by a few weeks. In JUPITER, only minimal changes in the fasting glucose and glycosylated hemoglobin values were observed among all statin‐treated participants.27
Limitations include a small sample of the US civilian population, partially explained by missing LDL‐C in over half of NHANES adults as previously noted (Figure 1).22 Health care is dynamic, and data from 2007 to 2012 may not reflect current realities. The potential for ASCVD prevention is limited by clinical barriers, such as lack of data to assess eligibility and failure to assess eligibility when data are available or to prescribe statins when appropriate for ASCVD risk. Patients may fail to fill prescriptions or persist in taking statins, yet substantial persistence with statin therapy at 3 years was documented.38 And, widely available, low‐cost generic statins improve outcomes relative to proprietary statins.33, 34
In summary, Healthy People 2020 aims to reduce CHD and stroke by 20%.5 Our estimates suggest that implementing the 2013 Cholesterol Guideline in all statin‐eligible adults, or ≈44.8 million individuals, would accomplish >75% of the Healthy People 2020 annual goal for ASCVD prevention. Implementing the 2013 Cholesterol Guideline in all statin‐eligible adults with ASCVD10 ≥7.5% could achieve ≈70% of Healthy People 2020 goals, while reducing the number of adults initiated on statin therapy to 32.2 million. An initial step of treating only half of statin‐eligible adults would make a substantial impact in reducing cardiovascular events. Given the projected health benefits and in view of clinical safety and cost‐effectiveness considerations, public health, healthcare policy, and population healthcare initiatives to effectively implement the 2013 Cholesterol Guideline appear justified, especially for those with a 10‐year ASCVD risk of ≥7.5%. These initiatives have the potential to enhance success with an important Healthy People 2020 goal for cardiovascular disease prevention and to attenuate a large projected increase in the burden of ASCVD.32
Sources of Funding
This research was supported in part by funding from the Centers for Disease Control through the South Carolina Department of Health and Environmental Control and from the Health Research Services Administration through the Medical University of South Carolina. The funding agencies did not participate in the design and conduct of the study or collection, management, analysis and interpretation of the data, or in preparation, review and approval of the manuscript.
Disclosures
Dr Egan has received royalties from UpToDate, research support from Medtronic and Quintiles, and income as a consultant from AstraZeneca and Medtronic. Dr Ferdinand has received research support from Boehringer Ingelheim and income as a consultant from Boehringer Ingelheim, Amgen, Sanofi. Dr White has received income as a consultant form Merck & Co. The other authors have nothing to disclose.
(J Am Heart Assoc. 2016;5:e003558 doi: 10.1161/JAHA.116.003558)
References
- 1. Stroke Facts . Available at: http://www.cdc.gov/stroke/facts.htm. Accessed March 02, 2016.
- 2. Heart Disease Facts . Available at: http://www.cdc.gov/heartdisease/facts.htm. Accessed March 02, 2016.
- 3. US Burden of Disease Collaborators . The State of US Health, 1990–2010. Burden of disease, injuries and risk factors. JAMA. 2013;310:591–608. [DOI] [PMC free article] [PubMed] [Google Scholar]
- 4. About Healthy People . Available at: https://www.healthypeople.gov/2020/About-Healthy-People. Accessed March 09, 2016.
- 5. Healthy People 2020 Objectives . Available at: http://www.healthypeople.gov/2020/topicsobjectives2020/default.aspx. Accessed May 01, 2016.
- 6. Stone NJ, Robinson JG, Lichtenstein AH, Merz CNB, Blum CB, Eckel RH, Goldberg AC, Godon D, Levy D, Lloyd‐Jones DM, McBride P, Schwartz JS, Shero ST, Smith SC Jr, Watson K, Wilson PWF. 2013 ACC/AHA guideline on the treatment of blood cholesterol to reduce athersclerotic cardiovascular risk in adults: a report of the American College of Cardiology/American Heart Association Task Force on Practice Guidelines. Circulation. 2014;129(25 Suppl 2):S1–S45. [DOI] [PubMed] [Google Scholar]
- 7. Taylor F, Huffman MD, Macedo TH, Moore TH, Burke M, Davey Smith G, Ward K, Ebrahim S. Statins for the primary prevention of cardiovascular disease. Cochrane Database Syst Rev. 2013;1:1–100. [DOI] [PMC free article] [PubMed] [Google Scholar]
- 8. Lardizabal JA, Deedwania P. Lipid‐lowering therapy with statins for the primary and secondary prevention of cardiovascular disease. Cardiol Clin. 2011;29:87–103. [DOI] [PubMed] [Google Scholar]
- 9. Pencina MJ, Navar‐Boggan AM, D'Agostino RB, Williams K, Neely B, Sniderman AD, Peterson ED. Application of new cholesterol guidelines to a population‐based sample. N Engl J Med. 2014;370:1422–1431. [DOI] [PubMed] [Google Scholar]
- 10. Pursnani A, Massaro JM, D'Agostino RB, O'Donnell CJ, Hoffmann U. Guideline‐based statin eligilibility, coronary artery calcification, and cardiovascular events. JAMA. 2015;314:134–141. [DOI] [PMC free article] [PubMed] [Google Scholar]
- 11. Pandya A, Sy S, Cho S, Weinstein MC, Gaziano TA. Cost‐effectiveness of 10‐year risk thresholds for initiation of statin therapy for primary prevention of cardiovascular disease. JAMA. 2015;214:142–150. [DOI] [PMC free article] [PubMed] [Google Scholar]
- 12. Mills EJ, O'Regan C, Eyawo O, Wu P, Mills F, Berwanger O, Briel M. Intensive statin therapy compared with moderate dosing for prevention of cardiovascular events: a meta‐analysis of >40,000 patients. Eur Heart J. 2011;32:1409–1415. [DOI] [PubMed] [Google Scholar]
- 13. LaRosa JC, Grundy SM, Waters DC, Shear C, Barter P, Fruchart JC, Gotto AM, Greten H, Kastelein JJ, Shepherd J, Wenger NK; Treating to New Targets (TNT) Investigators . Intensive lipid lowering with atorvastatin in patients with stable coronary disease. N Engl J Med. 2005;352:1425–1435. [DOI] [PubMed] [Google Scholar]
- 14. Cholesterol Treatment Trialists Collaboration . Efficacy and safety of more intensive lowering of LDL cholesterol: a meta‐analysis of data from 170,000 participants in 26 randomised trials. Lancet. 2010;376:1670–1681. [DOI] [PMC free article] [PubMed] [Google Scholar]
- 15. Cholesterol Treatment Trialists (CTT) Collaborators . The effects of lowering LDL cholesterol with statin therapy in people at low risk of vascular disease: meta‐analysis of individual data from 27 randomised trials. Lancet. 2012;380:581–590. [DOI] [PMC free article] [PubMed] [Google Scholar]
- 16. Preiss D, Seshasai SR, Welsh P, Murphy SA, Ho JE, Waters DD, DeMicco DA, Barter P, Cannon CP, Sabatine MS, Braunwald E, Kastelein JJP, de Lemos JA, Blazing MA, Pedersen TR, Tikkanen MJ, Sattar N, Ray KK. Risk of incident diabetes with intensive‐dose compared with moderate‐dose statin therapy: a meta‐analysis. JAMA. 2011;305:2556–2564. [DOI] [PubMed] [Google Scholar]
- 17. Dormuth CR, Filion KB, Paterson JM, James MT, Teare GF, Raymond CB, Rahme E, Tamim H, Lipscombe L; for the Canadian Network for Observation Drug Effect Studies Investigators . Higher potency statins and the risk of new diabetes: multicentre, observational study of administrative databases. BMJ. 2014;348:g3244. [DOI] [PMC free article] [PubMed] [Google Scholar]
- 18. Silva M, Matthews ML, Jarvis C, Nolan NM, Belliveau P, Malloy M, Gandhi P. Meta‐analysis of drug‐induced adverse events associated with intensive‐dose statin therapy. Clin Ther. 2007;29:253–260. [DOI] [PubMed] [Google Scholar]
- 19. Robinson JG. Evidence for statins in secondary and primary prevention. Available at: https://www.lipid.org/sites/default/files/1-robinson_02_27_13.pdf. Accessed March 02, 2016.
- 20. Third Report of the National Cholesterol Education Program (NCEP) Expert Panel on detection, evaluation and treatment of high blood cholesterol in adults (Adult Treatment Panel III). Final Report. NIH Publication No.02‐5215, September, 2002. [PubMed]
- 21. Grundy SM, Cleeman JI, Bairey CN, Brewer HB Jr, Clark LT, Hunninghake DB, Pasternak RC, Smith SC Jr, Stone NJ. Implications of recent clinical trials for the National Cholesterol Education Program Adult Treatment Panel III Guidelines. Circulation. 2004;110:227–329. [DOI] [PubMed] [Google Scholar]
- 22. Egan BM, Li J, Hutchison FN, Ferdinand KC. Hypertension in the United States 1999–2012: progress toward Healthy People 2020 goals. Circulation. 2014;30:1692–1699. [DOI] [PMC free article] [PubMed] [Google Scholar]
- 23. Egan BM, Li J, Qanungo S, Wolfman TE. Blood pressure and cholesterol control in hypertensive hypercholesterolemic patients: a report from NHANES 1988–2010. Circulation. 2013;128:29–41. [DOI] [PMC free article] [PubMed] [Google Scholar]
- 24. Egan BM, Zhao Y, Axon RN. US trends in prevalence, awareness, treatment, and control of hypertension, 1988–2008. JAMA. 2010;303:2043–2050. [DOI] [PubMed] [Google Scholar]
- 25. Standards of medical care in diabetes—2014. American Diabetes Association. Diabetes Care. 2014;37(suppl 1):S14–S80. [DOI] [PubMed] [Google Scholar]
- 26. Levey AS, Stevens LA. Estimating GFR using the CKD epidemiology collaboration (CKD‐EPI) creatinine equation: more accurate GFR estimates, lower CKD prevalence estimates, and better risk predictions. Am J Kidney Dis. 2010;55:622–627. [DOI] [PMC free article] [PubMed] [Google Scholar]
- 27. Sattar N, Preiss D, Murray HM, Welsh P, Buckley BM, deCraen AJM, Seshasai SRK, McMurray JJ, Freeman DJ, Jukema JW, MacFarlane PW, Packard CJ, Stott DJ, Wetendorp RG, Shepherd J, Davis BR, Presel SL, Marchioli R, Marfisi RM, Maggioni AP, Tavazzi L, Tognoni L, Kjekshus J, Pedersen TR, Cook TJ, Gotto AM, Clearfield MB, Downs JR, Nakamuru H, Ohashi Y, Mizuno K, Ray KK, Ford I. Statins and risk of incident diabetes: a collaborative met‐analysis of randomised statin trials. Lancet. 2010;374:735–742. [DOI] [PubMed] [Google Scholar]
- 28. Ridker PM, Pradhan A, MacFadyen JG, Libby P, Glynn RJ. Cardiovasculara benefits and diabetes risks of statin therapy in primary preention: an anlysis from the JUPITER trial. Lancet. 2012;380:565–571. [DOI] [PMC free article] [PubMed] [Google Scholar]
- 29. Statin dose comparison. Pharmacist's Letter/Prescriber's Letter (PL) 2009;25:#250801 (full update October 2011).
- 30. Long‐Term Intervention with Pravastatin in Ischaemic Disease (LIPID) Study Group . Prevention of cardiovascular events and death with pravastatin in patients with coronary heart disease and a broad range of initial cholesterol levels. N Engl J Med. 1998;339:1349–1357. [DOI] [PubMed] [Google Scholar]
- 31. Sacks FM, Pfeffer MA, Moye LA, Rouleau JL, Rutherford JD, Cole TG, Brown L, Warnica JW, Arnold JMO, Wun C‐C, Davis BR, Braunwald E; for the Cholesterol and Recurrent Events Trial Investigators . The effect of pravastatin on coronary events after myocardial infarction in patients with average cholesterol levels. N Engl J Med. 1996;335:1001–1009. [DOI] [PubMed] [Google Scholar]
- 32. Heidenreich PA, Trogdon JG, Khavjou OA, Butler J, Dracup K, Ezekowitz MD, Finkelstein EA, Hong Y, Johnston SC, Khera A, Lloyd‐Jones DM, Nelson SA, Nichol G, Orenstein D, Wilson PWF, Woo UJ. Forecasting the future of cardiovascular disease in the United States. A policy statement from the American Heart Association. Circulation. 2011;123:933–944. [DOI] [PubMed] [Google Scholar]
- 33. Evaluating statin drugs to treat high cholesterol and heart disease. Consumer Reports Best Buy Drugs, updated March 2014. Available at: https://www.consumerreports.org/health/resources/pdf/best-buy-drugs/StatinsUpdate-FINAL.pdf. Accessed May 25, 2016.
- 34. Gagne JJ, Choudhry NK, Kseelheim AS, Polinski JM, Huthchins D, Matlin OS, Brennan T, Avorn J, Shrank W. Comparative effectiveness of generic and brand‐name statins on patient outcomes. Ann Intern Med. 2014;161:400–407. [DOI] [PubMed] [Google Scholar]
- 35. Kantor ED, Rehm CD, Haas JS, Chan AT, Glovannucci EL. Trends in prescription drug use among adults in the United States from 1999–2012. JAMA. 2015;314:1818–1831. [DOI] [PMC free article] [PubMed] [Google Scholar]
- 36. Odden MC, Pletcher MJ, Coxson PG, Thekkethala D, Guzman D, Heller D, Goldman L, Bibbins‐Domingo K. Cost‐effectiveness and population impact of statins for primary prevention in adults aged 75 years or older in the United States. Ann Intern Med. 2015;162:533–541. [DOI] [PMC free article] [PubMed] [Google Scholar]
- 37. Chan PS, Nallamouthu BK, Gurm HS, Hayward RA, Vijan S. Incremental benefit and cost‐effectiveness of high‐dose statin therapy in high‐risk patients with coronary artery disease. Circulation. 2007;115:2398–2409. [DOI] [PubMed] [Google Scholar]
- 38. Slejko JF, Ho PM, Anderson HD, Nair KV, Sullivan PW, Campbell JD. Adherence to statins in primary prevention: yearly adherence changes and outcomes. J Manag Care Pharm. 2014;20:51–57. [DOI] [PMC free article] [PubMed] [Google Scholar]