

Abstract
Background
After menopause, women exhibit a higher prevalence of the metabolic syndrome (MetS) and higher risk of cardiovascular disease. However, the timing of changes in MetS severity over the menopausal transition and whether these changes differ by racial/ethnic group remain unclear.
Methods and Results
We assessed data from 1470 women from the Atherosclerosis Risk in Communities cohort who experienced transition in menopausal status over 10 years (visits 1–4). We used linear mixed models to evaluate changes by menopausal status (premenopause, perimenopause, and postmenopause) in a MetS severity Z‐score and in the individual MetS components. While there were gradual increases in MetS severity over time across menopause stages, black women in particular exhibited more rapid progression in MetS severity during the premenopausal and perimenopausal periods than during the postmenopausal period. In the postmenopausal period (compared with prior periods), white women exhibited unfavorable decreases in high‐density lipoprotein, while black women exhibited favorable alterations in the rate of change for waist circumference, triglycerides, high‐density lipoprotein, and glucose, contributing to the slowed progression of MetS severity. These changes were all observed after adjusting for hormone replacement treatment.
Conclusions
During menopausal transition, women exhibited rapid increases in MetS severity during the premenopausal and perimenopausal periods, with black women having significant reductions in this increase in severity during the postmenopausal period. These data suggest that the higher prevalence of MetS in postmenopausal women may be caused more by changes during the menopausal transition than by postmenopause. These findings may thus have implications regarding the timing of cardiovascular risk relative to menopause.
Keywords: cardiovascular disease risk factors, menopause, metabolic syndrome, race and ethnicity, type 2 diabetes mellitus
Subject Categories: Cardiovascular Disease; Risk Factors; Race and Ethnicity; Obesity; Diabetes, Type 2
Introduction
The transition through menopause has been implicated in a significant increase in risk for cardiovascular disease (CVD) to a point where postmenopausal women have rates of CVD equal to or greater than those seen in men.1, 2 Many have hypothesized that this higher CVD risk is related to an increase in the metabolic syndrome (MetS) during the menopausal transition, beyond what is seen from aging alone.3 Cross‐sectional studies have demonstrated that compared with premenopausal women, postmenopausal women have significantly more visceral obesity4 and MetS.5 However, it remains unclear whether these processes progress more rapidly during the transition through menopause or during the postmenopausal period.3
Longitudinal studies that followed premenopausal women and compared changes in visceral adiposity between those who did and did not progress through menopause noted significant advances in visceral adiposity6, 7 and the prevalence of MetS among those who became postmenopausal during the study period. However, close examination of the data reveals that those who remained premenopausal at follow‐up had advances in these measures of similar or greater degree than those who completed menopause.1, 6, 7 In some cases, the rate of change of components of MetS or insulin sensitivity appeared to be slower after menopausal transition—even among women who did not take hormone replacement.1, 7 Janssen et al reported that among 1644 women followed through the menopausal transition, the yearly change in triglyceride levels slowed significantly after the final menstrual period, while systolic blood pressure decreased after menopause.1 Conversely, high‐density lipoprotein (HDL) cholesterol levels unfavorably decreased after menopause, while the rate of change in waist circumference did not differ. Finally, among these women, blacks were less likely than whites to develop MetS over the menopausal transition (odds ratio 0.74), though this failed to reach statistical significance.1 Thus, the overall change in MetS during the menopausal transition, its timing, and any racial/ethnic difference in these changes remain unclear.
We recently developed a MetS severity score8, 9 that is linked to long‐term risk of CVD10 and diabetes.11 We noted that the rate of increase in MetS severity was significantly higher among middle‐aged women than among middle‐aged men.12 The goal of the current project was to assess participants of the Atherosclerosis Risk in Communities (ARIC) study for changes in the rate of progression of MetS severity during the menopausal transition, including whether these rates varied by race/ethnicity. We hypothesized that given the potential for women to have greater visceral fat after menopause (because of insufficient estrogen levels), MetS would worsen more rapidly after menopause compared with before or during perimenopausal years. Such data could clarify the timing of change in a key CVD risk factor among postmenopausal women.
Methods
ARIC is a large community‐based epidemiological cohort study that started in 1987–1989 across 4 field centers in the United States. Further details regarding study design and objectives are published elsewhere.13 A total of 5943 white women and 2464 black women were enrolled. The institutional review boards of the following participating institutions approved the study: University of Mississippi Medical Center, Jackson State University, Tougaloo College, University of North Carolina, University of Minnesota, Johns Hopkins University, and University of Florida. All participants provided written informed consent.
Menopausal status among women who reported having had menstrual periods (ie, those without primary amenorrhea) was categorized following the technique of Nabulsi for this cohort.14 At each visit, women were asked, “Have you had any menstrual periods during the past 2 years?” and “Have you reached menopause?” They were also asked questions related to the surgical removal of ovaries and uterus. Women who had a menstrual period within the previous 2 years but denied current menopause were classified as “premenopausal.” Women who had a menstrual period within the previous 2 years and answered “yes” or “uncertain” to the question regarding current menopause were classified as “perimenopausal.” Women who had not had a menstrual period within the previous 2 years and did not have surgical removal of ovaries or uterus were classified as natural “postmenopausal.” Our analysis data set included only those women 60 years and younger at baseline with fasting laboratory values, baseline menopause information, and no history of coronary heart disease or diabetes at baseline (see Figure S1). Because we were interested specifically in changes in MetS severity during the menopausal transition, we restricted our primary analysis to women who progressed in their menopausal stage over the course of the 4 visits, either from premenopausal to perimenopausal, premenopausal to postmenopausal, or perimenopausal to postmenopausal. As an overall comparison of the rate of change in MetS severity, we also assessed for MetS changes in women who were postmenopausal at baseline. The minimum entry age for ARIC (45 years) precluded our ability to assess women who remained premenopausal through all 4 visits.
Women were asked regarding use of current hormonal replacement therapy (regardless of route of administration) at each visit; these data were categorized as estrogen, estrogen plus progesterone, or none in assessing the relationship between current hormone replacement therapy as related to the change in MetS severity. We did not find significant differences in the change in MetS over time between estrogen and estrogen plus progesterone and thus grouped these together in the final analysis to maximize power.
MetS severity Z scores were calculated for participants at all 4 visits by using sex‐ and race‐based formulas. As described elsewhere,8, 9 these scores were derived by using a confirmatory factor analysis approach for the 5 traditional MetS components (waist circumference, triglycerides, HDL cholesterol, systolic blood pressure, fasting glucose) to determine the weighted contribution of each of these components to a latent MetS “factor” on a sex‐ and race/ethnicity‐specific basis. Confirmatory factor analysis was performed among adults aged 20 to 64 years from the National Health and Nutrition Examination Survey (NHANES) with categorization into 6 subgroups based on sex and the following self‐identified race/ethnicities: non‐Hispanic white, non‐Hispanic black, and Hispanic. For each of these 6 population subgroups, loading coefficients for the 5 MetS components were determined toward a single MetS factor. These loading coefficients were used to generate equations to calculate a standardized MetS severity score for each subgroup (http://mets.health-outcomes-policy.ufl.edu/calculator/). The resulting MetS severity scores are Z scores (normally distributed and ranging from theoretical negative infinity to theoretical positive infinity with mean=0 and SD=1) of relative MetS severity on a sex‐ and race/ethnicity‐specific basis. These scores are highly correlated to other surrogate markers of MetS risk, including high‐sensitivity C‐reactive protein,8 uric acid,8 the Homeostasis Model of Insulin Resistance,8 and adiponectin,15 and were recently shown to correlate with long‐term CVD10, 15 and type 2 diabetes mellitus (T2DM)11, 15 risk in the Princeton Lipid Research Cohort Study. These scores were also examined descriptively over time in ARIC.12
All statistical analyses were performed by using SAS Version 9.4, and statistical significance was set to α=0.05. Descriptive statistics were calculated at baseline and across the 4 visits of the study. The primary outcome was MetS severity as measured by the Z‐score described earlier. The traditional MetS components (waist circumference, HDL, triglycerides, fasting glucose, systolic blood pressure) that compose the Z‐score were also examined individually. Linear mixed models were used to model MetS Z‐score over time (as a function of years postbaseline) among women who progressed in their menopausal stage at some level during ARIC, including a random intercept and random slope to effectively account for the correlation among observations from each participant. Our focus on only women who had ≥1 menopausal transition during the study naturally limited our analysis to primarily women who remained in the study. Nonetheless, missing MetS scores at follow‐up visits was possible, and the mixed‐model approach allows for this missingness assuming a random missing mechanism. A linear spline approach with 2 knots was used among the fixed effect of years postbaseline, which allowed for a linear slope during premenopause as well as increments to this slope during the perimenopausal and postmenopausal stages individually. To summarize, the following model was fit, showing only the fixed effects of primary interest:
Here, for a given participant i, years begins at 0 for her initial visit (j=1), and for each additional visit (j=2,3,4), the number of years relative to the first visit allows for estimation of a “baseline” increase in MetS severity that would represent the increase during the premenopausal stage (β1). For those visits where participant I reports to be perimenopausal or postmenopausal, the number of years in that stage (starting at 0 for the first visit with that report) enters into the equation given to allow for estimation of the parameters β2 and β3. Thus, β1+β2 represents the estimated slope during perimenopause, and β1+β3 represents the slope during postmenopause. The interaction with race was explored to assess whether the magnitude of these increases in severity over time differed between black and white women in all 3 stages. In the context of the given model, separate parameters were fit to estimate slopes for the 3 stages separately by race, which were then statistically tested between the 2 races. Finally, to account for possible confounding, age, education, baseline income, and use of hormone replacement therapy at each visit were included in the models that represent the central analysis and in any comparisons reassessed. Model‐estimated means were then produced over a 9‐year follow‐up period including model‐estimated changes between each of the 3 menopausal stages every 3 years to visualize the observed changes in slopes. Similar models were fit for each of the 5 MetS components (by using the natural log transformation for triglycerides to achieve normality). Inference about the fixed effects was based on the Kenward–Roger estimate of the denominator degrees of freedom. For triglycerides, these log‐transformed values were then backtransformed for the sake of data presentation.
Results
During the 4 visits of ARIC (median of 9 years of follow‐up), 1470 women exhibited a transition in menopausal status and were included in the central analysis. Of these 1470 women, 59 women (4%) dropped out after visit 2 and 121 (8%) dropped out after visit 3. Table 1 displays their characteristics by race. Black participants had higher baseline waist circumference, systolic blood pressure, and glucose but lower triglycerides and were more likely to have hypertension. White participants were more likely to be taking hormonal replacement therapy. An additional 2674 women who were postmenopausal and without diabetes at baseline and 270 women who remained premenopausal throughout the study were used as separate comparator groups (Table S1).
Table 1.
Baseline Descriptive Characteristics of the Women Who Observed Menopausal Transition During the Follow‐up Period
| Whites (n=1216) | Blacks (n=285) | P Valuea | |
|---|---|---|---|
| Baseline menopausal status | 0.763 | ||
| Premenopausal, n (%) | 822 (67.6) | 190 (66.7) | |
| Perimenopausal, n (%) | 394 (32.4) | 95 (33.3) | |
| Metabolic syndrome components | |||
| Waist circumference, cm, mean (SD) | 90.3 (14.3) | 99.4 (17.6) | <0.001 |
| Triglycerides, mg/dL, mean (SD) | 102.2 (54.1) | 91.7 (44.4) | <0.001 |
| High‐density lipoprotein, mg/dL, mean (SD) | 57.8 (15.6) | 58.3 (17.5) | 0.609 |
| Systolic blood pressure, mm Hg, mean (SD) | 112.5 (16.0) | 122.7 (19.2) | <0.001 |
| Glucose, mg/dL, mean (SD) | 95.6 (8.4) | 98.1 (9.8) | <0.001 |
| Metabolic syndrome Z‐score, mean (SD) | −0.3 (0.7) | 0.1 (0.8) | <0.001 |
| Age, y, mean (SD) | 49.3 (3.2) | 48.7 (3.0) | 0.014 |
| Hormonal use, n (%) | 163 (13.9) | 18 (6.4) | 0.001 |
| Current smoking, n (%) | 247 (20.3) | 63 (22.1) | 0.501 |
| Income status, n (%) | <0.001 | ||
| <$25 000 | 200 (17.2) | 169 (64.5) | |
| $25 000 to <$50 000 | 520 (44.8) | 68 (26.0) | |
| >$50 000 | 441 (38.0) | 25 (9.5) | |
| Education, n (%)b | <0.001 | ||
| Basic or no education | 112 (9.2) | 74 (26.0) | |
| Intermediate education | 600 (49.4) | 91 (31.9) | |
| Advanced education | 503 (41.4) | 120 (42.1) | |
| Hypertension, n (%) | 190 (15.7) | 127 (44.7) | <0.001 |
| Transition category during study, n (%) | 0.0059 | ||
| Premenopausal to perimenopausal | 191 (15.7) | 39 (13.7) | |
| Perimenopausal to postmenopausal | 394 (32.4) | 95 (33.3) | |
| Premenopausal to postmenopausal | 283 (23.3) | 91 (31.9) | |
| Premenopausal to perimenopausal to postmenopausal | 348 (28.6) | 60 (21.1) | |
t test for continuous variables; χ2 test for categorical variables.
Basic education was defined as 0 years of education, grade school or high school but no degree; Intermediate education was defined as high school graduate or vocational school; Advanced education was defined as college or graduate/professional school.
Table 2 shows model estimates of MetS severity Z‐scores by menopausal status and race. In models adjusted only for age, women overall, and black women in particular, exhibited a more rapid rate of increase in MetS severity during the premenopausal and perimenopausal periods compared with during the postmenopausal period (all P<0.05). The rate of increase in MetS severity during the premenopausal period was more rapid among black than among white women (P<0.001).
Table 2.
Mixed‐Model Parameter Estimates: MetS Z‐Score Over Time
| Model Parameter | Estimate | 95% CI | P Value |
|---|---|---|---|
| Intercept | −1.668 | −2.268 to −1.068 | <0.001 |
| Baseline age, y | 0.029 | 0.017 to 0.041 | <0.001 |
| Black | 0.424 | 0.324 to 0.524 | <0.001 |
| Linear slope for whites | |||
| Premenopausal | 0.065 | 0.058 to 0.072 | <0.001 |
| Perimenopausal | 0.072 | 0.065 to 0.080 | <0.001 |
| Postmenopausal | 0.051a , b | 0.042 to 0.060 | <0.001 |
| Linear slope for blacks | |||
| Premenopausal | 0.107 | 0.092 to 0.121 | <0.001 |
| Perimenopausal | 0.090 | 0.073 to 0.108 | <0.001 |
| Postmenopausal | 0.037a , b | 0.017 to 0.056 | 0.365 |
Blacks vs Whites slope comparisons (P‐values): premenopausal: P<0.001; perimenopausal: P=0.072; postmenopausal: P=0.182.
Significantly (P<0.05) different than premenopausal slope.
Significantly (P<0.05) different than perimenopausal slope.
Table 3 shows model estimates for the central analysis and Figure 1 shows model‐based mean MetS severity Z‐scores and average change in Z‐score by menopausal status and by race, in a model that included age, socioeconomic variables, and hormone use. Following adjustment for socioeconomic and hormone use, black women continued to have a slower progression of MetS Z‐scores during the postmenopausal period relative to earlier periods. For white women, there was a decrease in the rate of MetS progression from the perimenopausal period to the postmenopausal period (from 0.076 to 0.062), but this failed to reach statistical significance (P=0.106). Compared with white women, black women had a higher increase in MetS severity during the premenopausal and perimenopausal periods (P<0.001 and P=0.036, respectively). As a comparison, women who were postmenopausal at study entry (mean age 54 years) exhibited a rate of change in MetS severity Z‐scores of 0.057 (0.052, 0.062) per year for white women and 0.061 (0.053, 0.069) per year for black women (Tables S1 and S2), while women who remained premenopausal throughout the study (mean age 45 years) had a rate of change of 0.057 (0.039, 0.074) for white women and 0.115 (0.080, 0.150) for black women (Table S3). Use of estrogen replacement therapy was not associated with slope in MetS severity during any of the menopausal stages. A sensitivity analysis that excluded women who had menopause because of surgical removal of ovaries resulted in similar results.
Table 3.
Mixed‐Model Parameter Estimates: MetS Z‐Score Over Time—Adjusted for Hormone Use and Other SES Variables
| Model Parameter | Estimate | 95% CI | P Value |
|---|---|---|---|
| Intercept | −1.613 | −2.210 to −1.015 | <0.001 |
| Baseline age, y | 0.022 | 0.009 to 0.034 | <0.001 |
| Black | 0.288 | 0.177 to 0.399 | <0.001 |
| Baseline education (vs advanced education) | |||
| Basic or no education | 0.448 | 0.314 to 0.582 | <0.001 |
| Intermediate education | 0.230 | 0.145, 0.315 | <0.001 |
| Baseline annual income (vs >$50 000) | |||
| <$25 000 | 0.265 | 0.147 to 0.383 | <0.001 |
| $25 000 to $50 000 | 0.210 | 0.119 to 0.302 | <0.001 |
| Hormone use | −0.021 | −0.087 to 0.046 | 0.538 |
| Hormone use change in slope during | |||
| Premenopause | −0.014 | −0.031 to 0.002 | 0.078 |
| Perimenopause | 0.007 | −0.013 to 0.027 | 0.496 |
| Postmenopause | −0.015 | −0.041 to 0.011 | 0.261 |
| Linear slope for whites | |||
| Premenopause | 0.071 | 0.062 to 0.080 | <0.001 |
| Perimenopause | 0.076 | 0.064 to 0.088 | <0.001 |
| Postmenopause | 0.062 | 0.050 to 0.075 | <0.001 |
| Linear slope for blacks | |||
| Premenopause | 0.112 | 0.094 to 0.130 | <0.001 |
| Perimenopause | 0.101 | 0.079 to 0.122 | <0.001 |
| Postmenopause | 0.038a , b | 0.015 to 0.062 | 0.002 |
Blacks vs whites slope comparisons (P‐values): premenopausal: P<0.001; perimenopausal: P=0.036; postmenopausal: P=0.067.
Significantly (P<0.05) different than premenopausal slope.
Significantly (P<0.05) different than perimenopausal slope.
Figure 1.
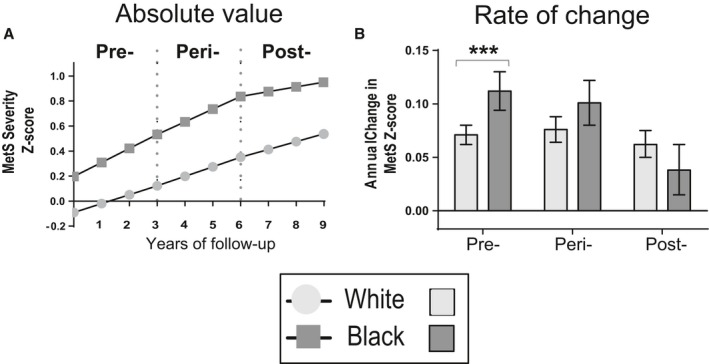
Model‐generated MetS severity score over time and rate of change by menopausal status. Mean and 95% confidence intervals are shown for white (light grey) and black (dark grey) participants who exhibited menopausal transition over the 4 visits of ARIC. Rates of change in MetS severity were higher among participants who were premenopausal and perimenopausal compared with those who were postmenopausal, specifically among black women. The model included age, education, family income and hormone use. Significance between race: ***P<0.001.
Figure 2 shows model‐based mean levels and average change in the individual components of MetS from models that included age, socioeconomic variables, and hormone use. Among white women, the rate of change was slower during the postmenopausal (compared with both premenopausal and perimenopausal periods for triglycerides and glucose; P<0.05, P<0.01). Among black women, there were significant decreases in the rates of change during the postmenopausal period (versus the premenopausal and perimenopausal period) for waist circumference (P<0.001) and glucose (P<0.001), while the rate of change of triglycerides (P<0.05) was slower for the postmenopausal period compared with the premenopausal period (P<0.05), and the rate of change for systolic blood pressure (P<0.05) was greater during the postmenopausal period compared with during the perimenopausal period. These rates of change differed by race over the menopausal transition, with black women exhibiting more favorable rates of change during the postmenopausal period than white women with respect to waist circumference (P<0.001), triglycerides (P<0.01), HDL (P<0.05), and fasting glucose (P<0.05).
Figure 2.
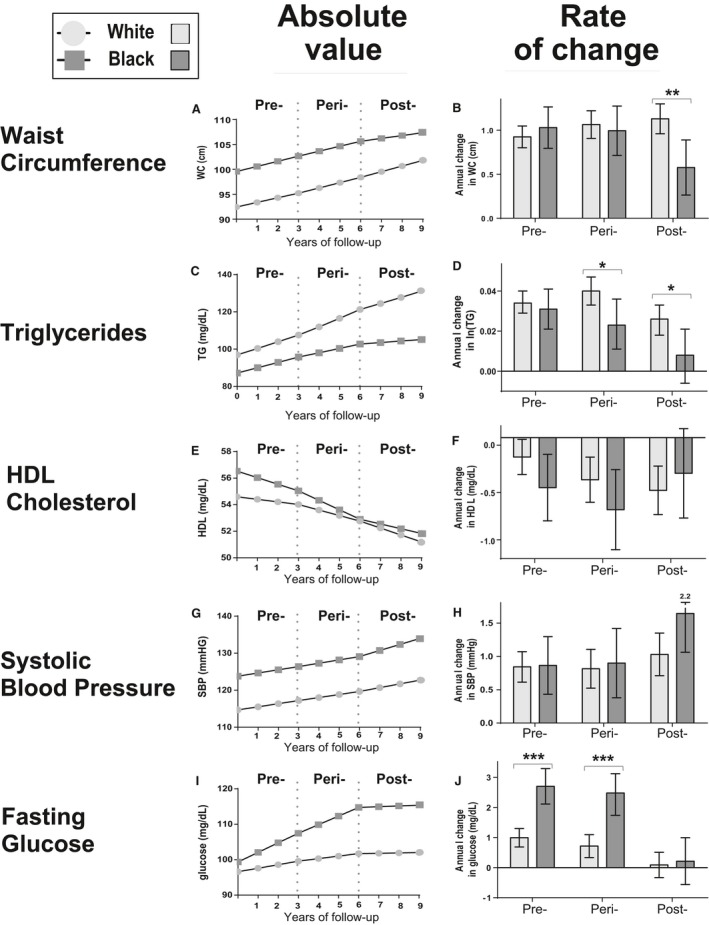
Model‐generated MetS components over time and rate of change by menopausal status. Mean and 95% confidence intervals are shown for white (light grey) and black (dark grey) participants who exhibited menopausal transition over the 4 visits of ARIC. All models included age, education, family income and hormone use. Significance between race: *P<0.05; **P<0.01; ***P<0.001. For significance in differences in rate of change between menopausal period within races, see text.
Discussion
We found that both overall and particularly among black women in ARIC, the rate of increase in MetS severity was rapid during the menopausal transition and decreased afterward. This most closely paralleled a rapid rise in triglyceride levels, as had been noted in previous studies of women during menopause.1, 16 While there has been appreciation of higher prevalence of ATP‐III MetS in postmenopausal versus premenopausal women,1, 3, 5 our study is unique in using an integrated assessment of MetS severity to demonstrate that this higher prevalence of MetS appear to be because of rapid progression of MetS severity in the years leading up to menopause (the late premenopausal and perimenopausal periods) and less because of progression after menopause. These rates (yearly increases in MetS Z‐score of 0.069–0.113/y during the premenopausal and perimenopausal period) appeared higher than those among men in ARIC (who exhibited increases of on average 0.03/y12), similar to women who were premenopausal throughout the study (increases of 0.057–0.115/y) and slightly higher than women who were postmenopausal at baseline (increases of 0.057–0.061/y). Given long‐term links between MetS severity and future diabetes type 211 and CVD,10 these data may have implications for relationships between worsening MetS and increased CVD risk after menopause.2
We were especially struck by the difference in progression of MetS severity between black and white women. We had previously documented that current criteria for diagnosing MetS did not identify apparent risk among blacks. There is particularly among black men a low rate of MetS diagnosis compared with whites men despite worsened insulin resistance and higher rates of chronic disease associated with MetS.17, 18, 19, 20 It is for this reason that we formulated the MetS severity score to be sex and race/ethnicity specific, by using confirmatory factor analysis to account for how MetS was manifest in each sex and racial/ethnic group.8, 9 It is possible that the relative race/ethnicity‐specific nature of this score is the reason that we noted a difference between black and white women when other analyses of MetS during menopause had failed to do so.1 It is also possible that the higher MetS severity scores in black women compared with those in white women reflect that these scores had yielded a theoretical maximum, contributing to the lower rate of change in menopause. Nevertheless, in our analysis, black women exhibited more rapid increases in fasting glucose in the years leading up to menopause at a time when these levels were already higher than in white women, suggesting that these changes may indeed represent biological differences in diabetes risk by race/ethnicity over the menopausal transition. The reason for these racial differences is unclear but did not appear to be because of socioeconomic status, education, or hormone replacement therapy, which were included in the models.
The proportion of participants taking estrogen replacement therapy after menopause were high in this study, with higher use among white (13.8%) versus black (6.6%) women, raising potential that this discrepancy in hormone replacement could account for the racial differences in MetS progression among postmenopausal women in the study. Oral (but not transdermal or vaginal) administration of estrogen suppresses fat oxidation, contributing to increased body fat while administration of transdermal estrogen did not change levels of body fat over time.21, 22, 23 While we lacked data regarding the route of estrogen administration during the study, visit 4 of ARIC completed in 1998, at which point >75% of estrogen replacement was oral.24 Topical or vaginal estrogen replacement, as is more common currently, was found to improve lean body mass without affecting fat mass.21, 22, 23 We did not note differences in the rate of change in MetS severity by current estrogen use—although we lacked data regarding dose and adherence to estrogen use, which may have further influenced any effect. Overall, however, hormone replacement did not appear to explain the racial differences in MetS severity.
The mechanisms behind the slower rate progression of MetS severity after menopause are unclear but could be related to changes in estrogen levels and related action of adipocytes and hepatic function.3, 25, 26 Tepper et al demonstrated that while there is an overall decline in estradiol levels between 6 years before and 1 year after the final menstrual period (when estradiol levels stabilize), the pattern of this decline is variable. In 60% of white and 25% of black women, there is an initial rise in estradiol to 50% above baseline.27 While we lacked estradiol levels among the women in ARIC, the duration of these fluctuations in estradiol before stabilization coincides temporally with the time frame of more rapid MetS changes during the menopausal transition. As mentioned previously, oral estradiol decreases fatty acid oxidation.23 Nevertheless, it remains unclear why endogenous increases and then decreases in estradiol would be involved in a rise in triglycerides and/or other MetS components.
Many of the changes in MetS during the menopausal transition have previously been attributed to the effect of decreasing levels of estradiol on the transition between gynecoid and android body habitus. Women exhibit a tendency toward visceral fat accumulation during the menopausal transition, though it is difficult to separate the influence of menopause from the natural tendency toward fat accumulation with age.6, 28 Certainly, mice that are deficient in estradiol (because of a genetic deletion of the gene for aromatase) exhibit an increase in visceral fat and resultant insulin resistance compared with their wild‐type counterparts.29 Contrary to our hypothesis, we found that the rate of change in waist circumference was not significantly different during the stages of the menopausal transition among white women, while black women in the sample exhibited a slower rate of change in waist circumference after menopause. These findings are consistent with data from prior clinical studies.1, 30 Sowers et al noted an increase in waist circumference the year after the final menstrual period followed by a stabilization (or even decrease) in waist circumference.30 Janssen et al noted steady increases in waist circumference over a period including 6 years before and 6 years after menopause.1 Thus, the effect of decreased estrogen on visceral fat mass may be less significant than the overall tendency toward weight gain by age.
This study had several limitations. We relied on a composite assessment of menopause, in which perimenopausal women were classified on the basis of having had a menstrual period in the 2 years before study visit but answered “yes” or “uncertain” regarding whether they had undergone menopause, while postmenopause was classified only among women who had not had a menstrual period for 2 years. Because menopause is most commonly categorized after 1 year without menses, the “perimenopausal” group included some women who had experienced menopause (as it is usually characterized) up to 1 year earlier. Nevertheless, we did not believe that this classification detracted significantly from our assessment because this study focused on changes observed during the years surrounding the menopausal transition. Indeed, the heterogeneous nature of women in the perimenopausal group could have been expected to bias the study toward a higher degree of variability and less likely to identify the changes that we observed. In addition, our findings of a slower rate of progression of MetS postmenopause remained true, even ignoring the perimenopausal classification and only comparing directly to the premenopausal group. Owing to the age of women at study entry and length of follow‐up, we lacked a group of women who were not in the age range for being near the timing of menopause, though the women in the study who remained premenopausal had similar rates to the perimenopausal women. While the mixed models we used allowed for missing data, it is possible that dropout was nonignorable, as women who remained in the study may have been healthier than those who dropped out. However, the relatively low rates of dropout given the nature of the primary sample most likely does not bias the slope comparisons between whites and blacks. This study had significant strengths in following a large cohort longitudinally and assessing novel markers of MetS severity.
In conclusion, we found that the progression of MetS is rapid during the course of the menopausal transition but slows afterward among black women. This appears to be unrelated to hormone replacement and may have bearing on the higher prevalence of MetS among postmenopausal women and related cardiovascular and diabetes risk. Further research is needed to determine whether interventions during the menopausal transition such as diet, exercise, and insulin‐sensitizing medication could slow this rate of progression of MetS severity and lower risk of future disease.
Sources of Funding
This work was supported by National Institutes of Health grant 1R01HL120960 (Drs Gurka and DeBoer). The Atherosclerosis Risk in Communities Study is carried out as a collaborative study supported by National Heart, Lung, and Blood Institute contracts (HHSN268201100005C, HHSN268201100006C, HHSN268201100007C, HHSN268201100008C, HHSN268201100009C, HHSN268201100010C, HHSN268201100011C, and HHSN268201100012C).
Disclosures
None.
Supporting information
Table S1. Descriptive Characteristics of Women Who Did Not Transition (Premenopausal Throughout the Study, or Postmenopausal at Baseline)
Table S2. Mixed‐Model Parameter Estimates: MetS Z‐Score Over Time (Postmenopausal Women Only)
Table S3. Mixed‐Model Parameter Estimates: MetS Z‐Score Over Time (Premenopausal Women Only [n=240])
Figure S1. Consort diagram of analytic data set. CHD indicates coronary heart disease.
Acknowledgments
The authors thank the staff and participants of the ARIC study for their important contributions.
(J Am Heart Assoc. 2016;5:e003609 doi: 10.1161/JAHA.116.003609)
References
- 1. Janssen I, Powell LH, Crawford S, Lasley B, Sutton‐Tyrrell K. Menopause and the metabolic syndrome: the Study of Women's Health Across the Nation. Arch Intern Med. 2008;168:1568–1575. [DOI] [PMC free article] [PubMed] [Google Scholar]
- 2. Rosamond W, Flegal K, Friday G, Furie K, Go A, Greenlund K, Haase N, Ho M, Howard V, Kissela B, Kittner S, Lloyd‐Jones D, McDermott M, Meigs J, Moy C, Nichol G, O'Donnell CJ, Roger V, Rumsfeld J, Sorlie P, Steinberger J, Thom T, Wasserthiel‐Smoller S, Hong Y; Subcommittee AHASCaSS . Heart disease and stroke statistics—2007 update: a report from the American Heart Association Statistics Committee and Stroke Statistics Subcommittee. Circulation. 2007;115:e69–e171. [DOI] [PubMed] [Google Scholar]
- 3. Carr MC. The emergence of the metabolic syndrome with menopause. J Clin Endocrinol Metab. 2003;88:2404–2411. [DOI] [PubMed] [Google Scholar]
- 4. Tchernof A, Desmeules A, Richard C, Laberge P, Daris M, Mailloux J, Rhéaume C, Dupont P. Ovarian hormone status and abdominal visceral adipose tissue metabolism. J Clin Endocrinol Metab. 2004;89:3425–3430. [DOI] [PubMed] [Google Scholar]
- 5. Park YW, Zhu S, Palaniappan L, Heshka S, Carnethon MR, Heymsfield SB. The metabolic syndrome: prevalence and associated risk factor findings in the US population from the Third National Health and Nutrition Examination Survey, 1988–1994. Arch Intern Med. 2003;163:427–436. [DOI] [PMC free article] [PubMed] [Google Scholar]
- 6. Lovejoy JC, Champagne CM, de Jonge L, Xie H, Smith SR. Increased visceral fat and decreased energy expenditure during the menopausal transition. Int J Obes (Lond). 2008;32:949–958. [DOI] [PMC free article] [PubMed] [Google Scholar]
- 7. Abdulnour J, Doucet E, Brochu M, Lavoie JM, Strychar I, Rabasa‐Lhoret R, Prud'homme D. The effect of the menopausal transition on body composition and cardiometabolic risk factors: a Montreal‐Ottawa New Emerging Team group study. Menopause. 2012;19:760–767. [DOI] [PubMed] [Google Scholar]
- 8. Gurka MJ, Lilly CL, Norman OM, DeBoer MD. An examination of sex and racial/ethnic differences in the metabolic syndrome among adults: a confirmatory factor analysis and a resulting continuous severity score. Metabolism. 2014;63:218–225. [DOI] [PMC free article] [PubMed] [Google Scholar]
- 9. Gurka MJ, Ice CL, Sun SS, DeBoer MD. A confirmatory factor analysis of the metabolic syndrome in adolescents: an examination of sex and racial/ethnic differences. Cardiovasc Diabetol. 2012;11:128. [DOI] [PMC free article] [PubMed] [Google Scholar]
- 10. DeBoer MD, Gurka MJ, Woo JG, Morrison JA. Severity of metabolic syndrome as a predictor of cardiovascular disease between childhood and adulthood: the Princeton Lipid Research Cohort Study. J Am Coll Cardiol. 2015;66:755–757. [DOI] [PMC free article] [PubMed] [Google Scholar]
- 11. DeBoer MD, Gurka MJ, Woo JG, Morrison JA. Severity of the metabolic syndrome as a predictor of type 2 diabetes between childhood and adulthood: the Princeton Lipid Research Cohort Study. Diabetologia. 2015;58:2745–2752. [DOI] [PMC free article] [PubMed] [Google Scholar]
- 12. Vishnu A, Gurka MJ, DeBoer MD. The severity of the metabolic syndrome increases over time within individuals, independent of baseline metabolic syndrome status and medication use: the Atherosclerosis Risk in Communities Study. Atherosclerosis. 2015;243:278–285. [DOI] [PMC free article] [PubMed] [Google Scholar]
- 13. The Atherosclerosis Risk in Communities (ARIC) Study: design and objectives. The ARIC investigators. Am J Epidemiol. 1989;129:687–702. [PubMed] [Google Scholar]
- 14. Nabulsi AA, Folsom AR, White A, Patsch W, Heiss G, Wu KK, Szklo M. Association of hormone‐replacement therapy with various cardiovascular risk factors in postmenopausal women. The Atherosclerosis Risk in Communities Study Investigators. N Engl J Med. 1993;328:1069–1075. [DOI] [PubMed] [Google Scholar]
- 15. DeBoer DM, Gurka MJ, Morrison JA, Woo JG. Inter‐relationships between the severity of metabolic syndrome, insulin and adiponectin and their relationship to future type 2 diabetes and cardiovascular disease. Int J Obes. 2016; doi: 10.1038/ijo.2016.81. Available at: http://www.nature.com/ijo/journal/vaop/ncurrent/full/ijo201681a.html. Accessed July 12, 2016. [DOI] [PMC free article] [PubMed] [Google Scholar]
- 16. Lindquist O. Influence of the menopause on ischaemic heart disease and its risk factors and on bone mineral content. Acta Obstet Gynecol Scand Suppl. 1982;110:1–32. [PubMed] [Google Scholar]
- 17. Walker SE, Gurka MJ, Oliver MN, Johns DW, DeBoer MD. Racial/ethnic discrepancies in the metabolic syndrome begin in childhood and persist after adjustment for environmental factors. Nutr Metab Cardiovasc Dis. 2012;22:141–148. [DOI] [PMC free article] [PubMed] [Google Scholar]
- 18. DeBoer MD, Dong L, Gurka MJ. Racial/ethnic and sex differences in the ability of metabolic syndrome criteria to predict elevations in fasting insulin levels in adolescents. J Pediatr. 2011;159:975–981. [DOI] [PMC free article] [PubMed] [Google Scholar]
- 19. DeBoer MD, Gurka MJ, Sumner AE. Diagnosis of the metabolic syndrome is associated with disproportionately high levels of high‐sensitivity C‐reactive protein in non‐Hispanic black adolescents: an analysis of NHANES 1999–2008. Diabetes Care. 2011;34:734–740. [DOI] [PMC free article] [PubMed] [Google Scholar]
- 20. DeBoer MD, Gurka MJ. Low sensitivity for the metabolic syndrome to detect uric acid elevations in females and non‐Hispanic‐black male adolescents: an analysis of NHANES 1999–2006. Atherosclerosis. 2012;220:575–580. [DOI] [PMC free article] [PubMed] [Google Scholar]
- 21. dos Reis CM, de Melo NR, Meirelles ES, Vezozzo DP, Halpern A. Body composition, visceral fat distribution and fat oxidation in postmenopausal women using oral or transdermal oestrogen. Maturitas. 2003;46:59–68. [DOI] [PubMed] [Google Scholar]
- 22. Lobo RA. Metabolic syndrome after menopause and the role of hormones. Maturitas. 2008;60:10–18. [DOI] [PubMed] [Google Scholar]
- 23. O'Sullivan AJ, Crampton LJ, Freund J, Ho KK. The route of estrogen replacement therapy confers divergent effects on substrate oxidation and body composition in postmenopausal women. J Clin Invest. 1998;102:1035–1040. [DOI] [PMC free article] [PubMed] [Google Scholar]
- 24. Tsai SA, Stefanick ML, Stafford RS. Trends in menopausal hormone therapy use of US office‐based physicians, 2000–2009. Menopause. 2011;18:385–392. [DOI] [PMC free article] [PubMed] [Google Scholar]
- 25. Hodson L, Banerjee R, Rial B, Arlt W, Adiels M, Boren J, Marinou K, Fisher C, Mostad IL, Stratton IM, Barrett PH, Chan DC, Watts GF, Harnden K, Karpe F, Fielding BA. Menopausal status and abdominal obesity are significant determinants of hepatic lipid metabolism in women. J Am Heart Assoc. 2015;4:e002258 doi: 10.1161/JAHA.115.002258. [DOI] [PMC free article] [PubMed] [Google Scholar]
- 26. Guthrie JR, Dennerstein L, Taffe JR, Lehert P, Burger HG. The menopausal transition: a 9‐year prospective population‐based study. The Melbourne Women's Midlife Health Project. Climacteric. 2004;7:375–389. [DOI] [PubMed] [Google Scholar]
- 27. Tepper PG, Randolph JF, McConnell DS, Crawford SL, El Khoudary SR, Joffe H, Gold EB, Zheng H, Bromberger JT, Sutton‐Tyrrell K. Trajectory clustering of estradiol and follicle‐stimulating hormone during the menopausal transition among women in the Study of Women's Health Across the Nation (SWAN). J Clin Endocrinol Metab. 2012;97:2872–2880. [DOI] [PMC free article] [PubMed] [Google Scholar]
- 28. Lee CG, Carr MC, Murdoch SJ, Mitchell E, Woods NF, Wener MH, Chandler WL, Boyko EJ, Brunzell JD. Adipokines, inflammation, and visceral adiposity across the menopausal transition: a prospective study. J Clin Endocrinol Metab. 2009;94:1104–1110. [DOI] [PMC free article] [PubMed] [Google Scholar]
- 29. Van Sinderen ML, Steinberg GR, Jørgensen SB, Honeyman J, Chow JD, Herridge KA, Winship AL, Dimitriadis E, Jones ME, Simpson ER, Boon WC. Effects of estrogens on adipokines and glucose homeostasis in female aromatase knockout mice. PLoS One. 2015;10:e0136143. [DOI] [PMC free article] [PubMed] [Google Scholar]
- 30. Sowers M, Zheng H, Tomey K, Karvonen‐Gutierrez C, Jannausch M, Li X, Yosef M, Symons J. Changes in body composition in women over six years at midlife: ovarian and chronological aging. J Clin Endocrinol Metab. 2007;92:895–901. [DOI] [PMC free article] [PubMed] [Google Scholar]
Associated Data
This section collects any data citations, data availability statements, or supplementary materials included in this article.
Supplementary Materials
Table S1. Descriptive Characteristics of Women Who Did Not Transition (Premenopausal Throughout the Study, or Postmenopausal at Baseline)
Table S2. Mixed‐Model Parameter Estimates: MetS Z‐Score Over Time (Postmenopausal Women Only)
Table S3. Mixed‐Model Parameter Estimates: MetS Z‐Score Over Time (Premenopausal Women Only [n=240])
Figure S1. Consort diagram of analytic data set. CHD indicates coronary heart disease.