

Abstract
Background
Contrast‐induced acute kidney injury (CI‐AKI) is typically defined by an increase in serum creatinine after intravascular administration of contrast medium. Because creatinine is an unreliable indicator of acute changes in kidney function, we assessed whether circulating microRNAs (miRNAs) could serve as biomarkers for early detection of CI‐AKI.
Methods and Results
Using a rat model of CI‐AKI, we first evaluated the miRNA profile of rat plasma and kidney. Three miRNA species with >1.5‐fold increase in plasma samples of CI‐AKI rats, including miRNA‐188, miRNA‐30a, and miRNA‐30e, were selected as candidate miRNAs. Quantitative real‐time polymerase chain reaction showed that these candidate miRNAs peaked in concentration around 4 hours after contrast medium exposure and were relatively renal‐specific. We compared the plasma levels of these candidate miRNAs in 71 patients who underwent coronary angiography or percutaneous coronary intervention and developed CI‐AKI with those of 71 matched controls. The plasma levels of the 3 candidate miRNAs were significantly elevated in the CI‐AKI group as compared to the control group. Receiver operating characteristic analysis showed that these miRNAs significantly distinguished patients with CI‐AKI from those without CI‐AKI. MiRNA composites were highly accurate for CI‐AKI prediction, as shown in maximized specificity by treble‐positive miRNA composite or maximized Youden index by any‐positive miRNA composite. Moreover, the selected miRNAs changes were associated with Mehran Risk Scores.
Conclusions
Plasma levels of candidate miRNAs significantly distinguished patients with CI‐AKI from those without CI‐AKI. Thus, miRNAs are potential biomarkers for early detection of CI‐AKI.
Keywords: biomarker, contrast‐induced nephropathy, microRNA
Subject Categories: Biomarkers
Introduction
Contrast‐induced acute kidney injury (CI‐AKI) is an important complication associated with cardiac catheterization.1 CI‐AKI accounts for a significant number of hospital‐acquired renal failure cases.2 Patients who developed CI‐AKI have a significantly increased risk of late cardiovascular events compared with those without CI‐AKI.3 Early diagnosis is critical for patients because CI‐AKI causes time‐related injury to the kidney.4 CI‐AKI is now typically defined as an increase in serum creatinine (SCr), meeting one of several criteria, and occurring within 72 hours after intravascular administration of contrast medium (CM).5 However, creatinine is an unreliable index of CI‐AKI because it is an indirect and insensitive indicator during acute changes in kidney function.4 According to a recent meta‐analysis, cystatin C (CyC) is a better biomarker for accurate detection and staging of kidney disease, but CyC increased only after 12 hours of contrast exposure.6 Some novel biomarkers, such as neutrophil gelatinase‐associated lipocalin, outperformed CyC at earlier time points. However, these novel biomarkers are still not highly specific for AKI because they are easily influenced by a number of coexisting variables.7 Therefore, investigation of potential new, early biomarkers of CI‐AKI remains an area of utmost interest.
MicroRNAs (miRNAs) are a group of endogenous, single‐stranded, noncoding RNAs that regulate gene expression in a wide range of organisms and physiological processes.8 Tissue‐specific/enriched miRNAs may serve unique functional roles in the normal state and be altered in diseased states. Their expression patterns in plasma, urine, and other body fluids are tightly correlated with various diseases.9 Circulating miRNAs can be readily detected in plasma and serum in a remarkably stable form. The expression profiles of circulating miRNAs carry immense potential for their use as novel, noninvasive biomarkers in diagnosing and monitoring human diseases, such as cancer and tissue injury.10, 11
MiRNAs are also implicated in pathways linked to kidney diseases. Studies have found some miRNAs are upregulated in blood from patients with various kidney diseases.12 However, the role of circulating miRNAs in CI‐AKI has not been examined. We hypothesized that the renal‐specific miRNAs might be released into circulation during CI‐AKI and could be used to detect kidney injury. Based on the rat model of CI‐AKI we previously reported,13 here we explore the changes in miRNA expression in plasma and kidney during CI‐AKI. We identify miRNA‐188, ‐30a, and ‐30e as the most consistently upregulated miRNA during the early stage following CM exposure. These miRNAs are also specifically expressed in kidney tissue. Further investigation demonstrated that these elevated renal‐specific miRNAs in plasma could significantly distinguish patients with CI‐AKI from those without CI‐AKI. Therefore, our results suggest that circulating miRNAs could serve as potential biomarkers to detect CI‐AKI early in the disease process.
Materials and Methods
CI‐AKI Rat Model
CI‐AKI was induced by the method we previously reported. In brief, male Sprague‐Dawley rats (250–300 g) were deprived of water for 3 days and then given furosemide by intramuscular injection at a dose of 10 mg/kg. For the CI‐AKI group, a nonionic, low‐osmolar CM, Omnipaque (350 mg I/mL; GE Healthcare, Shanghai, China), at a dose of 10 mL/kg was subsequently administered via tail vein over the course of 5 minutes. For the control group, the same amount of normal saline (NS) was given. As reported, an increase in SCr ≥25% over baseline was observed in 83.3% (5/6) of the CI‐AKI rats. Histopathological analysis revealed that all CI‐AKI rats developed tubular necrosis and medullary congestion, indicating that this method efficiently leads to AKI in the rats.13 All animal experimental protocols complied with the guidelines on animal care of Shanghai Jiao Tong University.
Population
Consecutive patients who were scheduled for elective coronary angiography (CAG) or percutaneous coronary intervention (PCI) in our center from July 2013 to June 2014 were included in this study. Exclusion criteria were recent CM exposure (within 2 days), AKI from other causes, preexisting dialysis, cardiac shock, missing SCr or CyC values, pregnancy, or breastfeeding. Nonionic, low‐osmolality CM and intravenous hydration were used in all patients. The duration and volume of hydration was determined at the discretion of the physicians. N‐acetylcysteine was not routinely given. In this cohort, blood samples for miRNA analysis were prospectively collected at baseline and 4 to 6 hours post CM exposures. This time point was prespecified according to the time curve of selected circulating miRNAs in 9 patients receiving primary PCI (see Table S1). SCr and CyC were measured at the time of admission and 24 to 48 hours after the procedure. CI‐AKI was defined by an absolute increase in SCr ≥0.3 mg/dL or relative increase in SCr ≥25% or CyC ≥10% over baseline.1, 14 Estimated glomerular filtration rate (eGFR) was calculated by applying the Modification of Diet in Renal Disease formula as modified by Levey.15 The Mehran Risk Score was calculated as follows: hypotension (score of 0 for absent or 5 for present), intra‐aortic balloon pump (score of 0 for absent or 5 for present), congestive heart failure (score of 0 for absent or 5 for present), age >75 years (if yes, score of 4), diabetes mellitus (score of 0 for absent or 3 for present), eGFR <60 mL/min per 1.73 m2 (integer score between 2 and 6 depending on eGFR), preexisting anemia (score of 0 for absent or 3 for present), and CM volume (integer score of 1 for each 100 mL).16 The study protocol complied with the ethical guidelines of the 1975 Declaration of Helsinki and was approved by the Medical Ethics Committee in Shanghai Ren Ji Hospital. Informed consent was obtained from all the participants before enrollment.
Plasma Collection and Storage
Peripheral blood (5 mL) was collected into ethylenediaminetetraacetic acid–containing tubes (BD Vacutainer, Franklin Lakes, NJ) and processed within 1 hour at room temperature. The plasma was collected by centrifugation at 820g at 4°C for 10 minutes, transferred into fresh RNase/DNase‐free tubes, and centrifuged at 16 000g at 4°C for 10 minutes. The supernatant was transferred to new tubes and stored at −80°C.
RNA Isolation
Total RNA in rat tissue was harvested with TRIzol (Invitrogen, Carlsbad, CA). Total rat and human RNA in plasma was extracted with mirVana following the manufacturer's protocol (Applied Biosystems, Foster City, CA). Five microliters of synthetic Caenorhabditis elegans miRNA (cel‐miRNA‐39, 5 fmol/μL, synthesized by Invitrogen) was spiked‐in as the control after combining the plasma sample with the denaturing solution. RNA was eluted with 100 μL of RNase‐free water and stored at −80°C until further processing. RNA concentration was determined by NanoDrop 1000 Spectrophotometer (NanoDrop Technologies, Waltham, MA).
miRNA Array and Data Analysis
The miRNA profile in rat plasma and kidney was assessed by miRNA microarray analysis using the rat miRNA arrays (Agilent microRNAs microarray v.10.1; Agilent Technologies, Santa Clara, CA) that contains probes for 350 rat miRNAs (Sanger miRbase, release 10.1). The miRNA molecular in total RNA was labeled by miRNA Complete Labeling and Hyb Kit according to the manufacturer's protocol (Agilent Technologies). Each array slide was hybridized with 100 ng Cy3‐labeled RNA using miRNA Complete Labeling and Hyb Kit (Agilent Technologies). After hybridization, slides were washed using the Gene Expression Wash Buffer Kit (Agilent Technologies). Slides were scanned by Agilent Microarray Scanner (Agilent Technologies) and Feature Extraction software 9.5.3 (Agilent Technologies) with default settings. Raw data were normalized by a quantile algorithm using Gene Spring Software 10.0 (Agilent Technologies).
Reverse Transcription Quantitative Real‐Time Polymerase Chain Reaction (RT‐qPCR) Analysis
Selected miRNAs were quantified with TaqMan RT‐qPCR according to the manufacturer's protocol (Applied BioSystems). Each reaction was primed using a gene‐specific stem‐loop primer (Applied BioSystems). The qPCR reactions were carried out by LightCycler® 480 Real‐Time PCR System (Roche Applied Science, Penzberg, Germany). Raw data were analyzed with the automatic quantification cycle setting for assigning baseline and quantification for quantification cycle determination. Relative expression of the mature miRNAs was normalized to the internal control small nuclear U6 expression (in tissue) or cel‐miRNA‐39 (in plasma) and calculated by the 2−ΔΔCT method.17, 18 All experiments were performed in triplicate.
Statistical Analysis
Continuous variables are represented as the mean±SE or median (with 25th and 75th percentiles). The Student t test or analysis of variance was used to determine the differences between mean values for normally distributed variables. The nonparametric Mann–Whitney U test or the Kruskal–Wallis test was used to determine the differences between median values for non‐normally distributed variables. Pearson correlation analysis and Spearman correlation analysis were performed for normally and non‐normally distributed variables, respectively. Categorical variables were reported as percentages and were analyzed by either χ2 test or Fisher's exact test, as appropriate. The Bootstrap method with 10 000 bootstrap resamples was used to estimate the mean difference and 95% CI of miRNA levels between 2 groups.19 Logistic regression was used to analyze the association between fold change of miRNAs and CI‐AKI adjusting for age and eGFR in continuous forms. Receiver operating characteristic curves were used to establish cutoff increment values for miRNAs in CI‐AKI prediction. All P‐values are 2‐sided, and a P‐value less than 0.05 was considered statistically significant. All statistical analysis was performed using SPSS 16.0 and R 3.3.0 software.
Results
miRNA Expression Profile in Plasma and Kidney of CI‐AKI Rat Model
As shown in Figure 1A, 24 rats were randomly divided into 2 groups (a CI‐AKI group and a control group). In each group, 12 rats were further divided into 4 subgroups, namely, CI‐AKI subgroups 1 to 4 and control subgroups 1 to 4 (n=3 for each subgroup). Peripheral blood and kidney samples were harvested at 8 hours after CM/NS administration. The plasma or renal RNA samples extracted from rats in same subgroup were pooled and then measured with a single microarray.20 The Agilent microarray platform was adapted to profile the miRNA spectra. Principal component analysis was performed to test the consistency of hybridization results of each microarray. Principal component analysis revealed that the hybridization results of 2 pooled plasma samples (1 from the CI‐AKI subgroup and 1 from the control subgroup) significantly deviated from the results of the other plasma samples; data from these 2 arrays were excluded from further analysis (Figure 1A). The correlation coefficient of hybridization results among the remaining 6 pooled plasma samples ranged from 0.89 to 0.98 and from 0.95 to 0.99 among the 8 pooled kidney samples. The complete data set of miRNA microarray results can be accessed through Gene Expression Omnibus (Series accession number GSE81400).
Figure 1.
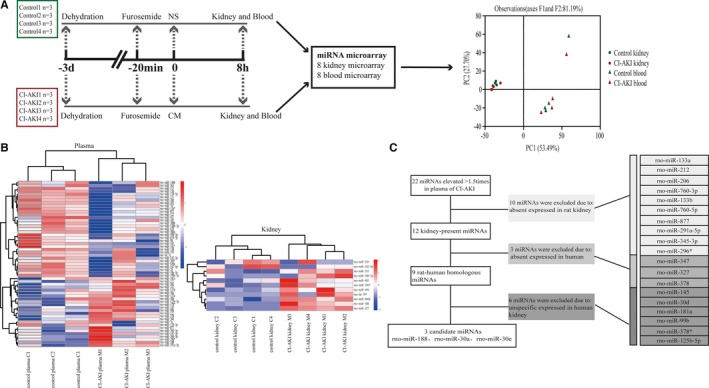
Selection of candidate circulating miRNAs as early biomarkers for CI‐AKI in rats. A, Global miRNA expression profiles of kidney and plasma in CI‐AKI and control rats by miRNA microarrays. Principal component analysis (PCA) revealed that the hybridization results of 2 plasma samples (1 from the CI‐AKI group and 1 from the control group) were significantly different from the other plasma samples. These 2 components explained 81.19% of the variability. B, Hierarchical clustering analysis of dysregulated miRNAs (with a fold change >1.5) in plasma and kidney samples. The relative miRNA expression is depicted according to the color scale shown on the right. Red indicates upregulation and blue, downregulation. C, Diagram of the strategy for identifying candidate miRNAs. See Results for details. CI‐AKI indicates contrast‐induced acute kidney injury; CM, contrast medium; miRNA, microRNA; NS, normal saline; PCA, principal component analysis.
miRNA Spectra in Plasma Sample
One hundred eighty‐two miRNAs were detected in the plasma samples. A greater than 1.5‐fold change on microarray hybridization intensity was observed in 57 miRNA species (Figure 1B, Table 1). Twenty‐two of these species were upregulated in the CI‐AKI rats. The miRNA with the greatest increase was miRNA‐347, with a 2.8‐fold increase.
Table 1.
List of Dysregulated miRNAs in the CI‐AKI Rats (Fold Change CI‐AKI/Control Array Hyb Intensity >1.50)
| Kidney (8 Hours After CM Exposure) | Plasma (8 Hours After CM Exposure) | ||
|---|---|---|---|
| Upregulated miRNAs | Fold Change | Upregulated miRNAs | Fold Change |
| rno‐miR‐327a | 14.31 | rno‐miR‐347 | 2.80 |
| rno‐miR‐188a | 3.33 | rno‐miR‐327a | 2.61 |
| rno‐let‐7b* | 2.11 | rno‐miR‐133a | 2.56 |
| rno‐miR‐466b | 2.01 | rno‐miR‐145 | 2.44 |
| rno‐miR‐335 | 2.07 | rno‐miR‐212 | 2.23 |
| rno‐miR‐30b‐3p | 1.82 | rno‐miR‐206 | 2.00 |
| rno‐miR‐330* | 1.74 | rno‐miR‐760‐3p | 1.93 |
| rno‐miR‐483 | 1.72 | rno‐miR‐188a | 1.92 |
| rno‐miR‐494 | 1.51 | rno‐miR‐133b | 1.83 |
| rno‐miR‐30a | 1.71 | ||
| rno‐miR‐760‐5p | 1.70 | ||
| rno‐miR‐877 | 1.69 | ||
| rno‐miR‐291a‐5p | 1.69 | ||
| rno‐miR‐30d | 1.65 | ||
| rno‐miR‐181a | 1.63 | ||
| rno‐miR‐30e | 1.61 | ||
| rno‐miR‐345‐3p | 1.59 | ||
| rno‐miR‐296* | 1.58 | ||
| rno‐miR‐99b | 1.57 | ||
| rno‐miR‐378 | 1.56 | ||
| rno‐miR‐378* | 1.55 | ||
| rno‐miR‐125b‐5p | 1.51 | ||
| Downregulated miRNAs | Fold Change | Downregulated miRNAs | Fold Change |
| rno‐miR‐342‐5p | 1.63 | rno‐miR‐7a* | 2.83 |
| rno‐miR‐205 | 1.54 | rno‐miR‐34c* | 2.79 |
| rno‐miR‐542‐5p | 2.78 | ||
| rno‐miR‐215 | 2.63 | ||
| rno‐miR‐322 | 2.63 | ||
| rno‐miR‐203 | 2.61 | ||
| rno‐miR‐598‐5p | 2.54 | ||
| rno‐miR‐200a | 2.42 | ||
| rno‐miR‐98 | 2.30 | ||
| rno‐miR‐429 | 2.26 | ||
| rno‐miR‐28 | 2.21 | ||
| rno‐miR‐183 | 2.04 | ||
| rno‐miR‐450a | 2.01 | ||
| rno‐miR‐151 | 1.98 | ||
| rno‐miR‐15b | 1.95 | ||
| rno‐miR‐10a‐3p | 1.83 | ||
| rno‐let‐7e | 1.81 | ||
| rno‐miR‐126* | 1.81 | ||
| rno‐miR‐7a | 1.75 | ||
| rno‐miR‐148b‐3p | 1.73 | ||
| rno‐miR‐872 | 1.72 | ||
| rno‐miR‐26b | 1.71 | ||
| rno‐miR‐542‐3p | 1.70 | ||
| rno‐miR‐451 | 1.66 | ||
| rno‐miR‐199a‐3p | 1.63 | ||
| rno‐miR‐146b | 1.61 | ||
| rno‐miR‐195 | 1.60 | ||
| rno‐miR‐204* | 1.60 | ||
| rno‐miR‐674‐3p | 1.60 | ||
| rno‐miR‐200b | 1.59 | ||
| rno‐miR‐138 | 1.58 | ||
| rno‐miR‐139‐5p | 1.56 | ||
| rno‐miR‐363 | 1.55 | ||
| rno‐miR‐139‐3p | 1.55 | ||
| rno‐miR‐185 | 1.55 | ||
CI‐AKI indicates contrast‐induced acute kidney injury; CM, contrast medium; Hyb, hybridization.
An asterisk following the name indicates a miRNA expressed at low levels relative to the miRNA originating from opposite arm of the same pre‐miRNA hairpin.
The miRNA species common in kidney and plasma.
miRNA Spectra in Kidney Tissues
One hundred sixty‐six and 173 miRNAs were detected in the control and CI‐AKI kidney samples, respectively. A greater than 1.5‐fold change on microarray hybridization intensity was observed in 11 miRNA species (Figure 1B, Table 1). Nine of them were upregulated in the CI‐AKI rats. The 2 miRNAs with the greatest increases were miRNA‐327, with a 14.3‐fold increase, and miRNA‐188, with a 3.3‐fold increase.
Selection of Candidate Circulating miRNAs as Potential Biomarkers for CI‐AKI
Candidate circulating miRNA was defined as human–rat homologous, kidney‐specific miRNA with more than 1.5‐fold upregulation in plasma of CI‐AKI rats and expression in kidney samples. A relatively kidney‐specific miRNA was defined as any miRNA with a 2‐fold higher expression level in the kidneys than in the other 5 main organs (heart, liver, spleen, lung, and brain).21 According to this definition, firstly, 22 miRNAs from plasma with more than 1.5‐fold upregulation in CI‐AKI rats were included. After that, 10 miRNAs without expression in kidney samples were subsequently excluded. Then, 3 miRNAs, including miRNA‐347 with the greatest increase in plasma of CI‐AKI rats and miRNA‐327 with the greatest increase in kidneys of CI‐AKI rats, were excluded because they were not expressed in humans. The expression levels of the remaining 9 human–rat homologous miRNAs in 6 human main organs were acquired from a previously reported database of human miRNAs expression profiles.21 Ultimately, 3 kidney‐specific miRNAs were identified. A flow chart of candidate miRNAs selection is depicted in Figure 1C.
Evaluation of Circulating miRNAs as New Biomarkers for CI‐AKI in Rats
To confirm the tissue expression patterns of the 3 selected miRNAs, RT‐qPCR analysis of miRNA expression in the 6 main organs from rats was performed. As shown in Figure 2A, all 3 miRNAs exhibited high expressed levels in kidneys and lower or barely detectable level in the remaining 5 organs. The 3 miRNAs also displayed a similar expression pattern in rats as reported in humans. To validate the hybridization results by microarray, RT‐qPCR analysis of the 3 selected miRNAs in plasma was performed. The results of RT‐qPCR were consistent with those of microarray analyses (Figure 2B).
Figure 2.
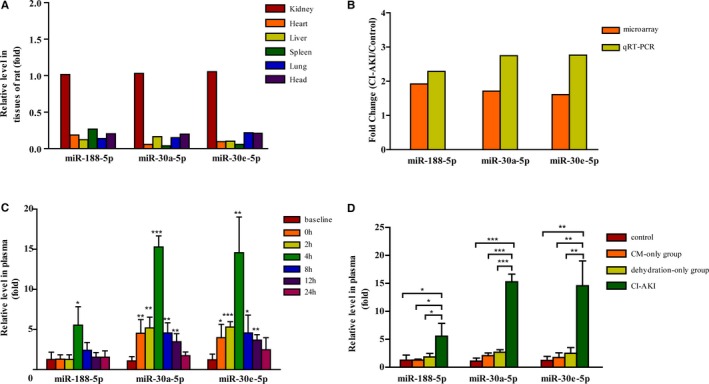
Validation of candidate circulating miRNAs in rats. A, Tissue expression patterns of miRNAs in rats. The levels of candidate miRNAs in various tissues from rats by reverse transcription quantitative real‐time PCR (RT‐qPCR). B, Validating data of miRNA microarray by RT‐qPCR method. C, Time course of the plasma levels of candidate miRNAs from CI‐AKI rats. The plasma was collected from the rats at different time points (n=4 for each time point). Levels of miRNAs at each time point were expressed as fold increase relative to the baseline. D, The plasma was collected from control rats (without pretreatment and CM exposure), CM‐only group (CM exposure without pretreatment), dehydration‐only group (dehydration pretreatment without CM exposure), and CI‐AKI group at 4 hours after CM exposure or equal time point (n=4, each group). The relative change of miRNA levels is expressed as fold increase compared with the control.*P<0.05, **P<0.01, and ***P<0.001. CI‐AKI indicates contrast‐induced acute kidney injury; CM, contrast medium; miRNA, microRNA; RT‐qPCR, reverse transcription quantitative real‐time polymerase chain reaction.
To further investigate the time curve of selected circulating miRNAs in CI‐AKI rats, blood samples were collected at various time points (baseline, 0, 2, 4, 8, 12, and 24 hours post CM administration, n=4 of each time point). RT‐qPCR analysis showed that the levels of miRNA‐188 did not significantly increase after dehydration, peaked around 4 hours, reached about a 5‐fold increase at peak, and decreased at 24 hours post CM exposure (Figure 2C). The levels of miRNA‐30a and miRNA‐30e in plasma increased after dehydration, peaked around 4 hours, reached about a 15‐fold increase, and decreased at 24 hours post CM exposure (Figure 2C).
To further confirm that the increase in plasma miRNA‐188, miRNA‐30a, and miRNA‐30e levels was in response to CI‐AKI, but not in the context of CM administration or dehydration, another 16 rats were randomly divided into 4 groups (n=4, each group): CI‐AKI group, dehydration‐only (without CM administration) group, CM‐exposure‐only (without dehydration) group, and control group. Blood samples were drawn at 4 hours post CM exposure. As shown in Figure 2D, compared with the levels in the control group, the levels of the 3 selected circulating miRNAs modestly increased in the dehydration‐only group and the CM‐exposure‐only group, but the extent of the increases in those 2 groups was significantly lower than the increase in the CI‐AKI group. This indicated that the increased levels of the 3 selected circulating miRNAs were mainly associated with kidney injury but not dehydration or CM exposure.
Circulating miRNAs as New Early Biomarkers to Detect CI‐AKI in Patients Receiving CAG/PCI
From July 2013 to June 2014, 580 consecutive patients receiving elective CAG/PCI in our center fulfilled inclusion and exclusion criteria. The incidence of CI‐AKI following CAG/PCI was 23.28% based on our prespecified definition. Of the 135 patients who developed CI‐AKI, plasma samples were available in 71 cases. Clinical characteristics of the remaining CI‐AKI patients were similar to these 71 cases (Table S2). We performed a case–control study using these 71 cases. Controls were matched by age (<50, 50–70, >70 years), presence of diabetes mellitus (Yes, No), and chronic kidney disease stage (Stage 1: eGFR >90 mL/min per 1.73 m2, Stage 2: eGFR 60–89 mL/min per 1.73 m2, Stage 3: eGFR 30–59 mL/min per 1.73 m2, Stage 4: eGFR 15–29 mL/min per 1.73 m2, Stage 5: eGFR <15 mL/min per 1.73 m2) and were randomly selected from patients who did not develop CI‐AKI. A 1:1 ratio of controls to cases was used.
After inclusion of the case controls, the study consisted of 71 CI‐AKI cases and 71 controls. Baseline characteristics of these 2 groups of patients are displayed in Table 2. None of these patients required temporary dialysis during hospitalization as a result of AKI. The plasma level of the 3 candidate miRNAs before and post CM exposure were screened by using RT‐qPCR. The baseline plasma levels of the 3 candidate miRNAs were low (the average quantification cycle value: miRNA‐188 33.68; miRNA‐30a 29.05; miRNA‐30e 28.64) and without significant difference across subgroups, including baseline stages of chronic kidney disease (Table S3). The plasma levels of the 3 candidate miRNAs were significantly elevated at 4 to 6 hours postprocedure from baseline in patients with CI‐AKI as compared with the control group (mean difference in fold change of miRNAs: miRNA‐188, 1.594 [1.087–2.158], P<0.001; miRNA‐30a, 2.579 [1.756–3.508], P<0.001; miRNA‐30e, 2.283 [1.612–3.038], P<0.001; Figure 3A). The changes in these miRNAs levels in the subgroups categorized by the different CI‐AKI diagnostic criteria (SCr or CyC) are presented in Table S4. Logistic regression adjusting for age and eGFR showed significant association of the changes in these miRNAs levels with CI‐AKI (Table S5). Correlation analysis indicated that the increases in the 3 candidate miRNAs plasma levels postprocedure were related to the change of SCr or CyC (Figure S1A).
Table 2.
Clinical Characteristics of CI‐AKI Cases and Matched Controls
| CI‐AKI (n=71) | Matched Controls (n=71) | P‐Value | |
|---|---|---|---|
| Age, y | 60.82±1.27 | 61.28±1.25 | 0.795 |
| Male, n (%) | 45 (63.38) | 37 (52.11) | 0.174 |
| Current smoker, n (%) | 23 (32.39) | 18 (25.35) | 0.355 |
| HBP, n (%) | 44 (61.97) | 47 (66.20) | 0.599 |
| DM, n (%) | 21 (29.58) | 21 (29.58) | 1 |
| Hyperlipidemia, n (%) | 25 (35.21) | 25 (35.21) | 1 |
| Prior MI, n (%) | 12 (16.90) | 10 (14.08) | 0.643 |
| Prior PCI, n (%) | 20 (28.17) | 16 (22.54) | 0.440 |
| Systolic pressure, mm Hg | 130.24±2.26 | 126.47±1.97 | 0.955 |
| Diastolic pressure, mm Hg | 77.20±1.15 | 78.14±1.20 | 0.572 |
| ACS, n (%) | 28 (39.44) | 17 (23.94) | 0.047 |
| ACEI, n (%) | 37 (52.11) | 35 (49.30) | 0.737 |
| Statin, n (%) | 64 (90.14) | 57 (80.28) | 0.098 |
| CM volume, mL | 100.99±7.16 | 78.17±5.04 | 0.01 |
| CKD stage | |||
| 1, n (%) | 56 (78.87) | 56 (78.87) | 1 |
| 2, n (%) | 13 (18.31) | 13 (18.31) | 1 |
| 3, n (%) | 2 (2.82) | 2 (2.82) | 1 |
| Mehran Score | 3.90±0.37 | 3.13±0.29 | 0.109 |
| <6, n (%) | 55 (77.46) | 60 (84.51) | 0.271 |
| 6 to 10, n (%) | 14 (19.72) | 11 (15.49) | 0.494 |
| 11 to 16, n (%) | 1 (1.41) | 0 | |
| >16, n (%) | 1 (1.41) | 0 | |
| Baseline SCr, mg/dL | 0.72±0.02 | 0.74±0.02 | 0.656 |
| Baseline CyC, mg/L | 0.89±0.05 | 1.00±0.04 | 0.096 |
| Baseline eGFR, mL/min per 1.73 m2 | 113.72±3.80 | 106.01±2.80 | 0.105 |
ACEI indicates angiotensin‐converting‐enzyme inhibitor; ACS, acute coronary syndrome; CI‐AKI, contrast‐induced acute kidney injury; CKD, chronic kidney disease; CM, contrast medium; CyC, cystatin C; DM, diabetes mellitus; eGFR, estimated glomerular filtration rate; HBP, high blood pressure; MI, myocardial infarction; PCI, percutaneous coronary intervention; SCr, serum creatinine.
Figure 3.
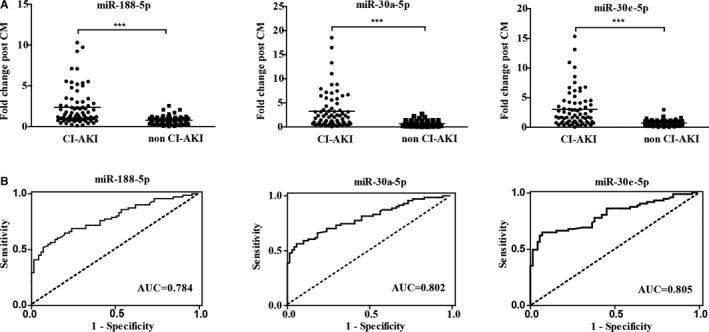
Evaluation of candidate circulating miRNAs in CI‐AKI patients. A, The plasma levels of the three candidate miRNAs in 71 CI‐AKI patients and 71 matched controls without CI‐AKI by RT‐qPCR. Blood samples were obtained at baseline and 4 to 6 hours post CM exposure. Individual value plots represent the relative change of miRNA levels compared with baseline in each CI‐AKI patient (left) and non‐CI‐AKI patient (right). A crossbar on each plot indicates the mean expression level for each group. ***P<0.001. B, Discrimination potential of candidate circulating miRNAs. Receiver operating characteristics (ROC) curves were drawn with the data of fold change of plasma microRNAs from 71 CI‐AKI patients and 71 matched controls. The dashed line indicates “random guess” diagonal line. AUC indicates area under the curve; CI‐AKI, contrast‐induced acute kidney injury; CM, contrast medium; miRNA, microRNA; RT‐qPCR, reverse transcription quantitative real‐time polymerase chain reaction.
Discrimination Potential of Circulating miRNAs for CI‐AKI
Receiver operating characteristics analysis was performed to determine the sensitivity and specificity of the 3 miRNAs for CI‐AKI prediction. As shown in Figure 3B, the levels of the 3 miRNAs significantly identified patients with CI‐AKI from those without CI‐AKI (miRNA‐188, area under curve 0.784 [0.709–0.858]; miRNA‐30a, area under curve 0.802 [0.730–0.874]; miRNA‐30e area under curve 0.805 [0.733–0.878]). The cutoff increment values of miRNAs for CI‐AKI prediction are presented in Table 3. To obtain the best diagnostic sensitivity and specificity, cutoff point I was used for further analysis. Comparison of these miRNAs in CI‐AKI prediction is presented in Table S6.
Table 3.
Discrimination Potential and Cutoff Increment Values of miRNAs for CI‐AKI Prediction
| miRNAs | AUC | Cutoff Point I a | Cutoff Point IIb | ||||||
|---|---|---|---|---|---|---|---|---|---|
| Fold‐Change | Sensitivity% | Specificity% | Youden Index | Fold‐Change | Sensitivity% | Specificity% | Youden Index | ||
| miR‐188‐5p | 0.784 (0.709–0.858) | 1.343 | 52.11 | 92.96 | 0.44 | 2.540 | 29.58 | 100 | 0.29 |
| miR‐30a‐5p | 0.802 (0.730–0.874) | 1.405 | 56.34 | 94.37 | 0.50 | 2.757 | 38.03 | 100 | 0.37 |
| miR‐30e‐5p | 0.805 (0.733–0.878) | 1.428 | 64.79 | 92.96 | 0.57 | 3.005 | 35.21 | 100 | 0.34 |
| Any‐positivec | 71.83 | 88.73 | 0.60 | ||||||
| Treble‐positived | 40.85 | 97.18 | 0.37 | ||||||
AUC indicates area under the curve; CI‐AKI, contrast‐induced acute kidney injury; miRNA, microRNA.
Cutoff point I: the best diagnostic sensitivity and specificity by receiver operating characteristic curves.
Cutoff point II: established under 100% specificity.
The fold‐change of any 1 of the 3 miRNAs above cutoff point I.
The fold‐change of all 3 miRNAs above cutoff point I.
Use of miRNA Composites for CI‐AKI Prediction
Treble‐positive miRNA composite (fold change: miRNA‐188 >1.343, miRNA‐30a >1.405, miRNA‐30e >1.428) yielded a maximized specificity, up to 97.18%. Any positive miRNA composite (fold change of any miRNA above the cutoff point) yielded a maximized Youden index, up to 0.60. Use of miRNA composites had a high accuracy for CI‐AKI prediction.
Association of Circulating miRNAs With Mehran Risk Score
The Mehran Risk Score was capable of predicting CI‐AKI occurrence and prognosis. Correlation analysis revealed that the change of candidate miRNAs postprocedure was significantly related with the Mehran Risk Score (P<0.05, Figure S1B). The mean Mehran Risk Score and the proportion of patients with a score ≥6 were higher in the group with elevated miRNAs postprocedure indicating CI‐AKI (CI‐AKImiRNA group) compared with the group that did not have significantly elevated miRNA levels (non‐CKI‐AKImiRNA group); however, no significant difference in Mehran Risk Scores between the CI‐AKI group defined by SCr/CyC (CI‐AKISCr/CyC) and non‐CI‐AKISCr/CyC group was found (Figure 4A). Comparing with CI‐AKISCr/CyC (+)/CI‐AKImiRNA (−) patients, patients with CI‐AKImiRNA (+)/CI‐AKISCr/CyC (−) had higher Mehran Risk Scores and a higher proportion of patients with Mehran Risk Scores ≥6 (Figure 4B). These results indicated that the 3 candidate miRNAs might be more capable of detecting patients at real danger of CI‐AKI than the traditional biomarkers.
Figure 4.
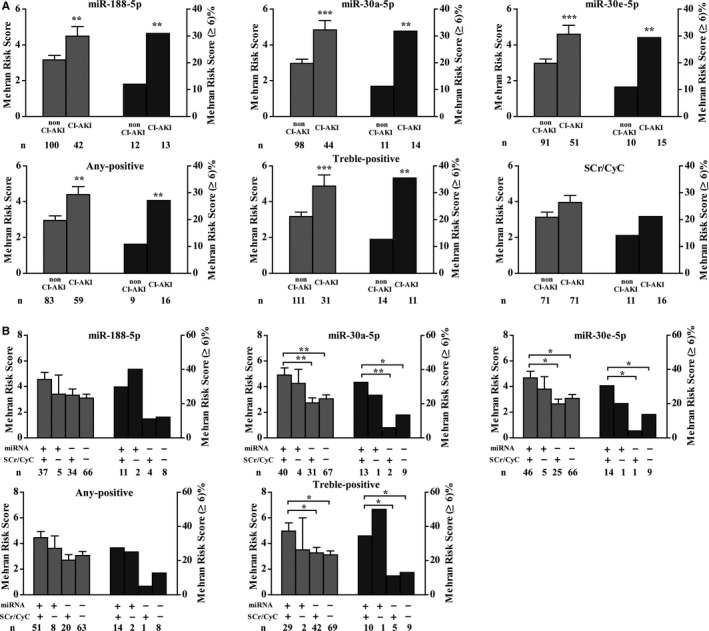
Candidate circulating miRNAs were associated with Mehran Risk Scores. A, Comparison of mean Mehran Risk Scores and incidence of Mehran Risk Score ≥6 between CI‐AKI and non‐CI‐AKI patients by different CI‐AKI criteria. B, Mean Mehran Risk Score and incidence of Mehran Risk Score ≥6 in 4 categories of patients. +/+ indicates patients who met the CI‐AKI criteria based both on miRNA and CyC/SCr; +/− indicates patients who met the CI‐AKI criteria based on miRNA but not CyC/SCr; −/+ indicates patients who met the CI‐AKI criteria based on CyC/SCr but not miRNA; −/− indicates patients who did not meet the CI‐AKI criteria based both on miRNA and CyC/SCr. Any‐positive, the fold‐change of any 1 of the 3 selected miRNAs reaching cutoff point I; treble‐positive, the fold‐change of all 3 selected miRNAs reaching cutoff point I. Error is represented as SEM. **P<0.01. ***P<0.001. CI‐AKI indicates contrast‐induced acute kidney injury; CyC/SCr, cystatin C/serum creatinine; miRNA, microRNA.
Discussion
Circulating miRNAs carry immense potential as novel, minimally invasive biomarkers in diagnosing human disease.11 In this study, we demonstrated that miRNAs circulating in plasma may be new biomarkers for CI‐AKI.
Using a rat model of AKI following nonionic low‐osmolar CM infusion, we observed the miRNA expression profiles in plasma and kidneys. Analysis of the microarray hybridization intensity showed 22 miRNA species and 9 miRNA species increased more than 1.5‐fold in the plasma and kidneys of CI‐AKI rats, respectively. Three human–rat homologous miRNAs, including miRNA‐188, miRNA‐30a, and miRNA‐30e, were ultimately selected as candidate early biomarkers of CI‐AKI. The following RT‐qPCR examination demonstrated that the plasma levels of these miRNAs were significantly elevated at 4 hours post CM exposure following dehydration. Further investigation in patients undergoing elective CAG and/or PCI indicated that the baseline plasma levels of candidate miRNAs were low and without significant difference among patients. The 3 candidate miRNAs all significantly increased 4 to 6 hours post CM exposure when compared with patients without CI‐AKI. Receiver operating characteristics analysis revealed that selected miRNAs identified patients with CI‐AKI as opposed to those without CI‐AKI. MiRNA composites reached a high accuracy on CI‐AKI prediction, as shown in maximized specificity or Youden index. Moreover, circulating miRNA‐30a and miRNA‐30e levels were also validated as predictors in another CI‐AKI cohort study conducted by Gutierrez‐Escolano et al.22 Taken together, our study indicates that monitoring the circulating levels of miRNA‐188, miRNA‐30a, and miRNA‐30e could aid in early diagnosis of CI‐AKI and might have advantages over the traditional markers of CI‐AKI.
The selected miRNAs might be associated with the pathophysiology of CI‐AKI. These miRNAs are expressed in renal‐specific fashion, indicating that the plasma level of these miRNAs is mainly affected by kidney injury. Only a high dose of CM (3 g I/kg) exposure without dehydration insignificantly impacted the plasma level of these miRNAs, which confirmed that the significant changes in the miRNA plasma levels occurred in the context of kidney injury but not CM exposure. Increased levels of miRNA‐188 (up to 3.33‐fold increase) were observed in kidney samples from CI‐AKI rats. Bioinformatics analysis revealed that miRNA‐188 is a key modulator of the MAPK‐JNK/p38 pathway.23 The MAPK‐JNK/p38 pathway is the major mechanism of CM‐induced tubular renal cell injury,24 indicating that miRNA‐188 might play an important role in the pathophysiology of CI‐AKI. MiRNA‐30a and miRNA‐30e, members of the miRNA‐30 family, are functionally related to each other. They play important roles in renal development and maintaining renal function.25 However, the levels of miRNA‐30a and miRNA‐30e did not show significant change in kidney samples from CI‐AKI rats. Further studies are needed to test the levels of miRNA‐30a and miRNA‐30e in the outer medulla of kidney and not in the whole kidney, as was done in the current study, which might reveal a significant change in the levels of these 2 miRNAs when kidney injury occurs. Finally, the mechanism causing the change in the levels of the selected miRNAs, the pathophysiological relationship between these miRNAs, and their roles in CI‐AKI development remain unknown and require further investigation.
The selected miRNAs might detect CI‐AKI in patients at high risk. Current guidelines recommend monitoring SCr post CM exposure to detect CI‐AKI.5 Clinical studies also revealed that CyC is a reliable biomarker of CI‐AKI.14 However, both SCr and CyC are indirect markers of kidney function and unable to timely reflect the renal parenchymal damage during the acute phase of kidney injury.7 Much evidence demonstrates that the rise of SCr and CyC lags behind renal parenchyma injury, although the levels of SCr and CyC were not checked at 4 to 6 hours post CM exposures in the current study. In a previous study, no significant increase in either SCr or CyC at 5 hours after CAG/PCI compared to baseline was observed.26 Thus, a major finding in the present study was that changes in the levels of the selected miRNAs identified CI‐AKI (4–6 hours post CM exposure) earlier than SCr/CyC. Further analysis showed that the selected miRNAs but not SCr/CyC correlated well with the Mehran Risk Scores, a valid predictor for CI‐AKI occurrence and prognosis.16, 27 The Mehran Risk Score was higher in the patients who had significant changes in the selected miRNA levels but no significant changes in SCr/CyC than in the patients who had no significant changes in miRNAs but positive changes in SCr/CyC, indicating that these select miRNAs might help to identify patients at real danger of CI‐AKI and poor prognosis when compared with SCr/CyC.
Study Limitations
This study had several limitations. First, the peak values of these circulating miRNAs occurred at ≈4 hours and then dropped quickly. The narrow time‐window for miRNA detection might limit the clinical utility of using these miRNAs as biomarkers for disease monitoring. Second, periprocedure intravenous hydration is the only approach to minimize the occurrence of CI‐AKI. Absence of an increase in the levels of these miRNAs does not mean that the patient has no need for periprocedure hydration. Third, as significant kidney injury can exist with minimal change in kidney function, a sensitive definition of CI‐AKI using a composite of SCr and CyC was adopted in this study. A portion of patients with a slight change in SCr were placed into the CI‐AKI group. Potential bias might be introduced due to the biological averaging. Fourth, the proportion of patients with acute coronary syndrome and volume of CM given in the CI‐AKI group was higher than in the controls. Although having demonstrated that the increase of these miRNAs was not in the context of CM administration and the Mehran Risk Score, an algorithm integrating CM volume, well‐matched in these 2 groups, potential confounders might have still existed. Fifth, baseline hydration status is associated with development of CI‐AKI. However, parameters regarding the hydration status, such as left ventricular end‐diastolic pressure, were unavailable in this study as factors for propensity matching.28 Last but not least, this is a single‐center, small sample‐size study without prognosis information. Larger cohorts are needed to evaluate the diagnostic accuracy of the selected miRNAs in unselected patients receiving CAG/PCI and roles of these miRNAs in predicting prognosis.
Sources of Funding
This work was supported by grants from the National Natural Science Foundation of China (numbers 81330006, 91539106, 81370399, 81500266), grant from Shanghai Municipal Commission of Health and Family Planning (number 20144Y0112), and a grant from Shanghai Jiaotong University (number YG2014MS52).
Disclosures
None.
Supporting information
Table S1. Temporal Changes of Candidate miRNAs in Plasma From 9 Patients With Acute Myocardial Infarction Receiving Emergency PCI
Table S2. Clinical Characteristics of Enrolled CI‐AKI Cases and Remaining CI‐AKI Cases
Table S3. Plasma miRNA Levels at Baseline Detected by RT‐qPCR
Table S4. Relative Change in miRNA Levels Compared With Baseline in Subgroups Categorized by Different CI‐AKI Criteria
Table S5. Association of the Change of miRNA Levels and CI‐AKI by Logistic Regression Analysis
Table S6. Comparison Between the 3 Selected miRNAs in CI‐AKI Prediction (n=142)
Figure S1. A, Correlation analysis of fold change of candidate circulating miRNA levels from baseline with the relative increase in SCr and CyC. B, Correlation analysis of the fold change of candidate circulating miRNA levels with Mehran Risk Scores. r, Pearson correlation coefficient; P, relative computed P‐value.
(J Am Heart Assoc. 2016;5:e004138 doi: 10.1161/JAHA.116.004138)
References
- 1. McCullough PA. Contrast‐induced acute kidney injury. J Am Coll Cardiol. 2008;51:1419–1428. [DOI] [PubMed] [Google Scholar]
- 2. Nash K, Hafeez A, Hou S. Hospital‐acquired renal insufficiency. Am J Kidney Dis. 2002;39:930–936. [DOI] [PubMed] [Google Scholar]
- 3. Narula A, Mehran R, Weisz G, Dangas GD, Yu J, Genereux P, Nikolsky E, Brener SJ, Witzenbichler B, Guagliumi G, Clark AE, Fahy M, Xu K, Brodie BR, Stone GW. Contrast‐induced acute kidney injury after primary percutaneous coronary intervention: results from the HORIZONS‐AMI substudy. Eur Heart J. 2014;35:1533–1540. [DOI] [PubMed] [Google Scholar]
- 4. Lameire N, Van Biesen W, Vanholder R. Acute kidney injury. Lancet. 2008;372:1863–1865. [DOI] [PubMed] [Google Scholar]
- 5. Stacul F, van der Molen AJ, Reimer P, Webb JA, Thomsen HS, Morcos SK, Almen T, Aspelin P, Bellin MF, Clement O, Heinz‐Peer G. Contrast induced nephropathy: updated ESUR Contrast Media Safety Committee guidelines. Eur Radiol. 2011;21:2527–2541. [DOI] [PubMed] [Google Scholar]
- 6. Dharnidharka VR, Kwon C, Stevens G. Serum cystatin C is superior to serum creatinine as a marker of kidney function: a meta‐analysis. Am J Kidney Dis. 2002;40:221–226. [DOI] [PubMed] [Google Scholar]
- 7. Coca SG, Yalavarthy R, Concato J, Parikh CR. Biomarkers for the diagnosis and risk stratification of acute kidney injury: a systematic review. Kidney Int. 2008;73:1008–1016. [DOI] [PubMed] [Google Scholar]
- 8. Bartel DP. MicroRNAs: genomics, biogenesis, mechanism, and function. Cell. 2004;116:281–297. [DOI] [PubMed] [Google Scholar]
- 9. Croce CM, Calin GA. miRNAs, cancer, and stem cell division. Cell. 2005;122:6–7. [DOI] [PubMed] [Google Scholar]
- 10. Wang GK, Zhu JQ, Zhang JT, Li Q, Li Y, He J, Qin YW, Jing Q. Circulating microRNA: a novel potential biomarker for early diagnosis of acute myocardial infarction in humans. Eur Heart J. 2010;31:659–666. [DOI] [PubMed] [Google Scholar]
- 11. Zen K, Zhang CY. Circulating microRNAs: a novel class of biomarkers to diagnose and monitor human cancers. Med Res Rev. 2012;32:326–348. [DOI] [PubMed] [Google Scholar]
- 12. Bhatt K, Mi QS, Dong Z. microRNAs in kidneys: biogenesis, regulation, and pathophysiological roles. Am J Physiol Renal Physiol. 2011;300:F602–F610. [DOI] [PMC free article] [PubMed] [Google Scholar]
- 13. Sun S, Zhang T, Nie P, Hu L, Yu Y, Cui M, Cai Z, Shen L, He B. A novel rat model of contrast‐induced acute kidney injury. Int J Cardiol. 2014;172:e48–e50. [DOI] [PubMed] [Google Scholar]
- 14. Briguori C, Visconti G, Rivera NV, Focaccio A, Golia B, Giannone R, Castaldo D, De Micco F, Ricciardelli B, Colombo A. Cystatin C and contrast‐induced acute kidney injury. Circulation. 2010;121:2117–2122. [DOI] [PubMed] [Google Scholar]
- 15. Foundation NK . K/DOQI clinical practice guidelines for chronic kidney disease: evaluation, classification, and stratification. Am J Kidney Dis. 2002;39:S1–S266. [PubMed] [Google Scholar]
- 16. Mehran R, Aymong ED, Nikolsky E, Lasic Z, Iakovou I, Fahy M, Mintz GS, Lansky AJ, Moses JW, Stone GW, Leon MB, Dangas G. A simple risk score for prediction of contrast‐induced nephropathy after percutaneous coronary intervention: development and initial validation. J Am Coll Cardiol. 2004;44:1393–1399. [DOI] [PubMed] [Google Scholar]
- 17. Kroh EM, Parkin RK, Mitchell PS, Tewari M. Analysis of circulating microRNA biomarkers in plasma and serum using quantitative reverse transcription‐PCR (qRT‐PCR). Methods. 2010;50:298–301. [DOI] [PMC free article] [PubMed] [Google Scholar]
- 18. Schmittgen TD, Livak KJ. Analyzing real‐time PCR data by the comparative C(T) method. Nat Protoc. 2008;3:1101–1108. [DOI] [PubMed] [Google Scholar]
- 19. Efron B. The bootstrap and modern statistics. J Am Stat Assoc. 2000;95:1293–1296. [Google Scholar]
- 20. Zhang W, Carriquiry A, Nettleton D, Dekkers JC. Pooling mRNA in microarray experiments and its effect on power. Bioinformatics. 2007;23:1217–1224. [DOI] [PubMed] [Google Scholar]
- 21. Liang Y, Ridzon D, Wong L, Chen C. Characterization of microRNA expression profiles in normal human tissues. BMC Genomics. 2007;8:166. [DOI] [PMC free article] [PubMed] [Google Scholar]
- 22. Gutierrez‐Escolano A, Santacruz‐Vazquez E, Gomez‐Perez F. Dysregulated microRNAs involved in contrast‐induced acute kidney injury in rat and human. Ren Fail. 2015;37:1498–1506. [DOI] [PubMed] [Google Scholar]
- 23. Wu J, Lv Q, He J, Zhang H, Mei X, Cui K, Huang N, Xie W, Xu N, Zhang Y. MicroRNA‐188 suppresses G1/S transition by targeting multiple cyclin/CDK complexes. Cell Commun Signal. 2014;12:66. [DOI] [PMC free article] [PubMed] [Google Scholar]
- 24. Quintavalle C, Brenca M, De Micco F, Fiore D, Romano S, Romano MF, Apone F, Bianco A, Zabatta MA, Troncone G, Briguori C, Condorelli G. In vivo and in vitro assessment of pathways involved in contrast media‐induced renal cells apoptosis. Cell Death Dis. 2011;2:e155. [DOI] [PMC free article] [PubMed] [Google Scholar]
- 25. Agrawal R, Tran U, Wessely O. The miR‐30 miRNA family regulates Xenopus pronephros development and targets the transcription factor Xlim1/Lhx1. Development. 2009;136:3927–3936. [DOI] [PMC free article] [PubMed] [Google Scholar]
- 26. Rickli H, Benou K, Ammann P, Fehr T, Brunner‐La Rocca HP, Petridis H, Riesen W, Wuthrich RP. Time course of serial cystatin C levels in comparison with serum creatinine after application of radiocontrast media. Clin Nephrol. 2004;61:98–102. [DOI] [PubMed] [Google Scholar]
- 27. Wi J, Ko YG, Shin DH, Kim JS, Kim BK, Choi D, Ha JW, Hong MK, Jang Y. Prediction of contrast‐induced nephropathy with persistent renal dysfunction and adverse long‐term outcomes in patients with acute myocardial infarction using the Mehran Risk Score. Clin Cardiol. 2012;36:46–53. [DOI] [PMC free article] [PubMed] [Google Scholar]
- 28. Brar SS, Shen AY, Jorgensen MB, Kotlewski A, Aharonian VJ, Desai N, Ree M, Shah AI, Burchette RJ. Sodium bicarbonate vs sodium chloride for the prevention of contrast medium‐induced nephropathy in patients undergoing coronary angiography: a randomized trial. JAMA. 2008;300:1038–1046. [DOI] [PubMed] [Google Scholar]
Associated Data
This section collects any data citations, data availability statements, or supplementary materials included in this article.
Supplementary Materials
Table S1. Temporal Changes of Candidate miRNAs in Plasma From 9 Patients With Acute Myocardial Infarction Receiving Emergency PCI
Table S2. Clinical Characteristics of Enrolled CI‐AKI Cases and Remaining CI‐AKI Cases
Table S3. Plasma miRNA Levels at Baseline Detected by RT‐qPCR
Table S4. Relative Change in miRNA Levels Compared With Baseline in Subgroups Categorized by Different CI‐AKI Criteria
Table S5. Association of the Change of miRNA Levels and CI‐AKI by Logistic Regression Analysis
Table S6. Comparison Between the 3 Selected miRNAs in CI‐AKI Prediction (n=142)
Figure S1. A, Correlation analysis of fold change of candidate circulating miRNA levels from baseline with the relative increase in SCr and CyC. B, Correlation analysis of the fold change of candidate circulating miRNA levels with Mehran Risk Scores. r, Pearson correlation coefficient; P, relative computed P‐value.