

Abstract
Background
Intracranial aneurysms (IAs), abdominal aortic aneurysms (AAAs), and thoracic aortic aneurysms (TAAs) all have a familial predisposition. Given that aneurysm types are known to co‐occur, we hypothesized that there may be shared genetic risk factors for IAs, AAAs, and TAAs.
Methods and Results
We performed a mega‐analysis of 1000 Genomes Project‐imputed genome‐wide association study (GWAS) data of 4 previously published aneurysm cohorts: 2 IA cohorts (in total 1516 cases, 4305 controls), 1 AAA cohort (818 cases, 3004 controls), and 1 TAA cohort (760 cases, 2212 controls), and observed associations of 4 known IA, AAA, and/or TAA risk loci (9p21, 18q11, 15q21, and 2q33) with consistent effect directions in all 4 cohorts. We calculated polygenic scores based on IA‐, AAA‐, and TAA‐associated SNPs and tested these scores for association to case‐control status in the other aneurysm cohorts; this revealed no shared polygenic effects. Similarly, linkage disequilibrium–score regression analyses did not show significant correlations between any pair of aneurysm subtypes. Last, we evaluated the evidence for 14 previously published aneurysm risk single‐nucleotide polymorphisms through collaboration in extended aneurysm cohorts, with a total of 6548 cases and 16 843 controls (IA) and 4391 cases and 37 904 controls (AAA), and found nominally significant associations for IA risk locus 18q11 near RBBP8 to AAA (odds ratio [OR]=1.11; P=4.1×10⁻⁵) and for TAA risk locus 15q21 near FBN1 to AAA (OR=1.07; P=1.1×10⁻³).
Conclusions
Although there was no evidence for polygenic overlap between IAs, AAAs, and TAAs, we found nominally significant effects of two established risk loci for IAs and TAAs in AAAs. These two loci will require further replication.
Keywords: abdominal aortic aneurysm, genome wide association study, intracranial aneurysm, thoracic aortic aneurysm
Subject Categories: Inflammation, Vascular Biology, Ischemic Stroke
Introduction
Intracranial aneurysms (IAs), abdominal aortic aneurysms (AAAs), and thoracic aortic aneurysms (TAAs) are 3 different forms of arterial vessel wall dilatations, which can all lead to rupture with a high case fatality rate.1, 2, 3 A co‐occurrence of AAA and TAA is known,4, 5 and a weak co‐occurrence of IA and AAA has also been suggested.6, 7 Furthermore, IA, TAA, and AAA cluster within affected families,8, 9 suggesting a shared genetic background of these 3 diseases.
Genome‐wide association studies (GWASs) have revealed a handful of genetic risk factors for IA,10, 11, 12 AAA,13, 14, 15, 16 and TAA,17 and of these identified loci, locus 9p21 near CDKN2A, CDKN2B, and CDKN2BAS appears to be shared by IA and AAA.11, 18 However, the heritability explained by the risk loci identified to date is low for all 3 diseases, suggesting that many aneurysm risk loci remain to be discovered. Among these unknown and known risk loci, there could be shared risk loci for multiple types of aneurysms.
In this study, we searched for shared genetic risk factors for aneurysms. We combined individual participant GWAS data from a Dutch and a Finnish IA cohort,12 a Dutch AAA cohort,14 and a TAA cohort from the United States17 for a GWAS mega‐analysis across these traits. In a complementary approach, we performed a polygenic analysis to test groups of single‐nucleotide polymorphisms (SNPs) for a joint effect on risk across diseases. Finally, we tested the effect of bona‐fide risk SNPs from previously published IA, AAA, and TAA GWASs on the other aneurysm types by meta‐analyzing summary statistics in the GWAS cohorts of IA, AAA, and TAA, extended by association results of additional IA and AAA GWAS cohorts.
Methods
Study Populations
For the GWAS mega‐analysis and polygenic analysis, we used data of subjects genotyped in previously published GWAS cohorts of aneurysm cases and controls: 2 IA cohorts, 1 from the Netherlands12, 19, 20 and 1 from Finland,11, 12, 21, 22 1 AAA cohort from the Netherlands14, 18 and 1 TAA cohort from the United States.17 All studies were approved by the relevant medical ethical committees, and all participants provided written informed consent. All study populations were previously described in detail.12, 17, 19, 20 Below is a brief description of each study population.
IA cases in the Dutch cohort (n=786) were admitted to the University Medical Center Utrecht, (Utrecht, The Netherlands) between 1997 and 2011. All cases were genotyped on Illumina CNV370 Duo BeadChips (Illumina, San Diego, CA). Controls (n=2089) were ascertained by the Rotterdam Study, a population‐based cohort of subjects age 45 years and older recruited from a district in Rotterdam (The Netherlands). These controls were genotyped on Illumina HumanHap550 BeadChips.23
The Finnish IA cohort consisted of 790 cases treated at the Helsinki and Kuopio University hospitals and 2396 controls that were genetically matched to cases.24 Of these, 1666 controls were extracted from the Helsinki Birth Cohort Study (HBCS).21 Additionally, 651 controls were extracted from anonymous donors from Kuopio University Hospital and Helsinki and from the Health 2000 study (H2000).22 All cases were genotyped on Illumina CNV370 Duo BeadChips, and controls were genotyped on Illumina HumanHap550 BeadChips (HBCS) and on Illumina CNV370 Duo BeadChips (anonymous donors and H2000).
The Dutch and the Finnish IA cohort both included cases with ruptured and unruptured IA. Ruptured IA cases were defined by symptoms suggestive of subarachnoid hemorrhage (SAH) combined with subarachnoid blood on a computed tomography (CT) scan and a proven IA at angiography (conventional angiogram, CT‐ or magnetic resonance [MR] angiogram). Unruptured IA cases were identified by CT or MR angiography or conventional angiography in the absence of clinical or radiological signs of SAH. Patients with fusiform IA, possible traumatic SAH, and polycystic kidney disease were excluded.
The AAA cohort consisted of 859 cases, predominantly with unruptured AAA. These cases were recruited from 8 medical centers in The Netherlands, mainly when individuals visited their vascular surgeon in the outpatient clinic or, in some cases, during hospital admission for elective or emergency AAA surgery. An AAA was defined as an infrarenal aorta diameter of ≥30 mm. Mean AAA diameter was 58.4 mm. Of these patients, 530 had undergone surgery, including 43 with rupture. Genotyping was performed on Illumina HumanHap610 chips.14 As controls, we included 3110 Dutch subjects who were recruited as part of the Nijmegen Biomedical Study (n=1832) and the Nijmegen Bladder Cancer Study (n=1278).19, 20 These controls were genotyped on Illumina CNV370 Duo BeadChips.
The TAA cohort consisted of 765 cases with either an ascending TAA without dissection (n=401) or with a type A and/or type B aortic dissection (n=364). All cases were more than 30 years old, did not have a first‐degree relative with TAA or dissection, and had no evidence of a syndromic form of TAA or dissection. Samples were genotyped with Illumina CNV370‐Quad BeadChips. Controls (n=2229) were included from the Wellcome Trust Case‐Control Consortium (WTCCC) 1958 Birth Cohort (n=1355), and from the US National Institute of Neurological Disorders and Stroke (NINDS) Repository's Neurologically Normal Control Collection (n=874).
Quality Control
We performed quality control (QC) in each of the 4 cohorts separately, using PLINK software (version 1.07).25 After removal of SNPs with A/T or C/G alleles and SNPs that were not called in any individual, we performed sample QC and SNP QC.
Sample QC was performed after merging cases and controls, using a subset of common, high‐quality SNPs (as defined by SNPs without deviation from Hardy‐Weinberg equilibrium [HWE; P>0.001], with high minor allele frequency [MAF; >20%], and with low rate of missing genotypes [<1%]). Linkage disequilibrium (LD) pruning (r 2>0.5) was performed. Subjects were removed based on the following 3 criteria: missing genotypes (subjects with a call rate below 95% were removed); heterozygosity (subjects were excluded if the inbreeding coefficient deviated more than 3 SDs from the mean); and cryptic relatedness (by calculating identity‐by‐descent [IBD] for each pair of individuals). In each pair with an IBD proportion of >20%, a subject was excluded, if it exhibited distant relatedness with more than 1 individual. For case‐control pairs, we removed the control subject. In the case‐case or control‐control pairs, the subject with the lowest call rate was excluded.
Using these common, high‐quality SNPs, we performed principal components (PCs) analysis using EIGENSTRAT on the remaining study subjects and HapMap‐CEU subjects. We excluded SNPs from 3 regions with known long‐distance LD: the major histocompatibility region (chr6: 25.8–36 Mbp); the chromosome 8 inversion (chr8: 6–16 Mbp); and a chromosome 17 region (chr17: 40–45 Mbp). We created PC plots with the first 4 PCs, using R software (version 2.11; R Foundation for Statistical Computing, Vienna, Austria).26 Based on visual inspection of these plots, we excluded subjects that appeared to be outliers with respect to the CEU (Utah residents with ancestry from northern and western Europe) or the study population. After outlier removal, we recomputed PCs for them to be included as covariates in the logistic regression models. PC plots after outlier removal are shown in Figure 1.
Figure 1.
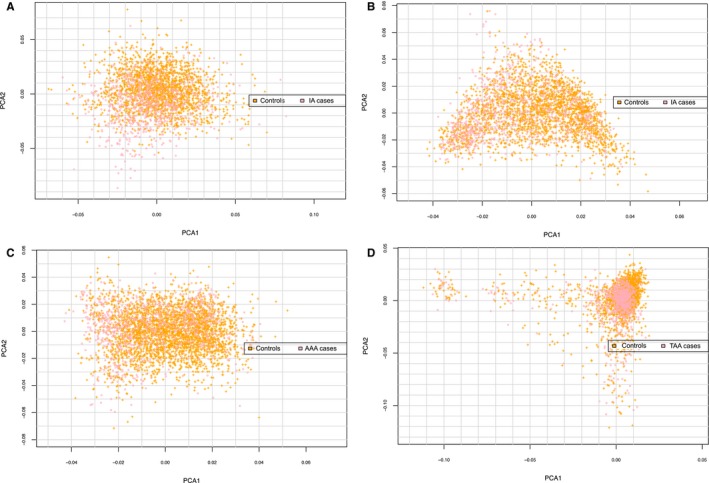
Principal component analysis (PCA) plots of IA, AAA, and TAA GWAS cohorts. (A) Dutch IA GWAS cohort; (B) Finnish IA GWAS cohort; (C) AAA GWAS cohort; (D) TAA GWAS cohort. These figures show PCA2 values plotted against PCA1 values for each individual in the 4 GWAS cohorts (Dutch IA and Finnish IA, AAA, and TAA) of the aneurysm mega‐analysis, after removal of outliers from quality control. AAA indicates abdominal aortic aneurysm; GWAS, genome‐wide association study; IA, intracranial aneurysm; TAA, thoracic aortic aneurysm.
After sample QC, we excluded SNPs with more than 2% missing genotypes, MAF <1%, missing genotype rate higher than MAF, and HWE deviation (P<0.001). Because cases and controls had been genotyped separately, we performed these QC steps in each study cohort separately and again after merging cases and controls. We also removed SNPs with a differential degree of missing genotypes between cases and controls (P<1×10⁻⁵; chi‐squared test).
Imputation
For each case‐control data set, we performed genotype imputation using the prephasing/imputation step‐wise approach implemented in IMPUTE2 and SHAPEIT (chunk size of 3 Mb and default parameters).27, 28 The imputation reference set consisted of 2184 phased haplotypes from the full 1000 Genomes Project data set (February 2012; 40 318 253 variants). All genomic locations are given in NCBI Build 37/UCSC hg19 coordinates. After imputation, SNPs with an imputation accuracy score <0.6 or MAF <0.5% were excluded.
GWAS Mega‐Analysis Across IA, AAA, and TAA
We performed a mega‐analysis on all 4 GWAS cohorts. Association testing was carried out in PLINK25 using imputed SNP dosages. We included as covariates the first 4 PCs and an indicator variable to adjust for each case‐control data set. SNPs with P<5×10⁻⁸ were considered as genome‐wide significant. We also performed a GWAS on each cohort separately and a combined analysis of only the Dutch and Finnish IA cohort, which was needed for the polygenic analysis as described below. We calculated genomic inflation factors (λGC) for each GWAS and the mega‐analysis, defined as the ratio of the median of the empirically observed distribution of the test statistic to the expected median.29
We calculated the statistical power for detecting a significant association (P<5×10⁻⁸) in the mega‐analysis using the genetic power calculator.30 In case of a risk allele frequency of 10%, the resulting power is 0.03% at a relative risk of 1.1 per allele, and 68.7% at a relative risk of 1.3 per allele, assuming additive effects. In case of a higher risk allele frequency of 20%, the power is 0.3% at a relative risk of 1.1 and 98.9% at a relative risk of 1.3 per allele.
Polygenic Analysis
We performed polygenic analysis as previously described.31 We used the IA cohorts (Dutch and Finnish cohorts combined) as a discovery sample and the AAA and TAA cohorts as 2 separate target samples, and vice versa, in all possible combinations (6 in total).
We pruned the SNPs genotyped or imputed in the discovery sample, using an LD threshold of r 2>0.1. For each genomic region, we chose SNPs with the lowest P values in the GWAS of the discovery sample, in order to retain a set of independent, maximally associated SNPs. Next, we created sets of SNPs with disease association in the discovery sample at 12 different significance thresholds, increasing from P<5×10⁻⁸ to P<0.5. For each SNP set, we calculated a polygenic risk score in each individual of target sample as follows:
where x i is the estimated allele dosage (between 0 and 2) in a given individual, and βi is the effect size from the GWAS in the discovery sample for the i th SNP. We tested the association between these polygenic risk scores and case‐control status in the target sample using logistic regression, adjusting for the first 4 PCs in the target sample. For analyses involving the combined IA cohort as target sample, we also adjusted for population (Finnish or Dutch). For analyses involving the IA and AAA cohorts as target and discovery sample, we also adjusted for the genotype of the known shared IA/AAA risk SNPs on locus 9p21.11, 18
LD Score Regression: Heritability Estimation and Genetic Correlation Analyses
We used LD score regression (LDSC) for heritability estimation and genetic correlation analysis.32 These analyses were applied to the same 4 GWAS datasets as used in the GWAS mega‐analysis and polygenic analysis described above (Dutch IA and Finnish IA, AAA, and TAA), but for this analysis we only included genotyped SNPs (after QC), and not imputed SNPs.
LDSC is a new approach that implements LD‐score weighted linear regression methods to estimate the variance (and covariance) explained by all SNPs on the whole genome for a complex trait. This method can distinguish true polygenicity from confounding effects attributed to population structure and cryptic relatedness. Under a polygenic model, the more‐genetic variants an index variant tags, the more the probability that the index variant will be significant.32 Under this reasoning, the expected χ2 statistic of variant j can be constructed as follows:
where N is the sample size; M is the number of SNPs, so that h2/M is the average heritability per SNP; a measures the contribution of confounding biases, like cryptic relatedness and population stratification; and is the sum of the r 2 values to all variants that a variant j tags, which is called the LD score of variant j. The LD score can be calculated using reference panel containing whole genome information of the population. For the analysis of the European population, we used the LD estimates that are from the European‐ancestry samples in the 1000 Genomes Project.33 Details were elaborated from the LDSC's GitHub repository.32
In addition to estimating heritability using LDSC, we also used LDSC to estimate genetic correlation (ρ) between each pair of 3 diseases (AAA, IA, and TAA).34 We investigated the Dutch and Finnish IA cohort separately in this analysis, and also tested the correlation between these two IA data sets, to evaluate the genetic correlation within 1 disease.
Effects of Previously Established Risk SNPs
We investigated the effect of established IA,10, 11, 12 AAA,13, 14, 15, 16 and TAA17 risk SNPs from previous GWASs in each of the other aneurysm types. We looked up the effect sizes and significance of these SNPs in separate case‐control data sets for IA, AAA and TAA beyond the individual‐participant data sets already described above. We did not have access to all genotype data of these data sets, but we obtained association results for these candidate SNPs only. For IA, we used GWAS results of 2 Japanese cohorts,11 a combined cohort of several previously IA studies that recruited subjects from mainly North America, but also Poland and Australia (further referred to as “USA+”),35 and the @neurIST study.11 For AAA, we used GWAS results of a cohort from Iceland, the United Kingdom, the United States, and 2 cohorts from New Zealand.15, 16, 36, 37 For TAA, no additional GWAS cohorts are currently available, to our knowledge. The sample sizes and other details per cohort are listed in Table 1. In total, the target samples available for this lookup analysis contained 6548 cases and 16 843 controls for IA, 4391 cases and 37 904 controls for AAA, and 760 cases and 2212 controls for TAA.
Table 1.
Overview of Study Populations Used for the Specific Lookup of Known IA, AAA, and TAA Risk SNPs
| Cohort | Cases (n) | Controls (n) |
|---|---|---|
| IA | ||
| Netherlands | 717 | 1987 |
| Finland | 799 | 2317 |
| Japan 1 | 288 | 194 |
| Japan 2 | 1383 | 5484 |
| USA+ | 2617 | 2548 |
| @neurIST | 717 | 3296 |
| Total | 6548 | 16 843 |
| AAA | ||
| Netherlands | 812 | 2998 |
| Iceland | 430 | 27 712 |
| USA | 724 | 1604 |
| Aneurysm Consortium | 1846 | 5605 |
| New Zealand 1 | 608 | 612 |
| New Zealand 2 | 400 | 384 |
| Total | 4391 | 37 904 |
| TAA | ||
| USA | 760 | 2212 |
AAA indicates abdominal aortic aneurysm; IA, intracranial aneurysm; SNPs, single‐nucleotide polymorphisms; TAA, thoracic aortic aneurysm.
We combined the GWAS results for the selected SNPs in the extended IA and AAA cohorts using an inverse‐variance fixed‐effects meta‐analysis. For each SNP, we first calculated z scores from the provided P values of each GWAS, and summed the z scores across all studies using the effective sample size of each study as weights.38 The resulting z scores were converted into chi‐square values and 2‐sided P values. We applied Bonferroni correction for performing 28 association tests (14 selected SNPs tested in 2 aneurysm types) and considered associations with P<1.8×10⁻³ (0.05/28) as significant. Figure 2 gives an overview of the methods described above.
Figure 2.
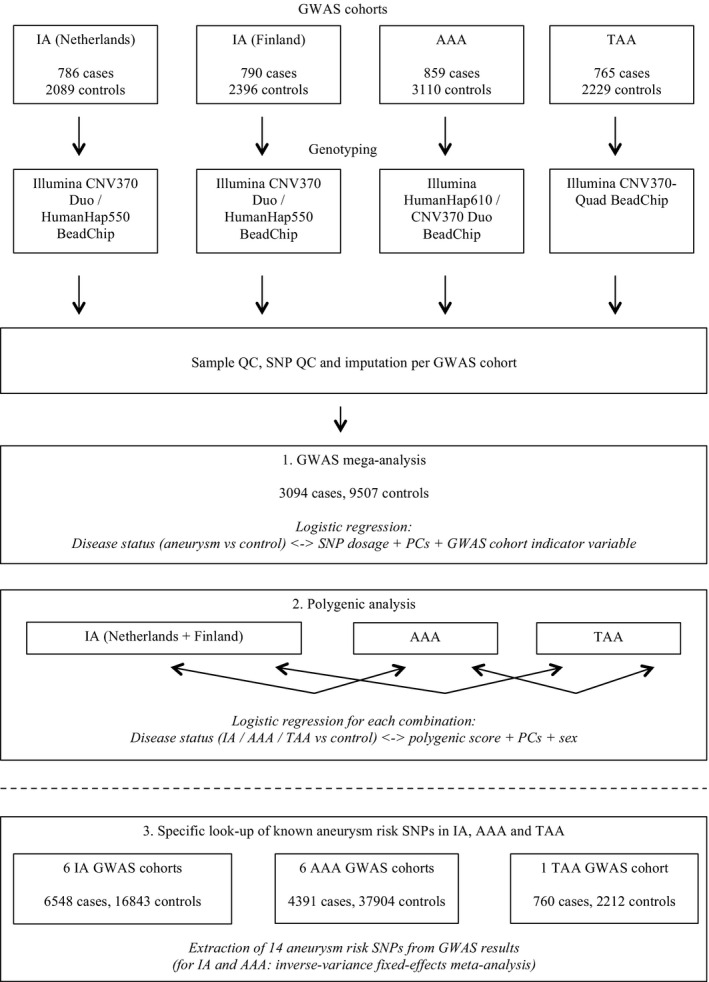
Work‐flow figure. This figure gives an overview of the study methods. AAA indicates abdominal aortic aneurysm; CNV, copy number variation; GWAS, genome‐wide association study; IA, intracranial aneurysm; PCs, principal components; QC, quality control; SNP, single‐nucleotide polymorphism; TAA, thoracic aortic aneurysm.
Results
Study Populations
Table 2 shows the numbers of cases, controls, and SNPs of all 4 cohorts after QC and imputation. Quantile‐quantile (QQ) plots for each GWAS per cohort are shown in Figure 3.
Table 2.
Baseline Characteristics After Quality Control and Imputation of the Study Populations Used for the Mega‐Analysis and Polygenic Analysis of IA, AAA, and TAA GWAS Data
| Characteristics | Study Cohort | |||
|---|---|---|---|---|
| IA (Netherlands) | IA (Finland) | AAA | TAA | |
| Cases, n | 717 | 799 | 818 | 760 |
| Women, % | 64.3 | 57.8 | 10.5 | 34.3 |
| Controls, n | 1988 | 2317 | 3004 | 2212 |
| Women, % | 56.2 | 57.2 | 37.7 | 53.0 |
| SNPs, n | 10 683 725 | 10 524 028 | 10 684 772 | 10 750 239 |
| Genomic inflation factor | 1.10 | 1.06 | 1.04 | 1.05 |
AAA indicates abdominal aortic aneurysm; GWAS, genome‐wide association study; IA, intracranial aneurysm; SNP, single‐nucleotide polymorphism; TAA, thoracic aortic aneurysm.
Figure 3.
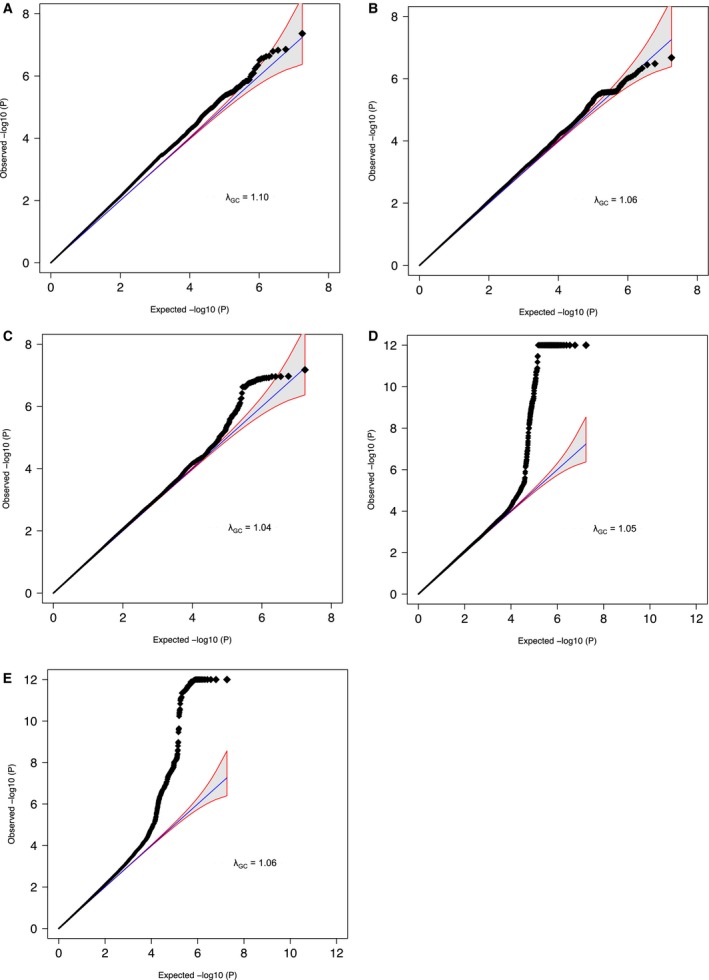
Quantile‐quantile (QQ) plots of IA, AAA, and TAA GWAS and the aneurysm mega‐analysis. A, Dutch IA GWAS; (B) Finnish IA GWAS; (C) AAA GWAS; (D) TAA GWAS; (E) aneurysm mega‐analysis. These QQ plots show the observed distribution of P values (black dots) plotted against the expected distribution of P values (blue line) on a negative log10 scale, for each of the 4 GWAS (Dutch IA and Finnish IA, AAA, and TAA) and for all cohorts combined in the aneurysm mega‐analysis. Genomic inflation factors (λGC) per study, defined as the ratio of the median of the empirically observed distribution of the test statistic to the expected median, are also shown. AAA indicates abdominal aortic aneurysm; GWAS, genome‐wide association study; IA, intracranial aneurysm; TAA, thoracic aortic aneurysm.
GWAS Mega‐Analysis Across IA, AAA, and TAA
In total, 3094 cases, 9507 controls, and 9 245 988 SNPs were available for the mega‐analysis across all 4 aneurysm cohorts (λGC=1.06). The results of this mega‐analysis are shown in a Manhattan plot (Figure 4). We found 4 genome‐wide significant loci, though all these loci were previously described as risk loci for IA, AAA, and/or TAA. The direction of effect for these loci was consistent across all four aneurysm cohorts (see forest plots in Figure 5). First, SNPs at the known IA and AAA risk locus 9p21 near CDKN2A, CDKN2B, and CDKN2BAS were associated.11, 18 The strongest association at this locus was found for rs7866503, with P=2.1×10⁻¹³. The second association was found for SNPs at the known IA risk locus 18q11 near RBBP8,11 with the strongest association for rs8087799 (P=1.6×10⁻⁹). The third association was found for SNPs at the known TAA risk locus 15q21 near FBN1,17 with the strongest association for rs595222 (P=1.0×10⁻⁸). The fourth association was found for rs919433 (P=4.6×10⁻⁸), which is located at 2q33 near ANKRD44. The same SNP was previously found to be associated with IA in a Finnish and Dutch population.24 This SNP is also in strong LD (r 2=0.7) with a nearby SNP (rs700651), which was previously found to be associated with IA in a Dutch, Finnish, and Japanese population,12 but did not reach genome‐wide significance after adding other populations of IA patients.11
Figure 4.
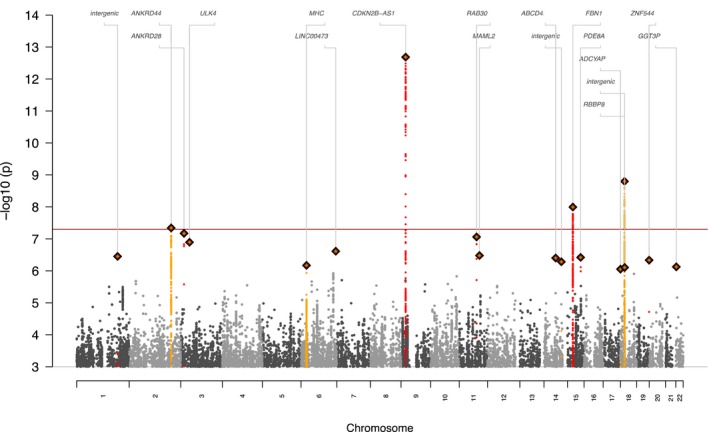
Manhattan plot of the aneurysm GWAS mega‐analysis. This Manhattan plot shows the P values of all SNPs with an association with P<10−4 to disease (IA, AAA, or TAA). P values on the y‐axis are presented on an inverse log scale. The x‐axis represents the genomic position of each SNP. The red horizontal line represents P=5×10⁻⁸, the cut‐off value for genome‐wide association. Index SNPs with P<1×10⁻⁶ are depicted as diamonds, whereas SNPs in the same LD block as these SNPs are depicted as yellow and red dots. AAA indicates abdominal aortic aneurysm; GWAS, genome‐wide association study; IA, intracranial aneurysm; LD, linkage disequilibrium; SNP, single‐nucleotide polymorphism; TAA, thoracic aortic aneurysm.
Figure 5.
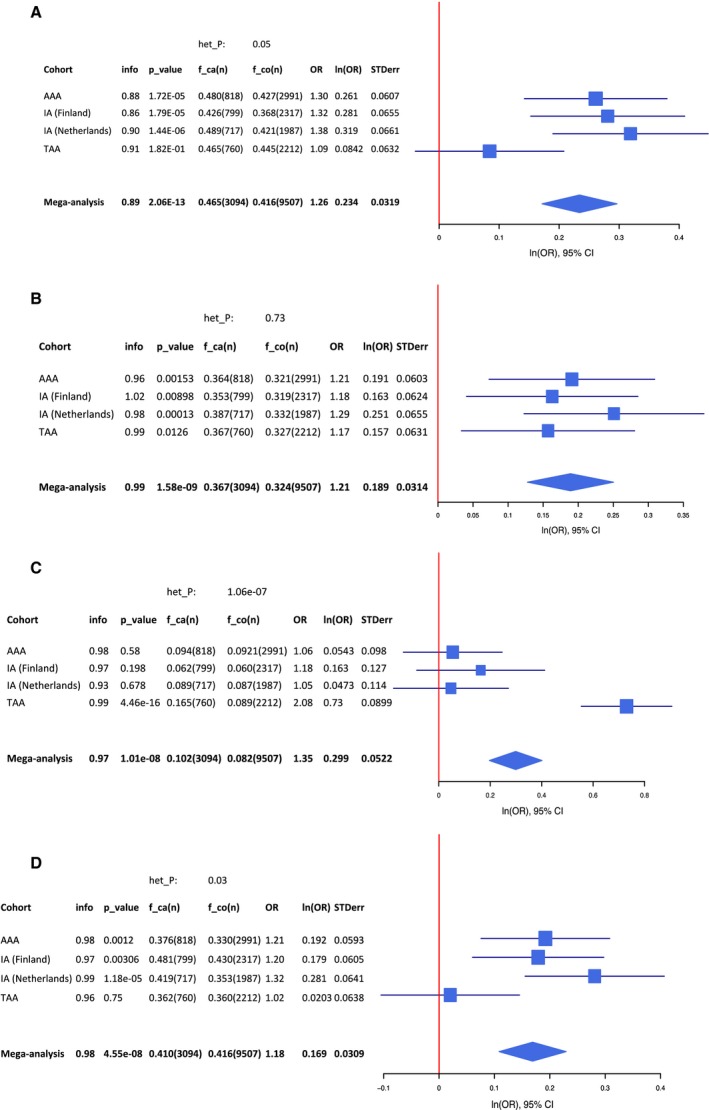
Forest plots of significant SNPs from the aneurysm mega‐analysis. A, rs7866503 (risk allele T) at locus 9p21; (B) rs8087799 (risk allele A) at locus 18q11; (C) rs595244 (risk allele T) at locus 15q21; (D) rs919433 (risk allele A) at locus 2q33. These figures show forest plots for each of the 4 genome‐wide significant SNPs from the mega‐analysis of IA, AAA, and TAA GWAS cohorts. AAA indicates abdominal aortic aneurysm; f_ca(n), risk allele frequency in cases (number of cases); f_co(n), risk allele frequency in controls (number of controls); het_P, P value for heterogeneity; IA, intracranial aneurysm; info, imputation accuracy score; ln(OR), natural log of odds ratio; OR, odds ratio; P_value, P value for association of risk allele in aneurysm cohort; SNP, single‐nucleotide polymorphism; STDerr, standard error; TAA, thoracic aortic aneurysm.
Polygenic Analysis
Next, we investigated whether groups of SNPs associated with 1 type of aneurysm (eg, IA) were also associated with the other types (eg, AAA or TAA). The results of these polygenic analyses with the IA, AAA, and TAA GWAS cohorts are shown in Tables 3, 4, 5, 6, 7 through 8 and in Figure 6. No SNP sets with a significant joint effect on another aneurysm type were observed, except for a small group of 7 SNPs associated with IA with P<10−6. This SNP set was associated with AAA with P=5×10⁻³ (Table 7). When taking a closer look at this SNP set, it appears that the polygenic association is driven by 2 SNPs (rs36071109 at 2q33; PAAA=2.3×10⁻³; and rs4330012 at 18q11; P (cursive)AAA= 1.3×10⁻²), both in very strong LD to genome‐wide significant SNPs in our mega‐analysis described above. (The pleiotropic 9p21 locus shared by IA and AAA had already been adjusted for.)
Table 3.
Polygenic Analysis: AAA‐Associated SNPs Tested for Association With TAA Case‐Control Status
| Threshold (P)a | SNPs (n)b | P Valuec | Direction of Effect |
|---|---|---|---|
| 5×10⁻⁸ | 0 | NA | NA |
| 1×10⁻⁷ | 1 | 0.269 | + |
| 1×10⁻⁶ | 4 | 0.262 | + |
| 1×10⁻⁵ | 21 | 0.481 | + |
| 1×10⁻⁴ | 181 | 0.979 | + |
| 1×10⁻³ | 1417 | 0.815 | + |
| 0.01 | 10 075 | 0.294 | + |
| 0.05 | 38 528 | 0.549 | + |
| 0.1 | 67 187 | 0.614 | − |
| 0.2 | 113 644 | 0.823 | − |
| 0.3 | 151 807 | 0.773 | − |
| 0.4 | 183 891 | 0.765 | − |
| 0.5 | 211 723 | 0.611 | − |
| 10−4 to 10−3 | 1236 | 0.787 | + |
| 10−3 to 0.01 | 8658 | 0.273 | + |
| 0.01 to 0.05 | 28 453 | 0.972 | − |
| 0.05 to 0.1 | 28 659 | 0.964 | − |
| 0.1 to 0.2 | 46 457 | 0.115 | − |
| 0.2 to 0.3 | 38 163 | 0.745 | − |
| 0.3 to 0.4 | 32 084 | 0.904 | − |
| 0.4 to 0.5 | 27 832 | 0.0915 | − |
AAA indicates abdominal aortic aneurysm; IA, intracranial aneurysm; NA, not applicable; SNPs, single‐nucleotide polymorphisms; TAA, thoracic aortic aneurysm.
P value threshold for inclusion of IA‐, AAA‐, or TAA‐associated SNPs in each polygenic model.
Number of SNPs included in each polygenic model.
P value for association of the polygenic model with IA, AAA or TAA case‐control status.
Table 4.
Polygenic Analysis: TAA‐Associated SNPs Tested for Association With AAA Case‐Control Status
| Threshold (P)a | SNPs (n)b | P Valuec | Direction of Effect |
|---|---|---|---|
| 5×10⁻⁸ | 1 | 0.581 | + |
| 1×10⁻⁷ | 1 | 0.581 | + |
| 1×10⁻⁶ | 1 | 0.581 | + |
| 1×10⁻⁵ | 25 | 0.853 | + |
| 1×10⁻⁴ | 148 | 0.971 | − |
| 1×10⁻³ | 1350 | 0.292 | + |
| 0.01 | 10 021 | 0.579 | + |
| 0.05 | 39 120 | 0.902 | − |
| 0.1 | 67 736 | 0.944 | − |
| 0.2 | 114 125 | 0.815 | − |
| 0.3 | 151 712 | 0.956 | − |
| 0.4 | 183 843 | 0.958 | − |
| 0.5 | 211 170 | 0.965 | − |
| 10−4 to 10−3 | 1202 | 0.252 | + |
| 10−3 to 0.01 | 8671 | 0.877 | − |
| 0.01 to 0.05 | 29 099 | 0.801 | − |
| 0.05 to 0.1 | 28 616 | 0.953 | − |
| 0.1 to 0.2 | 46 389 | 0.643 | + |
| 0.2 to 0.3 | 37 587 | 0.255 | − |
| 0.3 to 0.4 | 32 131 | 0.997 | − |
| 0.4 to 0.5 | 27 327 | 0.422 | + |
AAA indicates abdominal aortic aneurysm; IA, intracranial aneurysm; SNPs, single‐nucleotide polymorphisms; TAA, thoracic aortic aneurysm.
P value threshold for inclusion of IA‐, AAA‐, or TAA‐associated SNPs in each polygenic model.
Number of SNPs included in each polygenic model.
P value for association of the polygenic model with IA, AAA or TAA case‐control status.
Table 5.
Polygenic Analysis: IA‐Associated SNPs Tested for Association With TAA Case‐Control Status
| Threshold (P)a | SNPs (n)b | P Valuec | Direction of Effect |
|---|---|---|---|
| 5×10⁻⁸ | 2 | 0.464 | + |
| 1×10⁻⁷ | 3 | 0.459 | + |
| 1×10⁻⁶ | 7 | 0.964 | + |
| 1×10⁻⁵ | 36 | 0.361 | − |
| 1×10⁻⁴ | 263 | 0.24 | − |
| 1×10⁻³ | 1738 | 0.32 | − |
| 0.01 | 11 365 | 0.681 | + |
| 0.05 | 40 885 | 0.088 | + |
| 0.1 | 69 990 | 0.608 | + |
| 0.2 | 116 737 | 0.931 | − |
| 0.3 | 154 387 | 0.612 | − |
| 0.4 | 184 519 | 0.633 | − |
| 0.5 | 209 893 | 0.625 | − |
| 10−4 to 10−3 | 1475 | 0.572 | − |
| 10−3 to 0.01 | 9627 | 0.318 | + |
| 0.01 to 0.05 | 29 520 | 0.04 | + |
| 0.05 to 0.1 | 29 105 | 0.0699 | − |
| 0.1 to 0.2 | 46 747 | 0.193 | − |
| 0.2 to 0.3 | 37 650 | 0.105 | − |
| 0.3 to 0.4 | 30 132 | 0.951 | − |
| 0.4 to 0.5 | 25 374 | 0.864 | − |
AAA indicates abdominal aortic aneurysm; IA, intracranial aneurysm; SNPs, single‐nucleotide polymorphisms; TAA, thoracic aortic aneurysm.
*P value threshold for inclusion of IA‐, AAA‐, or TAA‐associated SNPs in each polygenic model.
Number of SNPs included in each polygenic model.
P value for association of the polygenic model with IA, AAA or TAA case‐control status.
Table 6.
Polygenic Analysis: TAA‐Associated SNPs Tested for Association With IA Case‐Control Status
| Threshold (P)a | SNPs (n)b | P Valuec | Direction of Effect |
|---|---|---|---|
| 5×10⁻⁸ | 1 | 0.245 | + |
| 1×10⁻⁷ | 1 | 0.245 | + |
| 1×10⁻⁶ | 1 | 0.245 | + |
| 1×10⁻⁵ | 25 | 0.0957 | − |
| 1×10⁻⁴ | 148 | 0.658 | − |
| 1×10⁻³ | 1347 | 0.741 | − |
| 0.01 | 10 030 | 0.547 | + |
| 0.05 | 39 150 | 0.72 | + |
| 0.1 | 67 783 | 0.693 | + |
| 0.2 | 114 079 | 0.554 | + |
| 0.3 | 151 575 | 0.538 | + |
| 0.4 | 183 611 | 0.651 | + |
| 0.5 | 210 876 | 0.675 | + |
| 10−4 to 10−3 | 1199 | 0.588 | − |
| 10−3 to 0.01 | 8683 | 0.592 | + |
| 0.01 to 0.05 | 29 120 | 0.965 | + |
| 0.05 to 0.1 | 28 633 | 0.813 | + |
| 0.1 to 0.2 | 46 296 | 0.487 | + |
| 0.2 to 0.3 | 37 496 | 0.761 | + |
| 0.3 to 0.4 | 32 036 | 0.409 | + |
| 0.4 to 0.5 | 27 265 | 0.84 | + |
AAA indicates abdominal aortic aneurysm; IA, intracranial aneurysm; SNPs, single‐nucleotide polymorphisms; TAA, thoracic aortic aneurysm.
P value threshold for inclusion of IA‐, AAA‐, or TAA‐associated SNPs in each polygenic model.
Number of SNPs included in each polygenic model.
P value for association of the polygenic model with IA, AAA or TAA case‐control status.
Table 7.
Polygenic Analysis: IA‐Associated SNPs (From Dutch and Finnish IA Cohorts Combined) Tested for Association With AAA Case‐Control Status
| Threshold (P)a | SNPs (n)b | P Valuec | Direction of Effect |
|---|---|---|---|
| 5×10⁻⁸ | 2 | 0.531 | + |
| 1×10⁻⁷ | 3 | 0.016 | + |
| 1×10⁻⁶ | 7 | 5.07×10⁻³ | + |
| 1×10⁻⁵ | 36 | 1.36×10⁻² | + |
| 1×10⁻⁴ | 256 | 0.694 | + |
| 1×10⁻³ | 1725 | 0.365 | − |
| 0.01 | 11 355 | 0.986 | + |
| 0.05 | 40 855 | 0.505 | + |
| 0.1 | 69 919 | 0.329 | − |
| 0.2 | 116 610 | 0.298 | − |
| 0.3 | 154 280 | 0.349 | − |
| 0.4 | 184 378 | 0.326 | − |
| 0.5 | 209 684 | 0.251 | − |
| 10−4 to 10−3 | 1469 | 0.401 | − |
| 10−3 to 0.01 | 9630 | 0.673 | + |
| 0.01 to 0.05 | 29 500 | 0.343 | − |
| 0.05 to 0.1 | 29 064 | 0.291 | − |
| 0.1 to 0.2 | 46 691 | 0.503 | − |
| 0.2 to 0.3 | 37 670 | 0.929 | + |
| 0.3 to 0.4 | 30 098 | 0.568 | − |
| 0.4 to 0.5 | 25 306 | 0.085 | − |
AAA indicates abdominal aortic aneurysm; IA, intracranial aneurysm; SNPs, single‐nucleotide polymorphisms; TAA, thoracic aortic aneurysm.
P value threshold for inclusion of IA‐, AAA‐, or TAA‐associated SNPs in each polygenic model.
Number of SNPs included in each polygenic model.
P value for association of the polygenic model with IA, AAA, or TAA case‐control status.
Table 8.
Polygenic Analysis: AAA‐Associated SNPs Tested for Association With IA Case‐Control Status
| Threshold (P)a | SNPs (n)b | P Valuec | Direction of Effect |
|---|---|---|---|
| 5×10⁻⁸ | 0 | NA | NA |
| 1×10⁻⁷ | 1 | 0.789 | − |
| 1×10⁻⁶ | 4 | 0.589 | + |
| 1×10⁻⁵ | 21 | 0.481 | + |
| 1×10⁻⁴ | 181 | 0.826 | + |
| 1×10⁻³ | 1420 | 0.914 | − |
| 0.01 | 10 094 | 0.362 | + |
| 0.05 | 38 571 | 0.72 | + |
| 0.1 | 67 304 | 0.596 | + |
| 0.2 | 113 818 | 0.827 | + |
| 0.3 | 152 058 | 0.874 | + |
| 0.4 | 184 216 | 0.700 | + |
| 0.5 | 212 087 | 0.585 | + |
| 10−4 to 10−3 | 1239 | 0.834 | − |
| 10−3 to 0.01 | 8674 | 0.318 | + |
| 0.01 to 0.05 | 28 477 | 0.239 | + |
| 0.05 to 0.1 | 28 733 | 0.592 | + |
| 0.1 to 0.2 | 46 514 | 0.549 | + |
| 0.2 to 0.3 | 38 240 | 0.153 | + |
| 0.3 to 0.4 | 32 158 | 0.163 | + |
| 0.4 to 0.5 | 27 871 | 0.162 | + |
AAA indicates abdominal aortic aneurysm; IA, intracranial aneurysm; NA, not applicable; SNPs, single nucleotide polymorphisms; TAA, thoracic aortic aneurysm.
P value threshold for inclusion of IA‐, AAA‐, or TAA‐associated SNPs in each polygenic model.
Number of SNPs included in each polygenic model.
P value for association of the polygenic model with IA, AAA, or TAA case‐control status.
Figure 6.

Polygenic analysis results. (A) AAA‐associated SNPs tested for association with TAA case‐control status; (B) TAA‐associated SNPs tested for association with AAA case‐control status; (C) IA‐associated SNPs tested for association with TAA case‐control status; (D) TAA‐associated SNPs tested for association with IA case‐control status; (E) IA‐associated SNPs tested for association with AAA case‐control status; (F) AAA‐associated SNPs tested for association with IA case‐control status. We created polygenic scores based on IA‐, AAA‐, and TAA‐associated SNPs at different P value thresholds and tested these scores for association to case‐control status in GWAS cohorts of IA, AAA, and TAA in each possible combination between these phenotypes. The figures show the resulting P values of the association tests (left y‐axis) for each polygenic model (x‐axis), with the corresponding number of SNPs in each model (right y‐axis). AAA indicates abdominal aortic aneurysm; GWAS, genome‐wide association study; IA, intracranial aneurysm; SNP, single‐nucleotide polymorphism; TAA, thoracic aortic aneurysm.
LD Score Regression: Heritability Estimation and Genetic Correlation Analyses
We attempted to analyze heritability of the 3 aneurysm subtypes using LDSC. The estimated heritability was 0.15 for AAA, 0.31 for the Finnish IA cohort, 0.34 for the Dutch IA cohort, and 0.40 for TAA (Table 9). These estimates are smaller than the twin‐based estimates as reported in the literature (0.41 for IA,39 0.70 for AAA,16 and unknown for TAA), but the SEs are large, so the differences are not statistically significant. Note that methods estimating heritability using SNP data can often underestimate the heritability if the SNP set does not tag all underlying causal variants.
Table 9.
Heritability Analysis Results From LDSC
| Cohort | h2 | SE (h2) |
|---|---|---|
| AAA | 0.160 | 0.179 |
| IA (Finland) | 0.314 | 0.258 |
| IA (The Netherlands) | 0.341 | 0.231 |
| TAA | 0.396 | 0.280 |
AAA indicates abdominal aortic aneurysm; h2, proportion of phenotypic variance explained by genetic effects; IA, intracranial aneurysm; LDSC, linkage disequilibrium score regression; TAA, thoracic aortic aneurysm.
We then performed genetic correlation analyses (Table 10). We found that all pairs did not show statistically significant genetic correlations (P>0.05). The direction of correlation was either close to zero or positive, but the SE values were large. As expected, we observed the largest genetic correlation between the 2 cohorts of the same IA disease (ρ=1.59). However, this correlation was also not significant (P=0.09; SE=0.93).
Table 10.
Genetic Correlation Analysis Results From LDSC (Linkage Disequilibrium Score Regression)
| Cohorts | Correlation (ρ) | Standard Error (ρ) | P Value |
|---|---|---|---|
| AAA—IA (Finland) | −0.032 | 0.557 | 0.955 |
| AAA—IA (Netherlands) | −0.384 | 0.658 | 0.560 |
| AAA—TAA | 0.243 | 0.777 | 0.754 |
| IA (Finland)—TAA | 0.685 | 0.509 | 0.179 |
| IA (Netherlands)—TAA | 0.847 | 0.740 | 0.253 |
| IA (Finland)—IA (Netherlands) | 1.591 | 0.928 | 0.086 |
The test evaluates the genetic correlation between diseases based on their common SNPs set corresponding to the structured LD from the reference panel. AAA indicates abdominal aortic aneurysm; IA, intracranial aneurysm; LDSC, linkage disequilibrium score regression; TAA, thoracic aortic aneurysm; ρ, genetic correlation.
Effects of Previously Established Risk SNPs
Table 11 shows the results of the lookup of previously published aneurysm risk SNPs in IA, AAA, and TAA GWAS results. Besides the 2 IA and AAA risk SNPs at 9p21, which are associated with IA and AAA but not TAA, we observed 2 SNPs with significant associations to another aneurysm type after multiple testing correction. First, the IA risk SNP rs11661542 at 18q11 near RBBP8 was associated with AAA (odds ratio [OR]=1.11; P=4.1×10⁻⁵). Second, the TAA risk SNP rs2118181 at 15q21 near FBN1 was associated with AAA (OR=1.07; P=1.1×10⁻³). The other TAA risk SNP rs10519177, which lies at the same locus but is independent from rs2118181, showed a suggestive, but not statistically significant, association to AAA (OR=1.01; P=0.016). For both significant associations, the direction of effect was concordant in all but 1 of the 6 AAA cohorts in the analysis, with no significant heterogeneity in the meta‐analysis of the 6 cohorts (P Cochran's Q=0.11 for rs11661542 at 18q11 and 0.45 for rs2118181 at 15q21).
Table 11.
Specific Lookup of Previously Published Aneurysm Risk SNPs in 6 Case‐Control Datasets of IA, 6 Case‐Control Data Sets of AAA, and 1 Case‐Control Data Set of TAA
| SNP—IA | Gene | Chr | RA | AAA | TAA | ||||||
|---|---|---|---|---|---|---|---|---|---|---|---|
| P Value | OR | Dira | P Cochran's Q | P Value | OR | Dira | P Cochran's Q | ||||
| rs684158110 | EDNRA | 4 | G | 0.62 | 0.98 | +−−−−+ | 0.45 | 0.43 | 1.07 | NA | NA |
| rs1095840912, b | SOX17 | 8 | A | 0.81 | 0.99 | −−++−− | 0.14 | 0.37 | 1.07 | NA | NA |
| rs929850612, b | SOX17 | 8 | A | 0.81 | 0.99 | −+−+−− | 0.09 | 0.67 | 0.97 | NA | NA |
| rs133304012 | CDKN2BAS | 9 | T | 1.5×10⁻⁸ | 1.15 | +++++− | 0.07 | 0.52 | 1.04 | NA | NA |
| rs1241340911 | CNNM2 | 10 | G | 0.69 | 1.02 | +−−−++ | 0.70 | 0.95 | 1.01 | NA | NA |
| rs931520411 | STARD13‐KL | 13 | T | 0.73 | 1.01 | −−++++ | 0.21 | 0.79 | 1.02 | NA | NA |
| rs1166154211 | RBBP8 | 18 | C | 4.1×10⁻⁵ | 1.11 | ++++−+ | 0.11 | 0.08 | 1.11 | NA | NA |
| SNP—AAA | Gene | Chr | RA | IA | TAA | ||||||
|---|---|---|---|---|---|---|---|---|---|---|---|
| P Value | OR | Dira | P Cochran's Q | P Value | OR | Dira | P Cochran's Q | ||||
| rs1075727818 | CDKN2BAS | 9 | G | 5.9×10⁻¹⁷ | 1.30 | +++… | 0.81 | 0.42 | 1.05 | NA | NA |
| rs146653513 | LRP1 | 12 | C | 0.95 | 1.00 | −−++−+ | 0.66 | 0.07 | 1.12 | NA | NA |
| rs702548614 | DAB2IP | 9 | A | 0.25 | 1.03 | +−++−+ | 0.36 | 0.70 | 0.97 | NA | NA |
| rs59983916 | SORT1 | 1 | G | 0.41 | 0.97 | −+−… | 0.76 | 0.42 | 0.94 | NA | NA |
| rs651172015 | LDLR | 19 | G | 0.15 | 1.07 | +−+−.. | 0.09 | 0.05 | 1.21 | NA | NA |
| SNP—TAA | Gene | Chr | RA | IA | AAA | ||||||
|---|---|---|---|---|---|---|---|---|---|---|---|
| P Value | OR | Dira | P Cochran's Q | P Value | OR | Dira | P Cochran's Q | ||||
| rs1051917717, c | FBN1 | 15 | G | 0.99 | 1.00 | ++−−++ | 0.25 | 0.016 | 1.01 | −+++−+ | 0.32 |
| rs211818117, c | FBN1 | 15 | G | 0.20 | 0.96 | ++−−−+ | 0.08 | 1.1×10⁻³ | 1.07 | +−++++ | 0.45 |
Lookup results in different cohorts were combined per subtype, using an inverse‐variance fixed‐effects meta‐analysis. AAA indicates abdominal aortic aneurysm; Chr, chromosome; Dir, direction of effect; IA, intracranial aneurysm; OR, odds ratio; P Cochran's Q, P value from Cochran's Q test; RA, risk allele; SNP, single nucleotide polymorphism; TAA, thoracic aortic aneurysm.
Direction of effect per cohort. For AAA, directions correspond to the cohorts “Iceland,” “Netherlands,” “USA,” “Aneurysm Consortium,” “New Zealand 1,” and “New Zealand 2,” respectively. For IA, directions correspond to the cohorts “Netherlands,” “Finland,” “USA,” “@neurIST,” “Japan 1,” and “Japan 2,” respectively. “+” indicates same direction as previously published aneurysm risk SNP; “−” indicates opposite direction; “.” indicates absence of the SNP in target cohort.
These 2 SNPs are independent (r 2=0.06).
These 2 SNPs are independent (r 2=0.24).
Discussion
In this study, we have applied multiple analytic approaches to detect a possible genetic overlap between IA, TAA, and AAA. By performing a GWAS mega‐analysis and polygenic analysis, we considered both sharing of significant risk loci with individually large effects on disease risk, as well as a cumulative effect of many loci with individually weak effects. Although we did not find novel shared aneurysm risk loci that were previously not described as risk loci for IA, AAA, and/or TAA, we did find some evidence for a shared genetic background of IA, AAA, and TAA. In the GWAS mega‐analysis across IA, AAA, and TAA, we detected genome‐wide significant associations for SNPs at 4 loci: 9p21, 18q11, 15q21, and 2q33. These were all previously described to be associated with IA, AAA, or TAA, but in this study, they showed globally consistent effects across all 3 aneurysm types. Polygenic analysis did not reveal any groups of weakly IA‐, AAA‐, or TAA‐associated loci with a joint effect on other aneurysm types. Similarly, LD‐score regression analyses did not show significant correlations between any pair of aneurysm subtypes. The correlation between 2 cohorts of the same subtype (IA) was relatively high, but also not significant. The absence of novel shared loci, a polygenic association or a genetic correlation can be attributed to the modest sample size and power, certainly in comparison to community‐wide efforts for coronary artery disease.40 It may therefore be premature to claim that there are genuinely no novel shared loci or shared polygenic effects for IA, AAA, and TAA.
After testing the association of bona‐fide aneurysm risk loci in other aneurysm types in much larger aneurysm GWAS cohorts (consisting of the mega‐analysis data plus additional IA and AAA GWAS cohorts), we found nominally significant associations of the IA risk locus 18q11 and the TAA risk locus 15q21 to AAA, both of which were previously unknown to be associated with AAA. The 15q21 locus has reported biological functions that could plausibly be related to aneurysm development, because it encompasses the FBN1 gene, which encodes fibrillin‐1, an extracellular matrix protein in the elastic fibers of the aortic wall. Mutations in FBN1 cause Marfan syndrome, which is often associated with (mainly thoracic) aortic aneurysms.17
There are extensive differences in pathophysiology and epidemiological risk factors between the 3 diseases. IAs are mostly saccular‐shaped dilatations, whereas AAAs and TAAs are more often fusiform; the vessel wall structure differs between the locations where IA, AAA, and TAA occur; and atherosclerosis has a clear role in AAA, in contrast to IA and TAA.41, 42, 43, 44 However, there have been previous reports of a co‐occurrence of AAA and TAA4, 5 and, to a lesser extent, of IA and aortic aneurysms.6, 7 Also, IA mainly co‐occurs with AAA and TAA within families,8, 9 so genetic sharing between IA, AAA, and TAA could theoretically be present in the familial form, but not in sporadic cases (which were primarily studied here). For example, mutations in TGFBR1 and TGFBR2 were found in families in which all 3 aneurysm types occur.8 Furthermore, a genetic linkage study in 26 families with both IA and AAA or TAA found linkage peaks at locus 6p23 and 11q24.45 Independent linkage studies on IA, AAA, and TAA also found linkage peaks at 11q24.46 We did not find associations of these loci in our study, which can be explained by our focus on the sporadic aneurysm cases, in contrast to the familial cases in the linkage studies.
In conclusion, our study results do not reveal new risk loci shared between IA, AAA, and TAA, but the effects of established IA, AAA, and TAA risk loci in other aneurysm types do suggest a shared genetic background. Future studies with larger sample sizes should increase the statistical power to detect common genetic variants with a smaller effect on disease risk, and to draw definitive conclusions on genetic correlation between aneurysm subtypes.
Appendix
Aneurysm Consortium
Matthew J. Bown, Seamus C. Harrison, Athanasios Saratzis, Ana Verissimo, Benjamin J. Wright, Suzannah Bumpstead, Annette F. Baas, Solveig Gretarsdottir, Stephen A. Badger, Anne H. Child, Rachel E. Clough, Gillian Cockerill, Hany Hafez, D. Julian A. Scott, Simon Futers, Soroush Sohrabi, Alberto Smith, Matthew M. Thompson, Frank M. van Bockxmeer, Stefan E. Matthiasson, Gudmar Thorleifsson, Unnur Thorsteinsdottir, Jan D. Blankensteijn, Joep A. W. Teijink, Cisca Wijmenga, Jacqueline de Graaf, Lambertus A. Kiemeney, Jutta Palmen, Andrew J. Smith, Jes S. Lindholt, Declan T. Bradley, Matthew Waltham, Sarah Edkins, Rhian Gwilliam, Sarah E. Hunt, Simon Potter, Jonathan Golledge, Per Eriksson, Paul E. Norman, Janet T. Powell, Kari Stefansson, John R. Thompson, Steve E. Humphries, Robert D. Sayers, Panos Deloukas, and Nilesh J. Samani.
Vascular Research Consortium of New Zealand
Gregory T. Jones, L. Victoria Phillip, Andre M. van Rij, Geraldine B. Hill, Michael J. A. Williams, Ian A. Thomson, Jo Krysa, Gerard T. Wilkins, Tony R. Merriman, Thodor M. Vasudevan, David R. Lewis, Ross D. Blair, and Andrew A. Hill.
Sources of Funding
van ’t Hof is supported by a grant of the Dutch Heart Foundation (NHS; Project No. 2008B004). Ruigrok is supported by a clinical fellowship grant of the Netherlands Organization for Scientific Research (NWO; Project No. 40‐00703‐98‐13533). Baas is supported by a grant from the Dr E. Dekker Program of the Netherlands Heart Foundation (2009T001). Bown is supported by a HEFCE Clinical Senior Lecturer Fellowship. Broderick is supported by a Familial Intracranial Aneurysm (FIA) grant (R01NS39512). Foroud is supported by an FIA grant (R03NS083468). Kubo is funded by the Instrumentarium Science Foundation, Finland, and by the Finnish Foundation for Cardiovascular Research, University of Eastern Finland. Saratzis is an NIHR Academic Clinical Lecturer. Milewicz is supported by grants from the National Institutes of Health (NIH; P50‐HL083794).
The generation and management of GWAS genotype data for the Rotterdam Study (RS I, RS II, and RS III) was executed by the Human Genotyping Facility of the Genetic Laboratory of the Department of Internal Medicine, Erasmus MC, Rotterdam, The Netherlands. The GWAS data sets are supported by the Netherlands Organization of Scientific Research NWO Investments (No. 175.010.2005.011, 911‐03‐012), the Genetic Laboratory of the Department of Internal Medicine, Erasmus MC, the Research Institute for Diseases in the Elderly (014‐93‐015; RIDE2), the Netherlands Genomics Initiative (NGI)/Netherlands Organization for Scientific Research (NWO), Netherlands Consortium for Healthy Aging (NCHA; Project No. 050‐060‐810). The Rotterdam Study is funded by Erasmus Medical Center and Erasmus University, Rotterdam, Netherlands Organization for the Health Research and Development (ZonMw), the Research Institute for Diseases in the Elderly (RIDE), the Ministry of Education, Culture and Science, the Ministry for Health, Welfare and Sports, the European Commission (DG XII), and the Municipality of Rotterdam.
The Japanese IA GWAS (named “Japan 2” in this study) was conducted as part of the Biobank Japan Project that was supported by the Ministry of Education, Culture, Sports, Sciences and Technology, Japan.
For the “USA+” IA GWAS, infrastructure was partly supported by Grant No. UL1RR025005, a component of the NIH and NIH Roadmap for Medical Research. This study was also supported by the National Health and Medical Research Council (NHMRC), Australia, and the Health Research Council of New Zealand. Additional funding was provided by a grant from Jagiellonian University Medical College K/ZDS/001456. The study also contains data from Atherosclerosis Risk in Communities, which is performed as a collaborative study supported by National Heart, Lung, and Blood Institute contracts (HHSN268201100005C, HHSN268201100006C, HHSN268201100007C, HHSN268201100008C, HHSN268201100009C, HHSN268201100010C, HHSN268201100011C, and HHSN26820110012C), R01HL087641, R01HL59367, and R01HL086694; National Human Genome Research Institute contract U01HG004402; and NIH contract HHSN268200625226C. Neurocognitive data were collected by U01 HL096812, HL096814, HL096899, HL096902, and HL096917 with previous brain MRI examinations funded by R01‐HL70825.
The @neurIST project is supported by the 6th framework program of the European Commission (www.aneurist.org) FP6‐IST‐2004–027703.
AAA GWAS data provided by the Aneurysm Consortium were funded by the Wellcome Trust (Award No. 084695) and makes use of data generated by the WTCCC. A full list of the investigators who contributed to the generation of the data is available from www.wtccc.org.uk. Funding for the WTCCC project was provided by the Wellcome Trust under awards 076113 and 085475. Funding for the New Zealand project was provided by the Health Research Council of New Zealand (08‐75, 14‐155). The Geisinger project was funded, in part, by the Pennsylvania Commonwealth Universal Research Enhancement Program, the Geisinger Clinical Research Fund, the American Heart Association, and the Ben Franklin Technology Development Fund of Pennsylvania. The eMERGE Network is funded by the NHGRI, with additional funding from the NIGMS through the following grants: U01HG004438 to Johns Hopkins University; U01HG004424 to The Broad Institute; U01HG004438 to CIDR; U01HG004610 and U01HG006375 to Group Health Cooperative; U01HG004608 to Marshfield Clinic; U01HG006389 to Essentia Institute of Rural Health; U01HG04599 and U01HG006379 to Mayo Clinic; U01HG004609 and U01HG006388 to Northwestern University; U01HG04603 and U01HG006378 to Vanderbilt University; U01HG006385 to the Coordinating Center; U01HG006382 to Geisinger Health System; and U01HG006380 to Icahn School of Medicine Mount Sinai. Vanderbilt's data set(s) used for the analyses described were obtained from Vanderbilt University Medical Center's BioVU, which is supported by institutional funding and by the National Center for Research Resources (Grant UL1 RR024975‐01; which is now at the National Center for Advancing Translational Sciences: Grant 2 UL1 TR000445‐06).
The project that created the data regarding the TAA cohort was supported by grants from the NIH (P50‐HL083794 and R01‐HL62594; UL1RR024148 and UL1RR025758 [CTSA]; K08‐HL080085), as well as the Doris Duke Charitable Trust, the Vivian L. Smith Foundation, the TexGen Foundation, and the Thoracic Surgery Foundation for Research and Education.
Disclosures
None.
Acknowledgments
We thank the staff and participants of the ARIC study for their important contributions. We also thank the NINDS and WTCCC for giving us the use of their control data, used for the TAA GWAS. We are also grateful to the staff from the Rotterdam Study and the participating general practitioners and pharmacists. We also thank Pascal Arp, Mila Jhamai, Marijn Verkerk, Lizbeth Herrera, and Marjolein Peters, MSc, and Carolina Medina‐Gomez, MSc, for their help in creating the GWAS database of the Rotterdam Study.
The following clinical centers and collaborators contributed to the sample and data collection of the @neurIST project (in order of number of recruited patients): Hôpitaux Universitaire de Genève et Faculté de médecine de Genève, Geneva, Switzerland (Philippe Bijlenga, Max Jägersberg, Alister Rogers, Bawarjan Schatlo, Patrick Teta, Karl Schaller, Vitor Mendes‐ Pereira, Ana Marcos Gonzalez, Ana Paula Narata, Karl O Lovblad, Daniel A. Rüfenacht); John Radcliffe Hospital, University of Oxford, Oxford, United Kingdom (Julia Yarnold, Paul Summers, Alison Clarke, Gulam Zilani, James Byrne); Hospital Clinic, Barcelona, Spain (Juan Macho, Jordi Blasco); University of Pècs Medical School, Pècs, Hungary (Peter Bukovics, Ferenc Kover, Istvan Hudak, Tamas Doczi); Erasmus University Medical Center, Rotterdam, The Netherlands (Roelof Risselada, Miriam CJM Sturkenboom); Royal Hallamshire Hospital, Sheffield, United Kingdom (Pankaj Singh, Alan Waterworth, Umang Patel, Stuart Coley, Patricia Lawford); and Hospital General de Catalunya, San Cugat del Valles, Spain (Teresa Sola, Elio Vivas).
(J Am Heart Assoc. 2016;5:e002603 doi: 10.1161/JAHA.115.002603)
The authors' affiliations are provided on page 16 of the article.
References
- 1. Sakalihasan N, Limet R, Defawe OD. Abdominal aortic aneurysm. Lancet. 2005;365:1577–1589. [DOI] [PubMed] [Google Scholar]
- 2. Nieuwkamp DJ, Setz LE, Algra A, Linn FH, de Rooij NK, Rinkel GJ. Changes in case fatality of aneurysmal subarachnoid haemorrhage over time, according to age, sex, and region: a meta‐analysis. Lancet Neurol. 2009;8:635–642. [DOI] [PubMed] [Google Scholar]
- 3. Chau KH, Elefteriades JA. Natural history of thoracic aortic aneurysms: size matters, plus moving beyond size. Prog Cardiovasc Dis. 2013;56:74–80. [DOI] [PubMed] [Google Scholar]
- 4. Larsson E, Vishnevskaya L, Kalin B, Granath F, Swedenborg J, Hultgren R. High frequency of thoracic aneurysms in patients with abdominal aortic aneurysms. Ann Surg. 2011;253:180–184. [DOI] [PubMed] [Google Scholar]
- 5. Svensjo S, Bengtsson H, Bergqvist D. Thoracic and thoracoabdominal aortic aneurysm and dissection: an investigation based on autopsy. Br J Surg. 1996;83:68–71. [DOI] [PubMed] [Google Scholar]
- 6. Miyazawa N, Akiyama I, Yamagata Z. Risk factors for the association of intracranial and aortic aneurysms. Acta Neurochir (Wien). 2007;149:221–229; discussion 229. [DOI] [PubMed] [Google Scholar]
- 7. Norrgard O, Angqvist KA, Fodstad H, Forssell A, Lindberg M. Co‐existence of abdominal aortic aneurysms and intracranial aneurysms. Acta Neurochir (Wien). 1987;87:34–39. [DOI] [PubMed] [Google Scholar]
- 8. Regalado E, Medrek S, Tran‐Fadulu V, Guo DC, Pannu H, Golabbakhsh H, Smart S, Chen JH, Shete S, Kim DH, Stern R, Braverman AC, Milewicz DM. Autosomal dominant inheritance of a predisposition to thoracic aortic aneurysms and dissections and intracranial saccular aneurysms. Am J Med Genet A. 2011;155A:2125–2130. [DOI] [PMC free article] [PubMed] [Google Scholar]
- 9. Kim DH, Van Ginhoven G, Milewicz DM. Familial aggregation of both aortic and cerebral aneurysms: evidence for a common genetic basis in a subset of families. Neurosurgery. 2005;56:655–661; discussion 655‐661. [DOI] [PubMed] [Google Scholar]
- 10. Yasuno K, Bakircioglu M, Low SK, Bilguvar K, Gaal E, Ruigrok YM, Niemela M, Hata A, Bijlenga P, Kasuya H, Jaaskelainen JE, Krex D, Auburger G, Simon M, Krischek B, Ozturk AK, Mane S, Rinkel GJ, Steinmetz H, Hernesniemi J, Schaller K, Zembutsu H, Inoue I, Palotie A, Cambien F, Nakamura Y, Lifton RP, Gunel M. Common variant near the endothelin receptor type A (EDNRA) gene is associated with intracranial aneurysm risk. Proc Natl Acad Sci USA. 2011;108:19707–19712. [DOI] [PMC free article] [PubMed] [Google Scholar]
- 11. Yasuno K, Bilguvar K, Bijlenga P, Low SK, Krischek B, Auburger G, Simon M, Krex D, Arlier Z, Nayak N, Ruigrok YM, Niemela M, Tajima A, von und zu Fraunberg M, Doczi T, Wirjatijasa F, Hata A, Blasco J, Oszvald A, Kasuya H, Zilani G, Schoch B, Singh P, Stuer C, Risselada R, Beck J, Sola T, Ricciardi F, Aromaa A, Illig T, Schreiber S, van Duijn CM, van den Berg LH, Perret C, Proust C, Roder C, Ozturk AK, Gaal E, Berg D, Geisen C, Friedrich CM, Summers P, Frangi AF, State MW, Wichmann HE, Breteler MM, Wijmenga C, Mane S, Peltonen L, Elio V, Sturkenboom MC, Lawford P, Byrne J, Macho J, Sandalcioglu EI, Meyer B, Raabe A, Steinmetz H, Rufenacht D, Jaaskelainen JE, Hernesniemi J, Rinkel GJ, Zembutsu H, Inoue I, Palotie A, Cambien F, Nakamura Y, Lifton RP, Gunel M. Genome‐wide association study of intracranial aneurysm identifies three new risk loci. Nat Genet. 2010;42:420–425. [DOI] [PMC free article] [PubMed] [Google Scholar]
- 12. Bilguvar K, Yasuno K, Niemela M, Ruigrok YM, von Und Zu Fraunberg M, van Duijn CM, van den Berg LH, Mane S, Mason CE, Choi M, Gaal E, Bayri Y, Kolb L, Arlier Z, Ravuri S, Ronkainen A, Tajima A, Laakso A, Hata A, Kasuya H, Koivisto T, Rinne J, Ohman J, Breteler MM, Wijmenga C, State MW, Rinkel GJ, Hernesniemi J, Jaaskelainen JE, Palotie A, Inoue I, Lifton RP, Gunel M. Susceptibility loci for intracranial aneurysm in European and Japanese populations. Nat Genet. 2008;40:1472–1477. [DOI] [PMC free article] [PubMed] [Google Scholar]
- 13. Bown MJ, Jones GT, Harrison SC, Wright BJ, Bumpstead S, Baas AF, Gretarsdottir S, Badger SA, Bradley DT, Burnand K, Child AH, Clough RE, Cockerill G, Hafez H, Scott DJ, Futers S, Johnson A, Sohrabi S, Smith A, Thompson MM, van Bockxmeer FM, Waltham M, Matthiasson SE, Thorleifsson G, Thorsteinsdottir U, Blankensteijn JD, Teijink JA, Wijmenga C, de Graaf J, Kiemeney LA, Assimes TL, McPherson R, Folkersen L, Franco‐Cereceda A, Palmen J, Smith AJ, Sylvius N, Wild JB, Refstrup M, Edkins S, Gwilliam R, Hunt SE, Potter S, Lindholt JS, Frikke‐Schmidt R, Tybjaerg‐Hansen A, Hughes AE, Golledge J, Norman PE, van Rij A, Powell JT, Eriksson P, Stefansson K, Thompson JR, Humphries SE, Sayers RD, Deloukas P, Samani NJ. Abdominal aortic aneurysm is associated with a variant in low‐density lipoprotein receptor‐related protein 1. Am J Hum Genet. 2011;89:619–627. [DOI] [PMC free article] [PubMed] [Google Scholar]
- 14. Gretarsdottir S, Baas AF, Thorleifsson G, Holm H, den Heijer M, de Vries JP, Kranendonk SE, Zeebregts CJ, van Sterkenburg SM, Geelkerken RH, van Rij AM, Williams MJ, Boll AP, Kostic JP, Jonasdottir A, Walters GB, Masson G, Sulem P, Saemundsdottir J, Mouy M, Magnusson KP, Tromp G, Elmore JR, Sakalihasan N, Limet R, Defraigne JO, Ferrell RE, Ronkainen A, Ruigrok YM, Wijmenga C, Grobbee DE, Shah SH, Granger CB, Quyyumi AA, Vaccarino V, Patel RS, Zafari AM, Levey AI, Austin H, Girelli D, Pignatti PF, Olivieri O, Martinelli N, Malerba G, Trabetti E, Becker LC, Becker DM, Reilly MP, Rader DJ, Mueller T, Dieplinger B, Haltmayer M, Urbonavicius S, Lindblad B, Gottsater A, Gaetani E, Pola R, Wells P, Rodger M, Forgie M, Langlois N, Corral J, Vicente V, Fontcuberta J, Espana F, Grarup N, Jorgensen T, Witte DR, Hansen T, Pedersen O, Aben KK, de Graaf J, Holewijn S, Folkersen L, Franco‐Cereceda A, Eriksson P, Collier DA, Stefansson H, Steinthorsdottir V, Rafnar T, Valdimarsson EM, Magnadottir HB, Sveinbjornsdottir S, Olafsson I, Magnusson MK, Palmason R, Haraldsdottir V, Andersen K, Onundarson PT, Thorgeirsson G, Kiemeney LA, Powell JT, Carey DJ, Kuivaniemi H, Lindholt JS, Jones GT, Kong A, Blankensteijn JD, Matthiasson SE, Thorsteinsdottir U, Stefansson K. Genome‐wide association study identifies a sequence variant within the DAB2IP gene conferring susceptibility to abdominal aortic aneurysm. Nat Genet. 2010;42:692–697. [DOI] [PMC free article] [PubMed] [Google Scholar]
- 15. Bradley DT, Hughes AE, Badger SA, Jones GT, Harrison SC, Wright BJ, Bumpstead S, Baas AF, Gretarsdottir S, Burnand K, Child AH, Clough RE, Cockerill G, Hafez H, Scott DJ, Ariens RA, Johnson A, Sohrabi S, Smith A, Thompson MM, van Bockxmeer FM, Waltham M, Matthiasson SE, Thorleifsson G, Thorsteinsdottir U, Blankensteijn JD, Teijink JA, Wijmenga C, de Graaf J, Kiemeney LA, Wild JB, Edkins S, Gwilliam R, Hunt SE, Potter S, Lindholt JS, Golledge J, Norman PE, van Rij A, Powell JT, Eriksson P, Stefansson K, Thompson JR, Humphries SE, Sayers RD, Deloukas P, Samani NJ, Bown MJ. A variant in LDLR is associated with abdominal aortic aneurysm. Circ Cardiovasc Genet. 2013;6:498–504. [DOI] [PubMed] [Google Scholar]
- 16. Jones GT, Bown MJ, Gretarsdottir S, Romaine SP, Helgadottir A, Yu G, Tromp G, Norman PE, Jin C, Baas AF, Blankensteijn JD, Kullo IJ, Phillips LV, Williams MJ, Topless R, Merriman TR, Vasudevan TM, Lewis DR, Blair RD, Hill AA, Sayers RD, Powell JT, Deloukas P, Thorleifsson G, Matthiasson SE, Thorsteinsdottir U, Golledge J, Ariens RA, Johnson A, Sohrabi S, Scott DJ, Carey DJ, Erdman R, Elmore JR, Kuivaniemi H, Samani NJ, Stefansson K, van Rij AM. A sequence variant associated with sortilin‐1 (SORT1) on 1p13.3 is independently associated with abdominal aortic aneurysm. Hum Mol Genet. 2013;22:2941–2947. [DOI] [PMC free article] [PubMed] [Google Scholar]
- 17. Lemaire SA, McDonald ML, Guo DC, Russell L, Miller CC III, Johnson RJ, Bekheirnia MR, Franco LM, Nguyen M, Pyeritz RE, Bavaria JE, Devereux R, Maslen C, Holmes KW, Eagle K, Body SC, Seidman C, Seidman JG, Isselbacher EM, Bray M, Coselli JS, Estrera AL, Safi HJ, Belmont JW, Leal SM, Milewicz DM. Genome‐wide association study identifies a susceptibility locus for thoracic aortic aneurysms and aortic dissections spanning FBN1 at 15q21.1. Nat Genet. 2011;43:996–1000. [DOI] [PMC free article] [PubMed] [Google Scholar]
- 18. Helgadottir A, Thorleifsson G, Magnusson KP, Gretarsdottir S, Steinthorsdottir V, Manolescu A, Jones GT, Rinkel GJ, Blankensteijn JD, Ronkainen A, Jaaskelainen JE, Kyo Y, Lenk GM, Sakalihasan N, Kostulas K, Gottsater A, Flex A, Stefansson H, Hansen T, Andersen G, Weinsheimer S, Borch‐Johnsen K, Jorgensen T, Shah SH, Quyyumi AA, Granger CB, Reilly MP, Austin H, Levey AI, Vaccarino V, Palsdottir E, Walters GB, Jonsdottir T, Snorradottir S, Magnusdottir D, Gudmundsson G, Ferrell RE, Sveinbjornsdottir S, Hernesniemi J, Niemela M, Limet R, Andersen K, Sigurdsson G, Benediktsson R, Verhoeven EL, Teijink JA, Grobbee DE, Rader DJ, Collier DA, Pedersen O, Pola R, Hillert J, Lindblad B, Valdimarsson EM, Magnadottir HB, Wijmenga C, Tromp G, Baas AF, Ruigrok YM, van Rij AM, Kuivaniemi H, Powell JT, Matthiasson SE, Gulcher JR, Thorgeirsson G, Kong A, Thorsteinsdottir U, Stefansson K. The same sequence variant on 9p21 associates with myocardial infarction, abdominal aortic aneurysm and intracranial aneurysm. Nat Genet. 2008;40:217–224. [DOI] [PubMed] [Google Scholar]
- 19. Kiemeney LA, Thorlacius S, Sulem P, Geller F, Aben KK, Stacey SN, Gudmundsson J, Jakobsdottir M, Bergthorsson JT, Sigurdsson A, Blondal T, Witjes JA, Vermeulen SH, Hulsbergen‐van de Kaa CA, Swinkels DW, Ploeg M, Cornel EB, Vergunst H, Thorgeirsson TE, Gudbjartsson D, Gudjonsson SA, Thorleifsson G, Kristinsson KT, Mouy M, Snorradottir S, Placidi D, Campagna M, Arici C, Koppova K, Gurzau E, Rudnai P, Kellen E, Polidoro S, Guarrera S, Sacerdote C, Sanchez M, Saez B, Valdivia G, Ryk C, de Verdier P, Lindblom A, Golka K, Bishop DT, Knowles MA, Nikulasson S, Petursdottir V, Jonsson E, Geirsson G, Kristjansson B, Mayordomo JI, Steineck G, Porru S, Buntinx F, Zeegers MP, Fletcher T, Kumar R, Matullo G, Vineis P, Kiltie AE, Gulcher JR, Thorsteinsdottir U, Kong A, Rafnar T, Stefansson K. Sequence variant on 8q24 confers susceptibility to urinary bladder cancer. Nat Genet. 2008;40:1307–1312. [DOI] [PMC free article] [PubMed] [Google Scholar]
- 20. Wetzels JF, Kiemeney LA, Swinkels DW, Willems HL, den Heijer M. Age‐ and gender‐specific reference values of estimated GFR in Caucasians: the Nijmegen Biomedical Study. Kidney Int. 2007;72:632–637. [DOI] [PubMed] [Google Scholar]
- 21. Barker DJ, Osmond C, Forsen TJ, Kajantie E, Eriksson JG. Trajectories of growth among children who have coronary events as adults. N Engl J Med. 2005;353:1802–1809. [DOI] [PubMed] [Google Scholar]
- 22. Aromaa A, Koskinen S. Health and Functional Capacity in Finland. Baseline Results of the Health 2000 Health Examination Survey. Publications of the National Public Health Institute; 2004. [Google Scholar]
- 23. Hofman A, Darwish Murad S, van Duijn CM, Franco OH, Goedegebure A, Ikram MA, Klaver CC, Nijsten TE, Peeters RP, Stricker BH, Tiemeier HW, Uitterlinden AG, Vernooij MW. The Rotterdam Study: 2014 objectives and design update. Eur J Epidemiol. 2013;28:889–926. [DOI] [PubMed] [Google Scholar]
- 24. Kurki MI, Gaal EI, Kettunen J, Lappalainen T, Menelaou A, Anttila V, van ‘t Hof FN, von Und Zu Fraunberg M, Helisalmi S, Hiltunen M, Lehto H, Laakso A, Kivisaari R, Koivisto T, Ronkainen A, Rinne J, Kiemeney LA, Vermeulen SH, Kaunisto MA, Eriksson JG, Aromaa A, Perola M, Lehtimaki T, Raitakari OT, Salomaa V, Gunel M, Dermitzakis ET, Ruigrok YM, Rinkel GJ, Niemela M, Hernesniemi J, Ripatti S, de Bakker PI, Palotie A, Jaaskelainen JE. High risk population isolate reveals low frequency variants predisposing to intracranial aneurysms. PLoS Genet. 2014;10:e1004134. [DOI] [PMC free article] [PubMed] [Google Scholar]
- 25. Purcell S, Neale B, Todd‐Brown K, Thomas L, Ferreira MA, Bender D, Maller J, Sklar P, de Bakker PI, Daly MJ, Sham PC. PLINK: a tool set for whole‐genome association and population‐based linkage analyses. Am J Hum Genet. 2007;81:559–575. [DOI] [PMC free article] [PubMed] [Google Scholar]
- 26. R Core Team . R: A Language and Environment for Statistical Computing. Vienna, Austria: R Foundation for Statistical Computing; 2012. ISBN 3‐900051‐07‐0. Available at: http://www.R-project.org/. Accessed January 1, 2012. [Google Scholar]
- 27. Howie B, Marchini J, Stephens M. Genotype imputation with thousands of genomes. G3 (Bethesda). 2011;1:457–470. [DOI] [PMC free article] [PubMed] [Google Scholar]
- 28. Delaneau O, Marchini J, Zagury JF. A linear complexity phasing method for thousands of genomes. Nat Methods. 2012;9:179–181. [DOI] [PubMed] [Google Scholar]
- 29. Devlin B, Roeder K. Genomic control for association studies. Biometrics. 1999;55:997–1004. [DOI] [PubMed] [Google Scholar]
- 30. Purcell S, Cherny SS, Sham PC. Genetic Power Calculator: design of linkage and association genetic mapping studies of complex traits. Bioinformatics. 2003;19:149–150. [DOI] [PubMed] [Google Scholar]
- 31. Purcell SM, Wray NR, Stone JL, Visscher PM, O'Donovan MC, Sullivan PF, Sklar P. Common polygenic variation contributes to risk of schizophrenia and bipolar disorder. Nature. 2009;460:748–752. [DOI] [PMC free article] [PubMed] [Google Scholar]
- 32. Bulik‐Sullivan BK, Loh PR, Finucane HK, Ripke S, Yang J, Patterson N, Daly MJ, Price AL, Neale BM. LD Score regression distinguishes confounding from polygenicity in genome‐wide association studies. Nat Genet. 2015;47:291–295. [DOI] [PMC free article] [PubMed] [Google Scholar]
- 33. Abecasis GR, Auton A, Brooks LD, DePristo MA, Durbin RM, Handsaker RE, Kang HM, Marth GT, McVean GA. An integrated map of genetic variation from 1,092 human genomes. Nature. 2012;491:56–65. [DOI] [PMC free article] [PubMed] [Google Scholar]
- 34. Bulik‐Sullivan B, Finucane HK, Anttila V, Gusev A, Day FR, Loh PR, Duncan L, Perry JR, Patterson N, Robinson EB, Daly MJ, Price AL, Neale BM. An atlas of genetic correlations across human diseases and traits. Nat Genet. 2015;47:1236–1241. [DOI] [PMC free article] [PubMed] [Google Scholar]
- 35. Foroud T, Lai D, Koller D, Van't Hof F, Kurki MI, Anderson CS, Brown RD Jr, Connolly ES, Eriksson JG, Flaherty M, Fornage M, von Und Zu Fraunberg M, Gaal EI, Laakso A, Hernesniemi J, Huston J, Jaaskelainen JE, Kiemeney LA, Kivisaari R, Kleindorfer D, Ko N, Lehto H, Mackey J, Meissner I, Moomaw CJ, Mosley TH, Moskala M, Niemela M, Palotie A, Pera J, Rinkel G, Ripke S, Rouleau G, Ruigrok Y, Sauerbeck L, Slowik A, Vermeulen SH, Woo D, Worrall BB, Broderick J. Genome‐wide association study of intracranial aneurysm identifies a new association on chromosome 7. Stroke. 2014;45:3194–3199. [DOI] [PMC free article] [PubMed] [Google Scholar]
- 36. Smelser DT, Tromp G, Elmore JR, Kuivaniemi H, Franklin DP, Kirchner HL, Carey DJ. Population risk factor estimates for abdominal aortic aneurysm from electronic medical records: a case control study. BMC Cardiovasc Disord. 2014;14:174. [DOI] [PMC free article] [PubMed] [Google Scholar]
- 37. Verma SS, de Andrade M, Tromp G, Kuivaniemi H, Pugh E, Namjou‐Khales B, Mukherjee S, Jarvik GP, Kottyan LC, Burt A, Bradford Y, Armstrong GD, Derr K, Crawford DC, Haines JL, Li R, Crosslin D, Ritchie MD. Imputation and quality control steps for combining multiple genome‐wide datasets. Front Genet. 2014;5:370. [DOI] [PMC free article] [PubMed] [Google Scholar]
- 38. de Bakker PI, Ferreira MA, Jia X, Neale BM, Raychaudhuri S, Voight BF. Practical aspects of imputation‐driven meta‐analysis of genome‐wide association studies. Hum Mol Genet. 2008;17:R122–R128. [DOI] [PMC free article] [PubMed] [Google Scholar]
- 39. Korja M, Silventoinen K, McCarron P, Zdravkovic S, Skytthe A, Haapanen A, de Faire U, Pedersen NL, Christensen K, Koskenvuo M, Kaprio J. Genetic epidemiology of spontaneous subarachnoid hemorrhage: Nordic Twin Study. Stroke. 2010;41:2458–2462. [DOI] [PubMed] [Google Scholar]
- 40. Deloukas P, Kanoni S, Willenborg C, Farrall M, Assimes TL, Thompson JR, Ingelsson E, Saleheen D, Erdmann J, Goldstein BA, Stirrups K, Konig IR, Cazier JB, Johansson A, Hall AS, Lee JY, Willer CJ, Chambers JC, Esko T, Folkersen L, Goel A, Grundberg E, Havulinna AS, Ho WK, Hopewell JC, Eriksson N, Kleber ME, Kristiansson K, Lundmark P, Lyytikainen LP, Rafelt S, Shungin D, Strawbridge RJ, Thorleifsson G, Tikkanen E, Van Zuydam N, Voight BF, Waite LL, Zhang W, Ziegler A, Absher D, Altshuler D, Balmforth AJ, Barroso I, Braund PS, Burgdorf C, Claudi‐Boehm S, Cox D, Dimitriou M, Do R, Doney AS, El Mokhtari N, Eriksson P, Fischer K, Fontanillas P, Franco‐Cereceda A, Gigante B, Groop L, Gustafsson S, Hager J, Hallmans G, Han BG, Hunt SE, Kang HM, Illig T, Kessler T, Knowles JW, Kolovou G, Kuusisto J, Langenberg C, Langford C, Leander K, Lokki ML, Lundmark A, McCarthy MI, Meisinger C, Melander O, Mihailov E, Maouche S, Morris AD, Muller‐Nurasyid M, Nikus K, Peden JF, Rayner NW, Rasheed A, Rosinger S, Rubin D, Rumpf MP, Schafer A, Sivananthan M, Song C, Stewart AF, Tan ST, Thorgeirsson G, van der Schoot CE, Wagner PJ, Wells GA, Wild PS, Yang TP, Amouyel P, Arveiler D, Basart H, Boehnke M, Boerwinkle E, Brambilla P, Cambien F, Cupples AL, de Faire U, Dehghan A, Diemert P, Epstein SE, Evans A, Ferrario MM, Ferrieres J, Gauguier D, Go AS, Goodall AH, Gudnason V, Hazen SL, Holm H, Iribarren C, Jang Y, Kahonen M, Kee F, Kim HS, Klopp N, Koenig W, Kratzer W, Kuulasmaa K, Laakso M, Laaksonen R, Lee JY, Lind L, Ouwehand WH, Parish S, Park JE, Pedersen NL, Peters A, Quertermous T, Rader DJ, Salomaa V, Schadt E, Shah SH, Sinisalo J, Stark K, Stefansson K, Tregouet DA, Virtamo J, Wallentin L, Wareham N, Zimmermann ME, Nieminen MS, Hengstenberg C, Sandhu MS, Pastinen T, Syvanen AC, Hovingh GK, Dedoussis G, Franks PW, Lehtimaki T, Metspalu A, Zalloua PA, Siegbahn A, Schreiber S, Ripatti S, Blankenberg SS, Perola M, Clarke R, Boehm BO, O'Donnell C, Reilly MP, Marz W, Collins R, Kathiresan S, Hamsten A, Kooner JS, Thorsteinsdottir U, Danesh J, Palmer CN, Roberts R, Watkins H, Schunkert H, Samani NJ. Large‐scale association analysis identifies new risk loci for coronary artery disease. Nat Genet. 2013;45:25–33. [DOI] [PMC free article] [PubMed] [Google Scholar]
- 41. Penn DL, Witte SR, Komotar RJ, Sander Connolly E Jr. The role of vascular remodeling and inflammation in the pathogenesis of intracranial aneurysms. J Clin Neurosci. 2014;21:28–32. [DOI] [PubMed] [Google Scholar]
- 42. Guo DC, Papke CL, He R, Milewicz DM. Pathogenesis of thoracic and abdominal aortic aneurysms. Ann N Y Acad Sci. 2006;1085:339–352. [DOI] [PubMed] [Google Scholar]
- 43. Norman PE, Powell JT. Site specificity of aneurysmal disease. Circulation. 2010;121:560–568. [DOI] [PubMed] [Google Scholar]
- 44. Tromp G, Kuivaniemi H, Hinterseher I, Carey DJ. Novel genetic mechanisms for aortic aneurysms. Curr Atheroscler Rep. 2010;12:259–266. [DOI] [PubMed] [Google Scholar]
- 45. Worrall BB, Foroud T, Brown RD Jr, Connolly ES, Hornung RW, Huston J III, Kleindorfer D, Koller DL, Lai D, Moomaw CJ, Sauerbeck L, Woo D, Broderick JP. Genome screen to detect linkage to common susceptibility genes for intracranial and aortic aneurysms. Stroke. 2009;40:71–76. [DOI] [PMC free article] [PubMed] [Google Scholar]
- 46. Ruigrok YM, Elias R, Wijmenga C, Rinkel GJ. A comparison of genetic chromosomal loci for intracranial, thoracic aortic, and abdominal aortic aneurysms in search of common genetic risk factors. Cardiovasc Pathol. 2008;17:40–47. [DOI] [PubMed] [Google Scholar]