

Abstract
Background
This study aimed to determine the relationship of statin therapy and cardiovascular risk factors to changes in atherosclerosis in the carotid artery.
Methods and Results
Carotid magnetic resonance imaging was used to evaluate 106 hyperlipidemic participants at baseline and after 12 months of 3‐hydroxy‐3‐methylglutaryl coenzyme A reductase inhibitor (statin) treatment. Multivariable logistic regression was used to determine factors associated with progression (change in carotid wall volume >0) or regression (change ≤0) of carotid atherosclerosis. Computed tomography coronary calcium scores were obtained at baseline for all participants. The median age was 65 years (interquartile range 60–69 years), and 63% of the participants were male. Body mass index >30, elevated C‐reactive protein, and hypertension were associated with increased carotid wall volume (obesity: odds ratio for progression 4.6, 95% CI 1.8–12.4, P<0.01; C‐reactive protein: odds ratio for progression 2.56, 95% CI 1.17–5.73, P=0.02; hypertension: odds ratio 2.4, 95% CI 1.1–5.3, P<0.05). Higher statin dose was associated with regression of carotid wall volume (P<0.05). In multivariable analysis, obesity remained associated with progression (P<0.01), whereas statin use remained associated with regression (P<0.05). Change in atheroma volume in obese participants was +4.8% versus −4.2% in nonobese participants (P<0.05) despite greater low‐density lipoprotein cholesterol reduction in obese participants.
Conclusions
In a population with hyperlipidemia, obese patients showed atheroma progression despite optimized statin therapy.
Clinical Trial Registration
URL: http://www.clinicaltrials.gov. Unique identifier: NCT01212900.
Keywords: carotid artery, carotid magnetic resonance imaging, obesity
Subject Categories: Atherosclerosis, Vascular Disease, Magnetic Resonance Imaging (MRI), Blood Pressure
Introduction
Cardiovascular disease is the leading cause of morbidity worldwide.1 Although 3‐hydroxy‐3‐methylglutaryl coenzyme A reductase inhibitor (statin) therapy significantly reduces overall mortality, substantial differences in individual clinical response of low‐density lipoprotein (LDL) cholesterol to statin therapy are now well documented.2, 3 A better understanding of the factors modulating statin efficacy is essential for personalization of therapy for cardiovascular disease prevention.4
Traditional clinical risk factors, blood parameters such as C‐reactive protein, and imaging biomarkers have been shown to contribute to an individual patient's risk assessment for future cardiovascular events.5, 6, 7, 8 For those treated with statins, identification of atheroma using imaging may be useful for direct assessment of the success or failure of therapy. Coronary artery calcium (CAC) score has been intensively studied in this regard, but multiple studies have shown either progression of CAC or lack of regression during treatment.9, 10 In contrast, longitudinal measurements of atherosclerotic plaque using intravascular ultrasound (IVUS)11 and carotid artery magnetic resonance imaging (MRI)12, 13, 14 have shown that these technologies can be used to assess change in atheroma during statin therapy.
Prior IVUS and MRI studies of the response to statin therapy have focused primarily on high‐risk patients with cardiovascular events or high degrees of plaque.15, 16 Prior studies have not assessed change of atherosclerosis in lower risk patients receiving statin therapy; small sample sizes have prevented assessment of factors that modify atheroma response to statins. The purpose of this study was to evaluate the change of atherosclerosis in the carotid artery wall in hyperlipidemic participants during the course of treatment with statins and to determine cardiovascular risk factors associated with change in extent of atherosclerosis.
Materials and Methods
Study Design
This study complied with the Health Insurance Portability and Accountability Act and was approved by our institutional review board, and written informed consent was obtained from all participants. Study participants were evaluated at enrollment and after 12 months as part an ongoing study, “Randomized Trial of Imaging Versus Risk Factor‐Based Therapy for Plaque Regression” (ClinicalTrials.gov identifier NCT01212900). The main inclusion criteria were age ≥55 years and an indication for lipid‐lowering therapy based on Adult Treatment Panel (ATP) III guidelines.17 Main exclusion criteria were contraindication for statin therapy, use of nonstatin lipid‐lowering therapy, and ineligibility for MRI scan. Of note, carotid artery stenosis or plaque was not an inclusion criterion.
Clinical information, including age, sex, smoking status, family history, prior diagnosis of hypertension (or hypertension medication, systolic blood pressure >145 mm Hg, or diastolic blood pressure >90 mm Hg on spot measurements), and blood analysis results (including LDL, high‐density lipoprotein, triglycerides, and creatinine), was collected at baseline and at 12‐month follow‐up. As part of the protocol, study visits, which included an interview regarding side effects and medication adherence (self‐reported), occurred at baseline and at 3, 6, 9, and 12 months. Statin doses were adjusted to attain prespecified LDL values (target LDL [<70, <100, or <130 mg/dL] was determined by ATP III guidelines17 or imaging result).
Image Acquisition
Carotid MRI was performed using techniques described previously.18 A 3‐T MRI scanner (Siemens Magnetom Verio; Siemens Medical Solutions) and a 4‐channel carotid artery phased array carotid coil (Machnet) were used for all participants. Isotropic 3‐dimensional time‐of‐flight noncontrast magnetic resonance angiography was performed to localize the carotid bifurcation and the internal carotid artery (repetition time 20 ms, echo time 3.5 ms, flip angle 18°).
Axial T1 and T2‐weighted black‐blood sequences (both with fat suppression) were acquired prior to the administration of intravenous contrast to determine arterial wall thickness. The slice locations included the proximal 10 mm of the internal carotid artery (5 slices with 2‐mm slice thickness, no slice gap) (Figure 1). In‐plane resolution was ≈0.5 mm. Black‐blood T1 scan parameters were as follows: repetition time 1 R‐R interval, echo time 23 ms, echo train length 5. In the same position, T2‐weighted axial slices with fat suppression were acquired in the same position as the black‐blood images (repetition time 2 R‐R intervals, echo time 76 ms, echo train length 8). Gadopentetate dimeglumine (Magnevist; Bayer) was administered at 0.1 mmol/kg and injected at a rate of 2 mL/s, and a contrast‐enhanced angiography of the carotid arteries was obtained. At 5 minutes after gadolinium administration, postcontrast T1 black‐blood sequences were acquired using the same slice positions and acquisition parameters as precontrast images, with the exception of the inversion time. Inversion times were reduced by 100 to 200 ms to compensate for the T1 shortening effect of blood after gadolinium administration.
Figure 1.
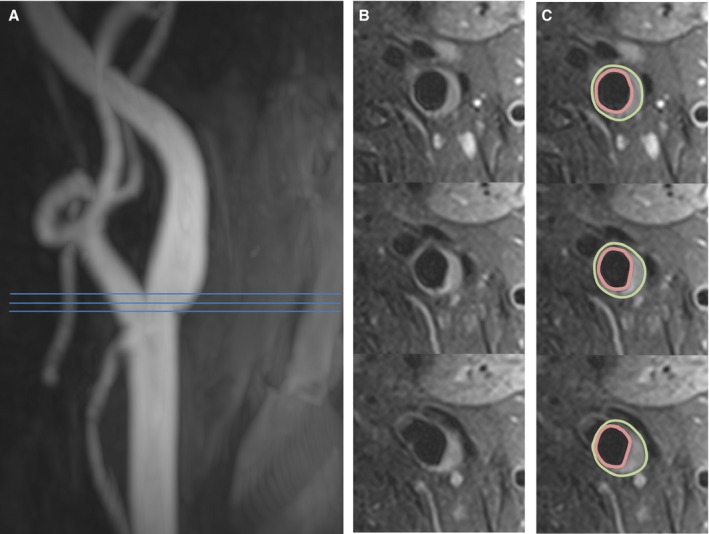
Assessment of carotid wall volume. A, Magnetic resonance angiography shows mild wall irregularity of the internal carotid artery. B, Representative axial slices show a region of wall thickening and plaque formation. C, The vessel boundaries were traced in multiple slices, and the volume was calculated. Three continuous axial slices are shown; 5 slices were acquired and analyzed to obtain the wall volume.
Noncontrast computed tomography was obtained at baseline for calcium scoring using the Agatston19 method (Aquilon ONE, 120 kV, 140 mA, 3‐mm slice thickness; Toshiba). In a subset of participants, a follow‐up calcium score scan was performed.
Image Analysis
Image analysis was performed using QPlaque 1.0.16 (Medis) (performed by V.S., a cardiologist with 5 years of experience in cardiovascular imaging). Images were analyzed blinded to the date of the MRI scan and the numerical volume results of the paired MRI scan. Images were aligned using the carotid bifurcation as a landmark. If severe deviation of the angle of the slices (defined as slice angle difference >20° between MRI examinations, measured in reference to the magnetic resonance angiogram) was seen during alignment, the participant was excluded from the study. The wall of the internal carotid artery was segmented by manually selecting the vessel borders. Total wall volume measurements were made on the T1 precontrast images unless image artifact was present, in which case the T2 or postcontrast images were used. Correct definition of wall border was carefully confirmed on T2 and postcontrast T1 images, in which any unsuppressed blood signal in the lumen typically showed variation on various sequences as opposed to carotid wall and atheroma, which showed consistent thickness on various sequences. Interscan reproducibility for carotid wall volume measurement at 3 T was assessed previously20 and is excellent (coefficient of variance 5.7%).
Statistical Methods
Statistical analysis was performed with SAS version 9.4 (SAS Institute) and R version 3.0.3 (R Foundation for Statistical Computing). Summary statistics for continuous variables are reported as means with standard deviations or medians with interquartile ranges. The mean value of the left and right carotid artery measurement was used for further analysis. The wall volume measurements were categorized as progression (change >0) or regression/no change (change ≤0).
The associations between clinical factors and carotid wall measurements were assessed with univariate analysis and multivariable logistic regression models. Atherosclerosis risk factors in model 1 (selected based on significant univariate associations) were obesity, statin dose, hypertension, and C‐reactive protein (CRP). Model 2 included model 1 covariates plus age and sex. The covariates were categorized using clinically accepted cut points (eg, obesity, high American Heart Association [AHA] risk status) or, if a generally accepted value was not available, at the median of the study population. In addition, a linear regression model was applied using percentage of carotid wall volume change as the dependent variable. Model 1 included covariates with significant associations in univariate analysis: obesity and hypertension. Model 2 included model 1 plus age, sex, and statin dose. We also stratified the body mass index (BMI) as normal weight (BMI >18.5 and ≤25), overweight (BMI >25 and ≤30), and obese (BMI >30). The P values reported are 2‐sided. P<0.05 indicated statistical significance. Participants with incomplete follow‐up data were excluded.
Results
Study Population Characteristics
Baseline and 12‐month follow‐up studies were available for quantitative analysis in 106 participants. Participant characteristics at baseline are shown in Table 1. The study population was predominantly male (63%). The median age was 65 years. No concurrent cerebrovascular disease was present. Relatively few participants had diabetes (10.4%) or a history of smoking (29%). The median BMI was 28. By BMI category, there were 25 (24%) normal‐weight, 54 (51%) overweight, and 27 (25%) obese participants. Hypertension was present in 51% of the participants, but blood pressure was reasonably well controlled (median systolic blood pressure 130 mm Hg, median diastolic blood pressure 72 mm Hg). The study population had a median Framingham risk score of 8%, indicating low to moderate risk. There were 4 cardiovascular events during the study (2 nonurgent coronary percutaneous coronary interventions, 1 diagnostic angiography for carotid artery aneurysm, and 1 elective surgery for aortic root aneurysm). Two of these events were actually symptom driven (non–acute coronary syndrome revascularization). This reflects the low‐ to moderate‐risk nature of the study population. Based on the inclusion criteria, all participants had an indication for lipid‐lowering therapy. The median equivalent statin dose at baseline was 40 mg simvastatin (based on equivalent doses21). LDL levels during the study were reduced to 50% of the prior untreated LDL level (calculated) (Figure 2). Median LDL, high‐density lipoprotein, and total cholesterol levels on treatment were 74, 56, and 157 mg/dL, respectively. Of note, there was more LDL reduction in obese participants compared with nonobese participants (baseline versus 12‐month LDL difference −32.2 versus −13.9 mg/dL, respectively; P=0.014). There was no correlation between baseline carotid wall volume and statin dose (P=0.324). There was no significant difference in triglycerides at baseline and at 1‐year follow‐up (median 111 versus 100 mg/dL, respectively).
Table 1.
Baseline Clinical Characteristics of Study Participants
| Variable | Result |
|---|---|
| Age, y | 65 (60–69) |
| Sex | |
| Male | 67 (63) |
| Female | 39 (37) |
| Race | |
| White | 89 (84) |
| Black | 8 (7.5) |
| Other | 9 (8.5) |
| Smoking (current or prior) | 31 (29) |
| Diabetes | 11 (10.4) |
| Hypertension | 54 (51.9) |
| Prior diagnosis of CAD | 10 (9.4) |
| Blood pressure | |
| Systolic mm Hg | 130 (121–136) |
| Diastolic mm Hg | 72 (67–80) |
| BMI | 28 (25–30) |
| Creatinine, mmol/L | 0.9 (0.8–1) |
| LDL, mg/dL | 94 (76–108) |
| Triglycerides, mg/dL | 111 (77–144) |
| CRP, mg/L | 0.95 (0.48–2.22) |
| Statin (simvastatin equivalent), median dose, mg | 40 (20–40) |
| Statin type, median dose | |
| Atorvastatin, 20 mg | 35 (33) |
| Simvastatin, 40 mg | 28 (26) |
| Pravastatin, 40 mg | 14 (13) |
| Rosuvastatin, 10 mg | 13 (12) |
| Lovastatin, 30 mg | 4 (4) |
| None | 12 (11) |
| Framingham CVD 10‐y risk, % | 8 (5–12) |
| AHA 10‐y risk, % | 11 (7–16) |
| Baseline calcium score (Agatston) | 74 (1–478) |
| Stroke/TIA within 6 months | 0 (0) |
Clinical baseline characteristics of the 106 study participants are shown as number (percentage) or as median (interquartile range). AHA indicates American Heart Association; BMI, body mass index; CAD, coronary artery disease; CRP, C‐reactive protein; CVD, cardiovascular disease; LDL, low‐density lipoprotein; TIA, transient ischemic attack.
Figure 2.

LDL cholesterol values at baseline and at 6 and 12 months. Statin‐naïve baseline values were calculated using the baseline LDL, statin dose, and expected LDL‐lowering effects.21 A, During the treatment protocol, a further decrease in LDL values occurred (*P<0.01). B, Of note, the LDL reduction was more pronounced in obese participants (yellow) compared with nonobese participants (green). BL indicates baseline; LDL, low‐density lipoprotein.
MRI Results
MRI examinations were excluded for 10 participants (9%, 4 normal‐weight, 4 overweight, and 2 obese participants based on BMI) according to predefined criteria, and this resulted in 106 participants with complete data. Considering all included participants, there was progression of atherosclerosis in 46 (43%) and regression/no change in 60 (57%). The distribution of wall volume change is shown in Figure S1A.
Univariate Analysis and Visualization
In univariate analysis, progression of atherosclerosis was positively associated with obesity (P=0.002), hypertension (P=0.03), and CRP (P=0.02), whereas there was an inverse relationship between progression and statin use (P=0.023) (categorized progression model in Table 2). Of note, CRP levels in obese participants were higher than in nonobese participants (median 1.84 versus 0.77 mg/L, respectively; P=0.00013 for correlation of CRP with BMI). No correlation was seen with other factors including the AHA 2013 risk score and baseline carotid wall volume (P>0.05).
Table 2.
Univariate and Multivariable Logistic Regression Models Showing the Association Between Clinical Characteristics and MRI‐Measured Progression of Carotid Wall Volume
| Categorized Progression Model | Continuous Progression Model | |||||||||||
|---|---|---|---|---|---|---|---|---|---|---|---|---|
| Univariate | Model 1 | Model 2 | Univariate | Model 1 | Model 2 | |||||||
| OR | P | OR | P | OR | P | Estimate | P | Estimate | P | Estimate | P | |
| Obesity | ||||||||||||
| BMI <30 (n=79) | 1 (Reference)a | |||||||||||
| BMI ≥30 (n=27) | 4.57 (1.83–12.38)a | 0.002a | 3.95 (1.49–11.28)a | 0.007a | 4.11 (1.52–11.99)a | 0.0067a | 6.422 (2.36)a | 0.008a | 5.60 (2.41)a | 0.022a | 5.29 (2.42)a | 0.031a |
| Statin dose, mg/day | ||||||||||||
| <40 (n=51) | 1 (Reference)a | |||||||||||
| ≥40 (n=55) | 0.40 (0.18–0.87)a | 0.023a | 0.42 (0.17–0.99) | 0.050 | 0.41 (0.17–0.98)a | 0.0487a | −0.013 (0.025) | 0.6 | −0.007 (0.024) | 0.776 | ||
| Hypertension | ||||||||||||
| No (n=52) | 1 (Reference)a | |||||||||||
| Yes (n=54) | 2.39 (1.10–5.33)a | 0.030a | 1.81 (0.76–4.40) | 0.182 | 1.97 (0.80–4.97) | 0.142 | 4.25 (2.08)a | 0.044a | 3.142 (2.10) | 0.137 | 3.63 (2.16) | 0.089 |
| CRP, mg/L | ||||||||||||
| <0.95 (n=53) | 1 (Reference)a | |||||||||||
| ≥0.95 (n=53) | 2.56 (1.17–5.73)a | 0.0a2 | 1.71 (0.71–4.14) | 0.231 | 1.5 (0.60–3.77) | 0.384 | 0.637 (0.344) | 0.066 | ||||
| Sex | ||||||||||||
| Women (n=39) | 1 (Reference) | |||||||||||
| Men (n=67) | 0.60 (0.27–1.34) | 0.213 | 0.62 (0.24–1.60) | −3.86 (2.17) | 0.078 | −3.97 (2.155) | 0.068 | |||||
| Age, y | ||||||||||||
| >65 (n=53) | 1 (Reference) | |||||||||||
| ≤65 (n=53) | 0.86 (0.40–1.85) | 0.695 | 0.69 (0.28–1.64) | −0.029 (0.176) | 0.870 | 0.015 (0.17) | 0.928 | |||||
| HDL, mg/dL | ||||||||||||
| >50 (n=66) | 1 (Reference) | |||||||||||
| ≤50 (n=40) | 0.94 (0.43–2.08) | 0.885 | −0.010 (0.050) | 0.84 | ||||||||
| TC, mg/dL | ||||||||||||
| >180 (n=51) | 1 (Reference) | |||||||||||
| ≤180 (n=55) | 0.75 (0.35–1.62) | 0.464 | 0.030 (0.02964) | 0.315 | ||||||||
| Smoking habit | ||||||||||||
| No (n=75) | 1 (Reference) | |||||||||||
| Yes (n=31) | 1.33 (0.57–3.10) | 0.506 | 1.502 (2.33) | 0.521 | ||||||||
| SBP, mm Hg | ||||||||||||
| ≤130 (n=57) | 1 (Reference) | |||||||||||
| >130 (n=49) | 0.65 (0.30–1.42) | 0.283 | 0.066 (0.076) | 0.384 | ||||||||
| AHA risk | ||||||||||||
| <7.5% (n=38) | 1 (Reference) | |||||||||||
| ≥7.5% (n=68) | 1.38 (0.62–3.12) | 0.435 | −0.0159 (0.130) | 0.903 | ||||||||
| LDL reduction | ||||||||||||
| >14.4% (n=53) | 1 (Reference) | |||||||||||
| ≤14.4% (n=53) | 0.73 (0.35–1.59) | 0.434 | 3.44 (4.57) | 0.453 | ||||||||
| Carotid wall volume, mm3 | ||||||||||||
| >192 (n=53) | 1 (Reference) | |||||||||||
| ≤192 (n=53) | 1 (0.46–2.16) | 1 | −0.0088 (0.0175) | 0.617 | ||||||||
Categorized progression model: Univariate and multivariable logistic regression models showing the association between clinical characteristics and MRI‐measured progression of carotid wall volume (categorized as progression or regression). In univariate analysis, obesity, high baseline statin dose, high CRP, and hypertension were associated with disease progression. In multivariable model 2 (including covariates of model 1 and age and sex), obesity (BMI ≥30) was significantly associated with progression, whereas higher statin dose was associated with regression. ORs are for progression of carotid wall volume. Covariates were collected at baseline. Model 1: obesity, statin dose, hypertension, CRP. Model 2: obesity, statin dose, hypertension, CRP, age, sex. Continuous progression model: Univariate and multivariable linear regression models showing the association between clinical characteristics and MRI progression of carotid wall volume modeled as percentage change from baseline. In univariate analysis, obesity and hypertension were associated with wall volume progression. In multivariate models (model 1 including obesity and hypertension and model 2 including significant covariates and the clinically relevant factors age, sex, and statin dose), only obesity remained significantly associated with wall volume progression. Covariates expressed as continuous variables: statin dose, CRP, age, HDL, total cholesterol, systolic blood pressure, AHA risk, LDL reduction, and carotid wall volume. AHA indicates American Heart Association; BMI, body mass index; CRP, C‐reactive protein; HDL, high‐density lipoprotein; LDL, low‐density lipoprotein; MRI, magnetic resonance imaging; OR, odds ratio; SBP, blood pressure; TC, total cholesterol..
P<0.05.
Obesity
The median percentage of change of carotid wall volume in participants with and without obesity was +4.8% and −4.2%, respectively (P<0.05) (Figure 3, upper row; Figure S1B). Among participants with obesity, 70% showed progression, whereas only 34% of nonobese participants showed progression (Figure 3, lower row; Table S1). To further explore the relationship between BMI and carotid disease progression, we stratified BMI as normal weight (BMI >18.5 and ≤25), overweight (BMI >25 and ≤30), and obese (BMI >30). Figure 4A shows the carotid volume change for each category. The carotid wall volume change in normal‐weight and overweight participants was negative (−4.2% and −3.5%, respectively), as opposed to the positive change (+4.8%, progression) in the obese group (P=0.045).
Figure 3.
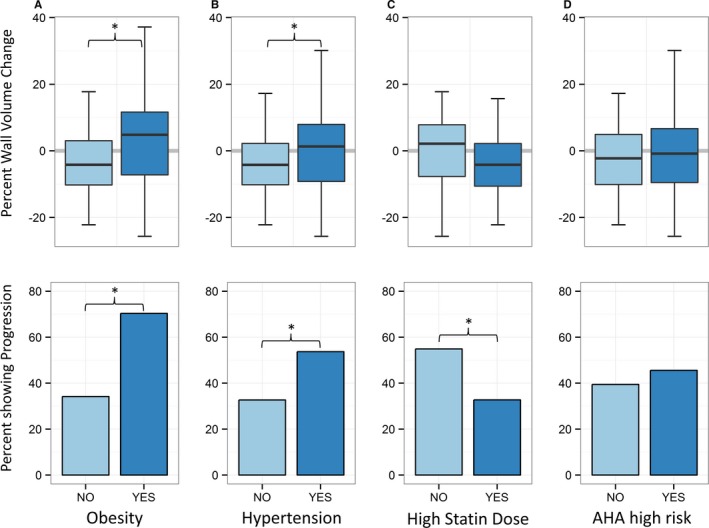
Upper row shows univariate comparisons of continuous carotid wall volume change. A, Change for participants with low BMI (light blue) vs high BMI (dark blue). B, Change in participants with (dark blue) and without (light blue) hypertension. C, Change in participants with a high statin dose (≥40 mg Simvastatin, dark blue) and low statin dose (light blue). D, Change in participants with an AHA risk <7.5% (light blue) or ≥7.5% (dark blue). Lower row shows corresponding percentages of participants experiencing progression of carotid wall volume (change >0). Obese and hypertensive participants had greater wall volume change and more frequently showed carotid artery disease progression (*P<0.05). AHA indicates American Heart Association; BMI, body mass index.
Figure 4.
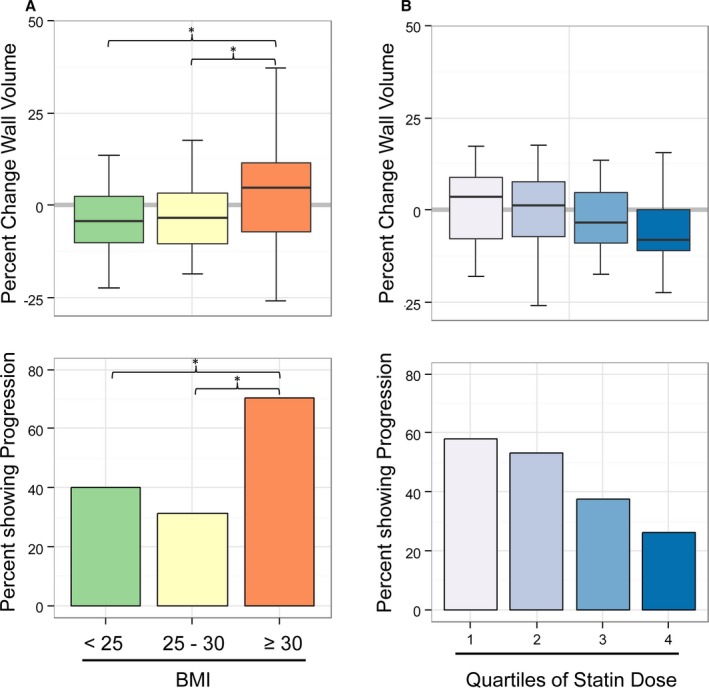
A, Change in carotid wall volume in normal‐weight, overweight, and obese participants. Obese patients showed wall volume increase (progression) opposed to normal‐weight and overweight participants (*P<0.05). B, Change in carotid wall volume in relation to quartiles of statin dose. There was a stepwise reduction in wall volume change with increasing dose (inverse correlation, P=0.038). BMI indicates body mass index.
Hypertension
The relative change of carotid wall volume in hypertensive and nonhypertensive participants was +1.3% and −4.2%, respectively (P=0.043). Of the hypertensive participants, 53.7% showed progression, whereas in the nonhypertensive participants, only 32.7% showed progression.
Statin dose
The median change of atheroma volume was −4.2% in participants on a higher statin dose (≥40 mg simvastatin or equivalent) versus +2.13% in participants on a lower dose (P=0.22). When categorized as progression or regression/no change, participants receiving a higher statin dose showed progression less frequently compared with participants on a lower statin dose (33% versus 55%, P=0.023). There was no significant association with the specific statin drug that was used (P>0.05). To visualize the relation between statin dose and change in carotid atheroma, the rate of change was plotted for each quartile of statin dose (Figure 4B, upper panel), and the percentage of participants with progression is shown (Figure 4B, lower panel). Figure 4B shows a stepwise reduction in progression with higher statin doses (inverse correlation, Kendall's τ, P=0.038).
Multivariable Analysis
In multivariable logistic models, the associations between increase in carotid wall volume (progression) and the parameters obesity and statin dose remained significant (P=0.007 and P=0.049, respectively), whereas other risk factors such as hypertension, age, sex, or LDL showed no significant association (categorized progression model in Table 2).
In addition, we performed a linear regression analysis using percentage of carotid wall volume change as the dependent variable (continous progression model in Table 2). In the univariate analysis, obesity and hypertension showed significant associations with carotid wall volume change. In the multivariable linear regression models, only obesity remained significantly associated (P=0.031).
Calcium Score Results
To provide additional context for the observations at the carotid artery, we also evaluated change in the CAC score. Of 106 participants, 82 (77%) had a nonzero calcium score at baseline (median CAC score 199). Follow‐up CAC was available for 73 participants, of which 90.4% showed an increased CAC score. The median rate of change of CAC was +13.5% per year. There was no association of change in CAC score with sex, age, obesity, or hypertension in univariate or multivariable models (P>0.05 for all comparisons).
Discussion
New guidelines for statin therapy indicate that nearly 50% of adults aged 40 to 75 years may be eligible for lifelong statin therapy22; however, the relationship between lipid reduction and change in atherosclerosis has been studied primarily in high‐risk patients undergoing repeated invasive coronary angiograms. In this study, we examined the progression of carotid atherosclerosis in a population with low to moderate Framingham risk who were eligible for statin therapy. Cholesterol levels were tightly controlled (on‐treatment LDL 74 mg/dL); however, 43% of participants showed progression of carotid atherosclerosis. In adjusted models, obesity was associated with atherosclerotic progression. Carotid MRI identified progression of atherosclerosis in obese participants despite optimal medical therapy and a greater reduction of LDL in obese versus nonobese participants.
Statin therapy has become a mainstay of preventive medicine. Despite an enormous amount of evidence showing that statin therapy can reduce cardiovascular events and may induce plaque regression, clinical experience shows that this protective effect is not present in all patients. The Heart Protection Study showed that simvastatin therapy was associated with an 18% reduction in cardiac death rate and a 24% reduction in cardiovascular events compared with placebo23; conversely, 76% of the cardiovascular events occurred despite statin therapy. IVUS studies have confirmed that statin treatment reduces the rate of atherosclerosis progression.11 A pooled analysis of 6 IVUS trials24 showed regression of atherosclerosis at the population level (median reduction of atheroma volume −2.4 mm3), but more than a third of participants had atheroma progression despite statin treatment. The results of IVUS studies for high‐risk participants have not been confirmed previously for lower risk study participants. Repeated cardiac catheterizations and IVUS are not possible for such patients because of ethical concerns.
In the current study, participants were not preselected for symptomatic carotid artery disease, received frequent monitoring of statin treatment with medications provided by the study protocol, and had relatively well‐controlled blood pressures. The median treatment level of LDL cholesterol was 74 mg/dL, corresponding to ≈50% reduction of pretreatment levels and indicating good drug compliance in a tightly controlled trial in which we had contact with study participants at 3‐month intervals. The associations of hypertension (univariate), CRP (univariate), and lower statin dose (in univariate and multivariable categorized models) with plaque progression were expected and corroborate the validity of the analysis. Despite good LDL cholesterol reduction, obesity remained a predictor of progression of atherosclerosis. The individual LDL response to statin therapy is well known to be variable: ≈20% of patients have diminished response to statin therapy.3 The majority of obese participants showed progression of carotid atherosclerosis even after adjustment for LDL cholesterol levels. Our noninvasive MRI results are in agreement an IVUS analysis, showing that obese participants had significantly more progression of coronary atherosclerosis compared with nonobese participants.25
In an analysis of >800 000 participants, obesity was associated with elevated mortality mainly due to cardiovascular causes.26 The underlying biological mechanisms are not fully clear yet.27 Obesity is a modifiable risk factor, and weight loss has beneficial effects on lipid profile and inflammation.28 A possible link among inflammation, obesity, and progression of atherosclerosis was also seen in our study, in which CRP levels in obese participants were significantly higher compared with nonobese participants, and CRP was associated with plaque progression in univariate analysis. It could be hypothesized that non‐LDL proatherogenic mechanisms like inflammation play a role in plaque progression in obese persons.
Our results are in line with prior reports of study participants with extensive carotid disease, showing that regression of carotid wall measurements during lipid‐lowering therapy can occur.12, 13 Table 3 provides an overview of prior studies.15, 29, 30 Many factors influence the overall changes in atherosclerosis including study population, prior statin therapy, and intensity of statin therapy. Our study included participants who were not selected for symptomatic carotid plaque, resulting in a mostly primary prevention population with relatively lower cardiovascular risk compared with prior studies. To our knowledge, this is the first noninvasive imaging study that has identified obesity as a factor in atherosclerosis progression in study participants receiving optimal medical therapy for hypercholesterolemia.
Table 3.
Prior Studies Using Magnetic Resonance Imaging for Serial Assessment of Carotid Atherosclerosis
| Study | N | Inclusion Criteria | Risk Characteristics | Design | Follow‐up, mo | Result Summary |
|---|---|---|---|---|---|---|
| Corti et al12 | 51 | Aortic or carotid plaque >2 mm, on statin | 30% current smoking, 19% diabetes | Prospective | 6, 12, 18, 24 | −14% at 1 year, −18.5% at 2 years |
| Saam et al29 | 74 | Carotid stenosis 50–79% | 69% hypertension, 17% diabetes, 48% CAD, 34% stroke | Prospective | 18 | +2.2% per year |
| Boussel et al16 | 108 | Carotid stenosis >50% | 24% diabetes, 82% hypertension, 34% prior stroke/TIA, 44% known CAD | Prospective, multicenter, 1.5 T | 12 | +7.9 per year (no statin), +1.14% per year (statin) |
| Migrino et al14 | 26 | Coronary or cerebrovascular disease and increased IMT | 58% CAD, 42% cerebrovascular disease | Prospective, 3 T | 6 | −5.8% at 6 months |
| Sibley et al13 | 145 | Prior cardiovascular event or >50% vessel stenosis | 22% diabetes, 51% angina, 11% stroke | Prospective, randomized | 6, 12, 18 | −6% to −8.4% per year |
| Takaya et al15 | 29 | Carotid stenosis 50–79% | 53.3% CAD, 33.3% diabetes, 80% hypertension | Prospective | 18 | +6.8% (hemorrhage), −0.15% (control) |
| Xu et al30 | 73 | Presence of disrupted surface and/or intraplaque hemorrhage | 46% CAD, 26% diabetes, 85% hypertension | Prospective | 36 | On average +2.2% per year |
| Present study | 106 | Indication for lipid therapy | 8% Framingham risk, 11% diabetes, 52% hypertension | Prospective | 12 | −1.3% per year |
CAD indicates coronary artery disease; IMT, intima‐media thickness; TIA, transient ischemic attack.
A limitation of this study is that longer duration of outcomes would be desirable. In relation to the effect size, the current sample size and the follow‐up time are limitations. We focused on therapeutic response as progression or regression of atherosclerosis, as an analogy to similar prior trials using IVUS. In addition, most participants received statin treatment prior to this study. As recently reviewed, high rates of statin use are now present in most clinical trials.31 The duration of prior statin use was not recorded. Prior use of statins may decrease the observed response of atheroma compared with statin‐naïve participants. Nevertheless, LDL values showed a significant reduction during the trial likely because of higher statin doses and good adherence to treatment. A separate control group was not considered to be feasible because all participants had clinical indication for statin therapy; each participant served as his or her own control in longitudinal analysis.
Conclusions
In summary, obesity was associated with progression of carotid atherosclerosis in a low‐ to moderate‐risk population treated with optimal statin therapy. Because LDL cholesterol levels were well controlled, our results suggest that serum cholesterol monitoring alone does not reflect changes in atheroma in obese or other high‐risk participants. The use of imaging to monitor atherosclerosis treatment may improve clinical outcomes and may be useful for providing more personalized medical therapy.
Sources of Funding
Funding was provided by the NIH intramural research program.
Disclosures
Dr Sibley is employed by MERCK. Dr Lima has a research agreement with Toshiba.
Supporting information
Table S1. Number of Participants Who Had Carotid Plaque Volume Increase (Progression) or Decrease/No Change (Regression) by Covariate Category
Figure S1. Percentage of change of carotid wall volume: histogram (left panel); density plot (right panel; red: nonobese participants; blue: obese participants).
(J Am Heart Assoc. 2016;5:e003621 doi: 10.1161/JAHA.116.003621)
References
- 1. Global, regional, and national age‐sex specific all‐cause and cause‐specific mortality for 240 causes of death, 1990–2013: a systematic analysis for the Global Burden of Disease Study 2013. Lancet. 2015;385:117–171. [DOI] [PMC free article] [PubMed] [Google Scholar]
- 2. Kajinami K, Akao H, Polisecki E, Schaefer EJ. Pharmacogenomics of statin responsiveness. Am J Cardiol. 2005;96:65K–70K; discussion 34K‐35K. [DOI] [PubMed] [Google Scholar]
- 3. Kataoka Y, St John J, Wolski K, Uno K, Puri R, Tuzcu EM, Nissen SE, Nicholls SJ. Atheroma progression in hyporesponders to statin therapy. Arterioscler Thromb Vasc Biol. 2015;35:990–995. [DOI] [PubMed] [Google Scholar]
- 4. Martin SS, Sperling LS, Blaha MJ, Wilson PWF, Gluckman TJ, Blumenthal RS, Stone NJ. Clinician‐patient risk discussion for atherosclerotic cardiovascular disease prevention importance to implementation of the 2013 ACC/AHA Guidelines. J Am Coll Cardiol. 2015;65:1361–1368. [DOI] [PMC free article] [PubMed] [Google Scholar]
- 5. Zavodni AE, Wasserman BA, McClelland RL, Gomes AS, Folsom AR, Polak JF, Lima JA, Bluemke DA. Carotid artery plaque morphology and composition in relation to incident cardiovascular events: the Multi‐Ethnic Study of Atherosclerosis (MESA). Radiology. 2014;271:381–389. [DOI] [PMC free article] [PubMed] [Google Scholar]
- 6. Polonsky TS, McClelland RL, Jorgensen NW, Bild DE, Burke GL, Guerci AD, Greenland P. Coronary artery calcium score and risk classification for coronary heart disease prediction. JAMA. 2010;303:1610–1616. [DOI] [PMC free article] [PubMed] [Google Scholar]
- 7. Jain A, McClelland RL, Polak JF, Shea S, Burke GL, Bild DE, Watson KE, Budoff MJ, Liu K, Post WS, Folsom AR, Lima JA, Bluemke DA. Cardiovascular imaging for assessing cardiovascular risk in asymptomatic men versus women: the Multi‐Ethnic Study of Atherosclerosis (MESA). Circ Cardiovasc Imaging. 2011;4:8–15. [DOI] [PMC free article] [PubMed] [Google Scholar]
- 8. Baber U, Mehran R, Sartori S, Schoos MM, Sillesen H, Muntendam P, Garcia MJ, Gregson J, Pocock S, Falk E, Fuster V. Prevalence, impact, and predictive value of detecting subclinical coronary and carotid atherosclerosis in asymptomatic adults: the BioImage study. J Am Coll Cardiol. 2015;65:1065–1074. [DOI] [PubMed] [Google Scholar]
- 9. Arad Y, Goodman KJ, Roth M, Newstein D, Guerci AD. Coronary calcification, coronary disease risk factors, C‐reactive protein, and atherosclerotic cardiovascular disease events: the St. Francis Heart Study. J Am Coll Cardiol. 2005;46:158–165. [DOI] [PubMed] [Google Scholar]
- 10. Raggi P, Davidson M, Callister TQ, Welty FK, Bachmann GA, Hecht H, Rumberger JA. Aggressive versus moderate lipid‐lowering therapy in hypercholesterolemic postmenopausal women: beyond endorsed lipid lowering with EBT scanning (BELLES). Circulation. 2005;112:563–571. [DOI] [PubMed] [Google Scholar]
- 11. Nissen SE, Tuzcu EM, Schoenhagen P, Brown BG, Ganz P, Vogel RA, Crowe T, Howard G, Cooper CJ, Brodie B, Grines CL, DeMaria AN. Effect of intensive compared with moderate lipid‐lowering therapy on progression of coronary atherosclerosis: a randomized controlled trial. JAMA. 2004;291:1071–1080. [DOI] [PubMed] [Google Scholar]
- 12. Corti R, Fuster V, Fayad ZA, Worthley SG, Helft G, Chaplin WF, Muntwyler J, Viles‐Gonzalez JF, Weinberger J, Smith DA, Mizsei G, Badimon JJ. Effects of aggressive versus conventional lipid‐lowering therapy by simvastatin on human atherosclerotic lesions: a prospective, randomized, double‐blind trial with high‐resolution magnetic resonance imaging. J Am Coll Cardiol. 2005;46:106–112. [DOI] [PubMed] [Google Scholar]
- 13. Sibley CT, Vavere AL, Gottlieb I, Cox C, Matheson M, Spooner A, Godoy G, Fernandes V, Wasserman BA, Bluemke DA, Lima JA. MRI‐measured regression of carotid atherosclerosis induced by statins with and without niacin in a randomised controlled trial: the NIA plaque study. Heart. 2013;99:1675–1680. [DOI] [PMC free article] [PubMed] [Google Scholar]
- 14. Migrino RQ, Bowers M, Harmann L, Prost R, LaDisa JF Jr. Carotid plaque regression following 6‐month statin therapy assessed by 3T cardiovascular magnetic resonance: comparison with ultrasound intima media thickness. J Cardiovasc Magn Reson. 2011;13:37. [DOI] [PMC free article] [PubMed] [Google Scholar]
- 15. Takaya N, Yuan C, Chu B, Saam T, Underhill H, Cai J, Tran N, Polissar NL, Isaac C, Ferguson MS, Garden GA, Cramer SC, Maravilla KR, Hashimoto B, Hatsukami TS. Association between carotid plaque characteristics and subsequent ischemic cerebrovascular events: a prospective assessment with MRI—initial results. Stroke. 2006;37:818–823. [DOI] [PubMed] [Google Scholar]
- 16. Boussel L, Arora S, Rapp J, Rutt B, Huston J, Parker D, Yuan C, Bassiouny H, Saloner D; Investigators M . Atherosclerotic plaque progression in carotid arteries: monitoring with high‐spatial‐resolution MR imaging—multicenter trial. Radiology. 2009;252:789–796. [DOI] [PMC free article] [PubMed] [Google Scholar]
- 17. Third report of the national cholesterol education program (NCEP) expert panel on detection, evaluation, and treatment of high blood cholesterol in adults (adult treatment panel III) final report. Circulation. 2002;106:3143–3421. [PubMed] [Google Scholar]
- 18. Wasserman BA, Smith WI, Trout HH III, Cannon RO III, Balaban RS, Arai AE. Carotid artery atherosclerosis: in vivo morphologic characterization with gadolinium‐enhanced double‐oblique MR imaging initial results. Radiology. 2002;223:566–573. [DOI] [PubMed] [Google Scholar]
- 19. Agatston AS, Janowitz WR, Hildner FJ, Zusmer NR, Viamonte M Jr, Detrano R. Quantification of coronary artery calcium using ultrafast computed tomography. J Am Coll Cardiol. 1990;15:827–832. [DOI] [PubMed] [Google Scholar]
- 20. Li F, Yarnykh VL, Hatsukami TS, Chu B, Balu N, Wang J, Underhill HR, Zhao X, Smith R, Yuan C. Scan‐rescan reproducibility of carotid atherosclerotic plaque morphology and tissue composition measurements using multicontrast MRI at 3T. J Magn Reson Imaging. 2010;31:168–176. [DOI] [PubMed] [Google Scholar]
- 21. FDA . Relative LDL‐lowering efficacy of statin and statin‐based therapies. Available at: http://www.fda.gov/Drugs/DrugSafety/ucm256581.htm. Accessed June 27, 2016.
- 22. Pencina MJ, Navar‐Boggan AM, D'Agostino RB, Williams K, Neely B, Sniderman AD, Peterson ED. Application of new cholesterol guidelines to a population‐based sample. N Engl J Med. 2014;370:1422–1431. [DOI] [PubMed] [Google Scholar]
- 23. MRC/BHF Heart Protection Study of cholesterol lowering with simvastatin in 20,536 high‐risk individuals: a randomised placebo‐controlled trial. Lancet. 2002;360:7–22. [DOI] [PubMed] [Google Scholar]
- 24. Nicholls SJ, Hsu A, Wolski K, Hu B, Bayturan O, Lavoie A, Uno K, Tuzcu EM, Nissen SE. Intravascular ultrasound‐derived measures of coronary atherosclerotic plaque burden and clinical outcome. J Am Coll Cardiol. 2010;55:2399–2407. [DOI] [PubMed] [Google Scholar]
- 25. Nicholls SJ, Tuzcu EM, Sipahi I, Schoenhagen P, Hazen SL, Ntanios F, Wun CC, Nissen SE. Effects of obesity on lipid‐lowering, anti‐inflammatory, and antiatherosclerotic benefits of atorvastatin or pravastatin in patients with coronary artery disease (from the REVERSAL Study). Am J Cardiol. 2006;97:1553–1557. [DOI] [PubMed] [Google Scholar]
- 26. Whitlock G, Lewington S, Sherliker P, Clarke R, Emberson J, Halsey J, Qizilbash N, Collins R, Peto R. Body‐mass index and cause‐specific mortality in 900 000 adults: collaborative analyses of 57 prospective studies. Lancet. 2009;373:1083–1096. [DOI] [PMC free article] [PubMed] [Google Scholar]
- 27. Lovren F, Teoh H, Verma S. Obesity and atherosclerosis: mechanistic insights. Can J Cardiol. 2015;31:177–183. [DOI] [PubMed] [Google Scholar]
- 28. Nicklas JM, Sacks FM, Smith SR, LeBoff MS, Rood JC, Bray GA, Ridker PM. Effect of dietary composition of weight loss diets on high‐sensitivity C‐reactive protein: the Randomized POUNDS LOST trial. Obesity (Silver Spring). 2013;21:681–689. [DOI] [PMC free article] [PubMed] [Google Scholar]
- 29. Saam T, Yuan C, Chu B, Takaya N, Underhill H, Cai J, Tran N, Polissar NL, Neradilek B, Jarvik GP, Isaac C, Garden GA, Maravilla KR, Hashimoto B, Hatsukami TS. Predictors of carotid atherosclerotic plaque progression as measured by noninvasive magnetic resonance imaging. Atherosclerosis. 2007;194:e34–e42. [DOI] [PMC free article] [PubMed] [Google Scholar]
- 30. Xu D, Hippe DS, Underhill HR, Oikawa‐Wakayama M, Dong L, Yamada K, Yuan C, Hatsukami TS. Prediction of high‐risk plaque development and plaque progression with the carotid atherosclerosis score. JACC Cardiovasc Imaging. 2014;7:366–373. [DOI] [PMC free article] [PubMed] [Google Scholar]
- 31. Colantonio LD, Bittner V, Reynolds K, Levitan EB, Rosenson RS, Banach M, Kent ST, Derose SF, Zhou H, Safford MM, Muntner P. Association of serum lipids and coronary heart disease in contemporary observational studies. Circulation. 2016;133:256–264. [DOI] [PMC free article] [PubMed] [Google Scholar]
Associated Data
This section collects any data citations, data availability statements, or supplementary materials included in this article.
Supplementary Materials
Table S1. Number of Participants Who Had Carotid Plaque Volume Increase (Progression) or Decrease/No Change (Regression) by Covariate Category
Figure S1. Percentage of change of carotid wall volume: histogram (left panel); density plot (right panel; red: nonobese participants; blue: obese participants).