

Abstract
Background
Early‐life reduction in nephron number (uninephrectomy [UNX]) and chronic high salt (HS) intake increase the risk of hypertension and chronic kidney disease. Adenosine signaling via its different receptors has been implicated in modulating renal, cardiovascular, and metabolic functions as well as inflammatory processes; however, the specific role of the A3 receptor in cardiovascular diseases is not clear. In this study, gene‐modified mice were used to investigate the hypothesis that lack of A3 signaling prevents the development of hypertension and attenuates renal and cardiovascular injuries following UNX in combination with HS (UNX‐HS) in mice.
Methods and Results
Wild‐type (A3 +/+) mice subjected to UNX‐HS developed hypertension compared with controls (mean arterial pressure 106±3 versus 82±3 mm Hg; P<0.05) and displayed an impaired metabolic phenotype (eg, increased adiposity, reduced glucose tolerance, hyperinsulinemia). These changes were associated with both cardiac hypertrophy and fibrosis together with renal injuries and proteinuria. All of these pathological hallmarks were significantly attenuated in the A3 −/− mice. Mechanistically, absence of A3 receptors protected from UNX‐HS–associated increase in renal NADPH oxidase activity and Nox2 expression. In addition, circulating cytokines including interleukins 1β, 6, 12, and 10 were increased in A3 +/+ following UNX‐HS, but these cytokines were already elevated in naïve A3 −/− mice and did not change following UNX‐HS.
Conclusions
Reduction in nephron number combined with chronic HS intake is associated with oxidative stress, chronic inflammation, and development of hypertension in mice. Absence of adenosine A3 receptor signaling was strongly protective in this novel mouse model of renal and cardiovascular disease.
Keywords: adenosine receptor, cardiovascular disease, high salt diet, inflammation, kidney, nephron number, NADPH oxidase, uninephrectomy
Subject Categories: Cardiovascular Disease, Fibrosis, Hypertension, Hypertrophy, Inflammation
Introduction
High blood pressure is a key contributor to the development of chronic kidney disease (CKD), which in turn can aggravate hypertension. Many epidemiological studies demonstrated that low nephron number and dietary high salt (HS) consumption are independent risk factors for chronic renal and cardiovascular disorders including hypertension.1 Because the kidneys play a pivotal role in maintaining water and electrolyte homeostasis, the impact of HS intake on elevating blood pressure may be greater in patients with reduced nephron endowment. We and others previously demonstrated that fetal, neonatal, or early‐age uninephrectomy (UNX) causes hypertension and kidney injuries in adult rats and ovine that are exaggerated if fed with a HS diet.2, 3, 4 Renal and cardiovascular anomalies in the rat model of UNX in combination with HS (UNX‐HS) were accompanied with increased preglomerular reactivity and abnormal renal autoregulation and are associated with increased oxidative stress, nitric oxide deficiency, and infiltration of inflammatory cells in the kidney.5, 6 Similar findings regarding nitric oxide deficiency and vascular dysfunction were also recently described in the sheep UNX model.7
Adenosine is a key ubiquitous signaling molecule that can be released on cellular damage or stress.8 The important roles of adenosine in modulating renal, cardiovascular, and metabolic functions were reviewed recently.9, 10, 11, 12 Modulation of adenosine signaling, especially via the A1 and A2 receptors, has been discussed as a novel therapeutic approach in different diseases.13, 14, 15 We and others previously demonstrated that adenosine is critically involved in modulation of renal autoregulatory functions through the A1, A2A, and A2B receptors, affecting renal function and blood pressure.16, 17, 18, 19 The role of adenosine A3 signaling in modulating renal and cardiovascular functions has rarely been discussed, at least in part because of suggested low tissue receptor expression. All adenosine receptor subtypes have been found in the kidney, but the relative expression of A3 in renal cortex is low.20 In agreement with findings by Hansen and colleagues, a recent report suggested rather high expression of the A3 receptor in microdissected and isolated renal arterioles.21 Moreover, high abundance of the A3 receptor has been demonstrated in immune cells, including dendritic cells and lymphocytes,15 and a role for the A3 receptor has been suggested in diseases involving inflammation (eg, ischemia reperfusion injury, pain, autoimmune diseases).22, 23 In addition, accumulating evidence demonstrates that the immune system is directly involved in the pathogenesis and development of both hypertension and CKD.24, 25, 26, 27
In the current study using UNX‐HS, which induces hypertension and CKD, we investigated the role of the adenosine A3 receptor. We hypothesized that abrogation of adenosine A3 receptor signaling could attenuate cardiovascular abnormalities and renal injuries in this model of hypertension through modulation of oxidative stress and inflammation. Using global gene–deleted mice, we demonstrated that adenosine signaling via the A3 receptor is involved in modulating renal and cardiovascular functions in this disease model.
Methods
Animals
The experiments were approved by our institutional review board (Stockholm Ethics Committee for Animal Experiments, protocols N139/15 and N314/12) and were conducted in accordance with the National Institutes of Health guidelines for the conduct of experiments in animals. Male and female wild‐type (A3 +/+, n=24) and adenosine A3 receptor gene knockout (A3 −/−, n=24) mice (equal sex distribution) from homozygous breeding pairs were used. Both genotypes were from C57/BJ6 background. Mice were housed under temperature‐ and humidity‐controlled conditions with a 12‐hour light/dark cycle. An overview of the experimental protocol in vivo is presented in Figure 1A.
Figure 1.
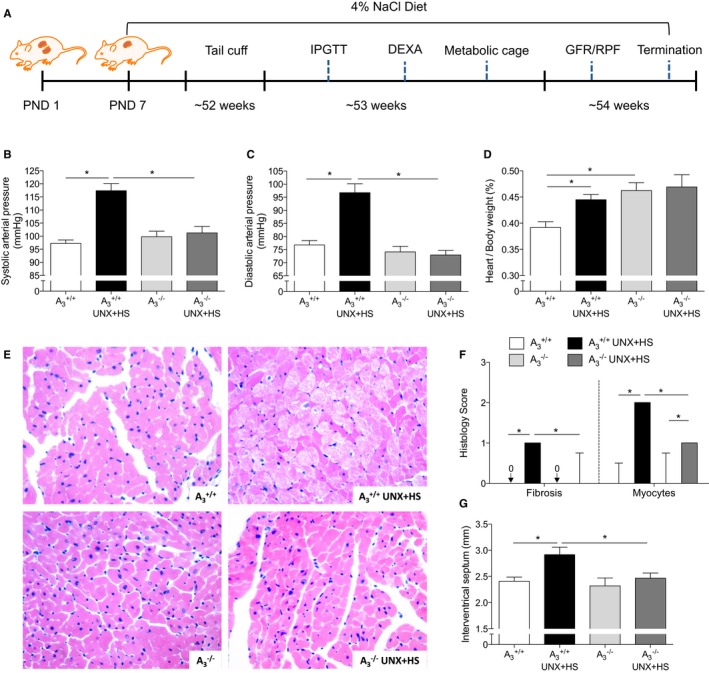
Blood pressure and heart histology. A, The protocol and timeline of experiments. UNX in combination with HS (UNX‐HS) significantly increased the systolic and diastolic arterial pressure in A3 +/+ but not in A3 −/− mice (B and C). 2×2 ANOVA revealed significant (P<0.0001) interaction (ie, effects of genotype on the response to UNX‐HS). UNX‐HS also increased the heart/body weight ratio in A3 +/+ mice; the A3 −/− mice had a higher baseline heart/body weight ratio compared with A3 +/+ mice but were not affected by UNX‐HS (D). Representative pictures of hematoxylin and eosin staining in the heart are shown in (E). The A3 +/+ mice showed significantly worse pathological changes in the heart following UNX‐HS, which was evaluated as fibrosis and myocyte histological scores (F). The thickness of the intraventricular septum was significantly increased in the A3 +/+ mice after UNX‐HS, but there were no changes in the A3 −/− group (G). Data are shown as mean±SEM, except in (F), in which results are presented as median and interquartile range. *P<0.05, n=8 to 12 per group. DEXA indicates dual‐emission x‐ray absorptiometry; GFR, glomerular filtration rate; HS, high salt; IPGTT, intraperitoneal glucose tolerance test; PND, postnatal day; RPF, renal plasma flow; UNX, uninephrectomy.
Model of Compromised Renal Function and Hypertension
On postnatal day 21, UNX was performed under inhalational isoflurane anesthesia (1.5–2%, Forene; Abbott Scandinavia AB). Buprenorphine (0.05 mg/kg; Schering‐Plough) was injected subcutaneously before the incision. The left kidney was removed, and 100 μL of 0.9% NaCl was given intraperitoneally before closing the abdomen. The body temperature of the mice was controlled at 37±0.5°C throughout the surgery using a heating lamp and a self‐monitored heating pad. The mice were fed with HS chow (4% NaCl; Lactamin) after the surgery until termination. Mice used as controls received standard rodent chow (0.7% NaCl; Lactamin).
Blood Pressure Measurement
At 52 weeks of age, blood pressure was measured using the Coda High Throughput Noninvasive Tail Monitoring System (Kent Scientific), following the manufacturer's protocol. Measurements were repeated daily for 5 days, and the average blood pressure was used for statistical analysis.
Glucose Tolerance Test
At 53 weeks of age, an intraperitoneal glucose tolerance test was performed at 2 pm following 6 hours of fasting. Mice received 30% d‐glucose (2 g/kg) intraperitoneally, and blood samples were collected from the tail at 0, 15, 30, 60 and 120 minutes, respectively, after injection. A portable glucose meter (FreeStyle Lite; Abbott Diabetes Care Inc) was used to measure the plasma glucose level.
Body Composition Determination
Mice were anesthetized with isoflurane, and fat and lean body masses were measured using dual‐emission x‐ray absorptiometry (GE Medical‐Lunar), as described previously.28
Urinary Protein Excretion and Osmolality
After completed dual‐emission x‐ray absorptiometry examination, all mice were trained in metabolic cages for 4‐hour periods to become familiar with this new environment and thus to reduce stress. After completed acclimatization, urine was collected during a 12‐hour period (from 8 pm to 8 am) with free access to water. The urine was then stored at −80°C before analysis. Urinary osmolality was determined by depression of the freezing point (Fiske 210 Micro‐Sample Osmometer; Fiske Associates), and the protein content was determined by the colorimetric method of Detergent Compatible Protein Assay (Bio‐Rad Laboratories). Plates were analyzed using a microplate reader (model Safire II; Tecan Austria) at 750‐nm absorbance.
Renal Plasma Flow and Glomerular Filtration Rate
At 54 weeks of age, renal plasma flow and glomerular filtration rate were determined in conscious mice by calculating the clearance of para‐amino hippuric acid and inulin, as described previously.29 In brief, premixed [14C]–para‐amino hippuric acid and [3H]–methoxy‐inulin (PerkinElmer) were injected via the tail vein, and blood samples were collected through the tail tip using heparinized capillary tubes at 1, 7, 15, 45, and 75 minutes following injection. Samples were centrifuged at 13 000g for 3 minutes at room temperature. Para‐amino hippuric acid and inulin concentrations in plasma were determined using liquid scintillation and the MicroBeta2 LumiJET 2460 Microplate Counter (PerkinElmer). Clearances were calculated using noncompartmental pharmacokinetic data analysis. Renal plasma flow was estimated from the para‐amino hippuric acid clearance using a renal extraction ratio of 0.7, as described previously.29
Mice Termination and Sample Harvests
Mice were anesthetized with isoflurane, and blood samples were collected through the inferior vena cava. Whole blood with 2 mmol EDTA (Sigma‐Aldrich) was centrifuged immediately at 4°C for 7 minutes (6000g). Mice were then perfused transcardially with 35 mL ice‐cold PBS, and heart and kidney were harvested and weighed. The transverse section of kidney including the renal hilum (≈3 mm) and the transverse section of the heart including both left and right ventricles were postfixed in 4% PBS‐buffered zinc‐formaldehyde (HistoLab Products AB) at 4°C. The remaining tissues were snap frozen in dry ice and stored at −80°C until analysis.
Primary Culture of Bone Marrow–Derived Macrophages
Bone marrow‐derived macrophages (BMDMs) from both A3 +/+ and A3 −/− mice were isolated and cultured. In brief, femoral and tibia bone marrow was collected, and single‐cell suspensions were prepared and cultured in DMEM (4.5 g/L glucose; Gibco, Life Technologies) supplemented with 20% heat‐inactivated FBS, 100 U/mL penicillin, 100 μg/mL streptomycin, 2 mmol l‐glutamine (all reagents from Life Technologies, Stockholm, Sweden) and 20% macrophage–colony‐stimulating factor–conditioned L929 cell line (ATCC collection) culture medium for 8 days. Cells were harvested using 2 mmol EDTA and seeded in 12‐well plates (1×10⁶ cells per well) in DMEM (4.5 g/L glucose, 10% FBS, 100 U/mL penicillin, 100 μg/mL streptomycin, and 2 mmol l‐glutamine). The resulting macrophages were then stimulated with 10 ng/mL lipopolysaccharide (LPS, derived from Escherichia coli endotoxin, 0111:B4) for 24 hours. Cells and culture medium were collected for different analyses.
Histological and Stereological Examination
After fixation, the kidney and heart were embedded in paraffin. Transverse sections (5‐μm thick) were cut and stained with hematoxylin and eosin, periodic acid‐Schiff, and picrosirius. A pathologist evaluated the renal and cardiac morphology/histology in a blinded manner, and the damage scores were calculated, essentially, as described previously.5, 29 In short, renal tissues were investigated for fibrosis, inflammation (ie, the extent of infiltrating inflammatory cells including plasma cells and lymphocytes), glomerular changes (ie, mesangial matrix increase, changes in glomerular basement membrane, sclerosis), and tubular changes (ie, atrophy, thickening of the tubular basal membrane, dilatation, and hyaline casts). The hearts were investigated for hypertrophy, myocyte appearance, and fibrosis. The evaluated tissues were given a score of 0 to 3 depending on the severity of change (0, normal histoarchitecture with no observable changes; 1, mild; 2, moderate; and 3, severe changes). The lowest score was given if the renal/cardiac histoarchitecture was normal, with no changes in any of the investigated parameters. The highest score represented major pathological changes with distortion of the normal histoarchitecture. For the hearts, the mean lengths of both left and right ventricular walls and the thickness of the septum were measured.2, 5
NADPH Oxidase–Mediated Superoxide Formation
To determine the superoxide production induced by NADPH oxidase (Nox), a chemiluminescence‐based technique was performed, as described previously.30 In brief, kidney cortex was homogenized with a Bullet Blender (Next Advance, Inc.) in ice‐cold PBS and centrifuged at 4°C for 20 minutes (2000g), and the supernatant was transferred into a reaction tube. BMDMs were incubated in 37°C Dulbecco's PBS for 20 minutes and collected by tituration. NADPH (100 μmol/L; Sigma‐Aldrich) and lucigenin (5 μmol/L; Sigma‐Aldrich) were added into the reaction tube containing tissue supernatant or BMDMs, and superoxide production was determined by measuring lucigenin chemiluminescence every 3 seconds for 3 minutes with an AutoLumat LB953 Multi‐Tube Luminometer (Berthold Technologies). Results were corrected by protein content determined with the Bradford protein assay (Bio‐Rad Laboratories).
Western Blotting
Kidneys were homogenized with a Bullet Blender in lysis buffer (10 mmol/L Tris‐HCl pH 8, 150 mmol/L NaCl, 5 mmol/L EDTA, 60 mmol/L N‐octyl glucoside, 1% Triton X‐100, and protease and phosphatase inhibitor cocktails; Sigma‐Aldrich), and BMDMs were harvested in the same lysis buffer using a cell scraper on ice. The lysates were centrifuged at 14 000g for 20 minutes, and protein concentration was determined by the Bradford protein assay. Protein extracts were denatured in sample loading buffer at 95°C for 5 minutes. Next, 20 µg of total protein was loaded into each lane and separated using 4% to 20% SDS‐PAGE (Bio‐Rad Laboratories), followed by electrotransfer to polyvinylidene difluoride membranes (Bio‐Rad Laboratories). Membranes were treated with blocking solution (5% nonfat dry milk, 20 mmol/L Tris base, 150 mmol/L NaCl, 0.1% Tween‐20, pH 7.6) and then incubated with primary antibodies gp91phox/Nox2 (BD Biosciences); p67phox (Cell Signaling/BioNordika); or p22phox, p47phox, or inducible nitric oxide synthase (iNOS; Santa Cruz Biotechnology) overnight at 4°C. The respective horseradish peroxidase–conjugated goat anti–rabbit or anti–mouse IgG (Santa Cruz Biotechnology) was used to detect the primary antibodies. To ensure equal protein loading, membranes were stripped using Restore PLUS Western Blot Stripping Buffer (Thermo Scientific) and, after blocking, reprobed with primary antibody against β‐actin (Santa Cruz Biotechnology) and anti–mouse IgG. The protein levels of β‐actin were used for normalization of expression levels of the respective target proteins. Protein bands were visualized by Clarity Western ECL Substrate (Bio‐Rad Laboratories), and intensities were quantified using densitometry (Image Lab software; Bio‐Rad Laboratories) and reported as relative optical density of the specific proteins. Original membranes used for the Western blot analysis are presented in Figure S1.
Real‐Time Polymerase Chain Reaction
The mRNA levels of Nox subunits (Nox1, Nox2, Nox4, p22phox, p47phox, and p67phox), iNOS, and adenosine receptors (A1, A2A, A2B and A3) in kidneys and BMDMs were quantitated by real‐time polymerase chain reaction, as described previously.30, 31 In brief, RNA was isolated by the RNeasy Mini Kit (Qiagen) and then reverse transcribed to cDNA using the High‐Capacity cDNA Reverse Transcription Kit (Life Technologies). The polymerase chain reaction was performed on an ABI 7500 Real‐Time PCR System using TaqMan Gene Expression Assays (for adenosine receptors) or Power SYBR Green Master Mix (Life Technologies) and gene‐specific primers (for Nox subunits and iNOS). The mRNA levels were normalized by β‐actin or GAPDH expression in the same sample (ΔCt), and results were expressed as fold changes to the A3 +/+ group. The information on primers and gene expression assays are given in Tables 1 and 2.
Table 1.
Sequences of Primers for Real‐Time Polymerase Chain Reaction
| Gene | Forward Primer (5′→3′) | Reverse Primer (5′→3′) |
|---|---|---|
| Nox1 | TCACGAGTGGGATGACCATAAGGGG | CTCGCTTCCTCATCTGCAATTCCAA |
| Nox2 | GCACCTGCAGCCTGCCTGAATT | TTGTGTGGATGGCGGTGTGCA |
| Nox4 | GGCTGGCCAACGAAGGGGTTAA | GAGGCTGCAGTTGAGGTTCAGGACA |
| p22phox | CTGGCGTCTGGCCTGATTCTCATC | CCGAAAAGCTTCACCACAGAGGTCA |
| p47phox | CAGCCATGGGGGACACCTTCATT | GCCTCAATGGGGAACATCTCCTTCA |
| p67phox | AAGACCTTAAAGAGCCTTGACGCA | TCGGACTTCATGTTGGTTGCCAA |
| iNOS | TGACGGCAAACATGACTTCAG | GCCATCGGGCATCTGGTA |
| ß‐actin | GCTCCTCCTGAGCGCAAT | GTGGACAGTGAGGCCAGGAT |
Table 2.
TaqMan Gene Expression Assays (Life Technologies)
| Gene | Name | Assay/Catalog Number |
|---|---|---|
| A 1 receptor | Adora1 | Mm01308023_m1 |
| A 2A receptor | Adora2A | Mm00802075_m1 |
| A 2B receptor | Adora2B | Mm00839292_m1 |
| A 3 receptor | Adora3 | Mm01296602_m1 |
| GAPDH | Mouse GAPDH endogenous control | 4352339E |
Liquid Chromatography–Tandem Mass Spectrometry
Plasma levels of arginine, citrulline, ornithine, asymmetric dimethylarginine (ADMA), symmetric dimethylarginine (SDMA), and creatinine were measured by high‐performance liquid chromatography–tandem mass spectrometry. Briefly, after thawing samples on ice, 25 μL of plasma were crashed with 225 μL of 0.2% formic acid in isopropanol containing the internal standards (N4‐arginine and d3‐creatinine). Afterward, samples were vortexed for 30 seconds and centrifuged at 8000g for 10 minutes. Finally, 5 μL of the supernatant were injected into the liquid chromatography–tandem mass spectrometry system. Separation was performed with an ACQUITY UPLC System using an Atlantis HILIC Silica 3‐μm (150×2.1 mm) column (Waters Corporation). Mobile phases consisted of 0.2% formic acid in acetonitrile:methanol (75:25) and 0.2% formic acid in water. The flow rate was set at 400 μL/min. Detection was performed using a Waters Xevo TQ triple quadrupole equipped with an Electrospray Ion Source working in positive mode. For quantification, the following selected reaction monitoring transitions were used: arginine (175.1→70.1), ornithine (133.1→70.1), citrulline (176.1→70.1), ADMA (203.1→46.0), SDMA (203.1→172.1), N4‐arginine (179.1→71.1), and creatinine (114.0→86.0) or the internal standard d3‐creatinine (117.0→89.0).
Urine samples collected over 12 hours in metabolic cages were analyzed for levels of oxidative stress markers. Two different isoprostane species were quantified: 8,12‐iso‐iPF2α‐VI and 2,3‐dinor‐8‐iso PGF2α, which is the urinary excreted metabolite of 8‐isoprostane (8‐iso PGF2α). In total, 300 µL of urine was extracted and quantified by liquid chromatography–tandem mass spectrometry. Fortified laboratory urine reference material was used as a quality control to ensure reproducibility of quantitation within the study. Reproducibility for all reported compounds was within the accepted range according to the quality controls.
Cytokines, Markers of Metabolic Function and Oxidative Stress, and Angiotensin II
The inflammatory cytokines (interferon γ, tumor necrosis factor α, interleukin 1β [IL‐1β], IL‐6, IL‐12, keratinocyte chemoattractant/human growth‐regulated oncogene, and IL‐10) in plasma, kidney, and BMDM culture medium were detected using a Mouse Proinflammatory 7‐Plex Ultra‐Sensitive Kit (MesoScale Discovery). Kidneys were homogenized in Tris‐lysis buffer (150 mmol/L NaCl, 20 mmol/L Tris, 1 mmol/L EDTA, 1 mmol/L EGTA, 1% Triton X‐100, pH 7.5) with 1% BSA (Sigma‐Aldrich) using a Bullet Blender. Protein levels in the supernatant were quantified with a Bradford protein assay (Bio‐Rad Laboratories), and 50 μg protein was loaded for analysis. The plasma metabolic markers (total glucagon‐like peptide 1, glucagon, insulin, and leptin) were detected with MSD MULTI‐SPOT 96‐well, 4‐spot prototype Mouse Metabolic Kit (MesoScale Discovery), and plasma adiponectin levels were detected with the Adiponectin Mouse ELISA kit (ab108785; Abcam). Urine samples, obtained from metabolic cages, were analyzed for the oxidative stress marker 8‐hydroxy‐2‐deoxyguanosine (8‐OH‐dG) using the DNA/RNA Oxidative Damage ELISA Kit (589320; Cayman). Circulating levels of angiotensin II (Ang II) were analyzed by the Angiotensin II EIA Kit (RAB0010; Sigma‐Aldrich).
Flow Cytometric Analysis
Single‐cell suspensions were prepared from spleens by gentle dissociation through a 70‐µm cell strainer in cold RPMI medium, and red blood cells were removed by lysis with ACK buffer. Immune cells in the kidneys were isolated by dissociation of tissue pieces in RPMI with collagenase/hyaluronidase (Stemcell Technologies) using a GentleMACS dissociator (Miltenyi Biotech) in 3 consecutive cycles with 30‐minute incubation at 37°C in between, after which cells were strained through a 70‐µm cell strainer. CD45 (BD Biosciences) and CD11b, CD11c, and H2iab (all from BioLegend) were used for flow cytometric analysis. Viability was assessed with LIVE/DEAD Fixable Blue Dead Cell Stain Kit (Life Technologies). The Foxp3/Transcription Factor Staining Buffer Set (eBioscience) was used for intracellular staining, according to the manufacturer's instructions. Data were acquired on an LSRFortessa II (BD Biosciences) and analyzed with FlowJo X 10.0.7r2 software (FlowJo LLC).
During data analysis, live single cells were first selected based on viability dye stain and FSC‐A versus FSC‐H characteristics, respectively. Leukocytes were selected by CD45 expression and population gating performed based on light scatter characteristics and lineage marker expression.
BMDMs were harvested from mice perfused with ice‐cold PBS (Sigma‐Aldrich). Cells were stained with antibodies specific for CD86, programmed death ligands 1 and 2, CD206, and isotype controls (BD Biosciences) to determine the activation phenotypes in response to LPS. Samples were run in a Gallios flow cytometer (Beckman Coulter) and analyzed using Kaluza v1.1 software (Beckman Coulter). Marker expression was quantified using mean fluorescence intensity of the marker of interest.
Statistical Analysis
Single comparisons between normally distributed parameters were tested for significance using the Student paired or unpaired t test, as appropriate. For multiple group comparisons, 1‐ or 2‐way ANOVA followed by the Holm‐Sidak post hoc test was used. Scored data for the histological evaluation was analyzed by the nonparametric Kruskal–Wallis test followed by the Mann–Whitney U test, and results are presented as median and interquartile range. All statistical calculations were made using GraphPad Prism (version 6.0b; GraphPad Software). Values, except for histology, are presented as mean±SEM. Statistical significance was defined as P<0.05.
Results
At the time of termination, there were no differences in body weight among the 4 experimental groups (ie, A3 +/+, 34.6±1.3 g; A3 +/+ UNX‐HS, 36.2±1.6 g; A3 −/−, 36.3±1.1 g; A3 −/− UNX‐HS, 33.2±1.4 g).
Blood Pressure and Cardiac Pathologies
Baseline blood pressures were similar between genotypes (Figure 1B and 1C). UNX‐HS increased both systolic and diastolic arterial pressures as well as the heart/body weight ratio in A3 +/+ mice, but these parameters were not affected in A3 −/− mice (Figure 1B–1D). UNX‐HS induced morphological changes in cardiomyocytes, and this was more pronounced in A3 +/+ mice compared with A3 −/− (Figure 1E and 1F). Measurement of the interventricular septum also showed hypertrophy induced by UNX‐HS in A3 +/+ mice but not in A3 −/− mice (Figure 1G).
Kidney Function and Renal Pathologies
Clearance of [14C]–para‐amino hippuric acid and [3H]–methoxy‐inulin showed that UNX‐HS significantly decreased glomerular filtration rate in both A3 +/+ and A3 −/− mice (Figure 2A); however, after UNX‐HS, the renal plasma flow decreased only in the A3 +/+ mice (Figure 2B) but maintained at baseline level in A3 −/− mice. In addition, UNX‐HS significantly increased plasma creatinine and proteinuria only in the A3 +/+ mice (Figure 2C and 2D); however, compensatory renal hypertrophy, as indicated by the kidney/body weight ratio, was increased to a similar extent after UNX‐HS in both genotypes (Figure 2F). Although the hematoxylin and eosin staining revealed multiple pathological changes in both genotypes after UNX‐HS, all of these changes were significantly less pronounced in the A3 −/− mice compared with the A3 +/+ mice (Figure 2E and 2G).
Figure 2.
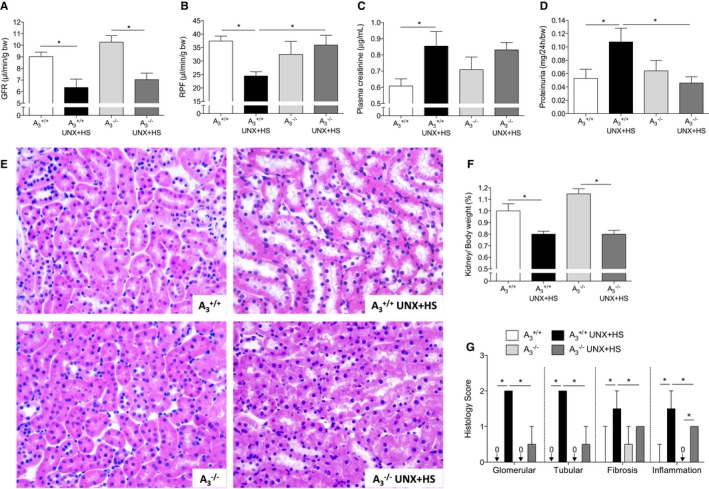
Renal function and histology. UNX in combination with HS (UNX‐HS) caused significant reduction of GFR in both genotypes (A), but RPF was reduced only in A3 +/+ mice (B). 2×2 ANOVA did not reveal any interaction (ie, effects of genotype on the response to UNX‐HS) for GFR, but significant (P<0.0001) interaction was found for RPF. Plasma creatinine and proteinuria were significantly increased after UNX‐HS in A3 +/+ mice but were not changed in A3 −/− mice (C and D). Urinary protein excretion after UNX‐HS was also significantly lower in A3 −/− mice compared with A3 +/+ mice (D). UNX‐HS induced multiple renal histopathological changes in both genotypes, but these were more pronounced in the A3 +/+ mice after UNX‐HS compared with A3 −/− mice (G). Representative pictures of hematoxylin and eosin staining in the kidney are shown in (E). Kidney weight are similar between genotypes both at baseline and after UNX‐HS (F). Data are shown as mean±SEM, except in (G), in which results are presented as median and interquartile range. *P<0.05, n=8 to 12 per group. GFR indicates glomerular filtration rate; HS, high salt; RPF, renal plasma flow; UNX, uninephrectomy.
Oxidative Stress in the Kidney
UNX‐HS significantly increased Nox‐mediated superoxide () generation and the Nox2 protein level in A3 +/+ but not in A3 −/− mice (Figure 3A–3C). Nox2, p22phox, and p47phox mRNA expression increased significantly after UNX‐HS in A3 +/+ mice (Figure 3E, 3G, and 3H). Nox1, Nox4, and p67phox expression were not significantly influenced by UNX‐HS in either genotype (Figure 3D, 3F, and 3I); however, after UNX‐HS, Nox1 and p67phox expression in A3 −/− mice trended lower (Figure 3D and 3I), whereas Nox4 was significantly higher than in A3 +/+ mice (Figure 3F).
Figure 3.
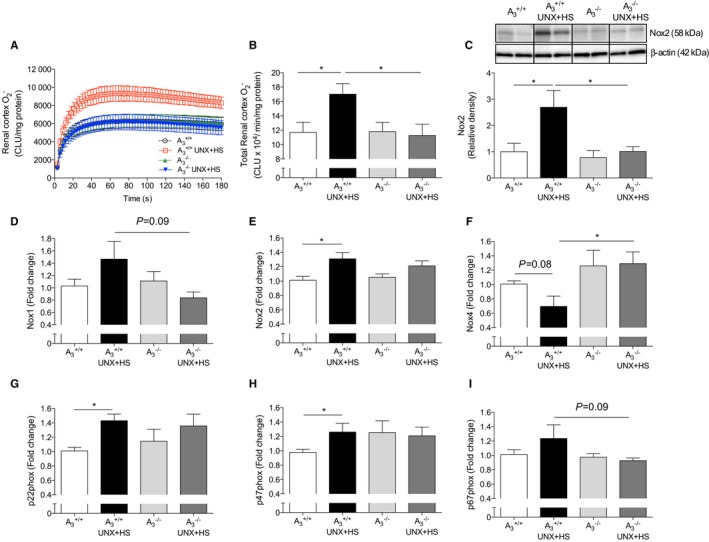
Nox activity and expression in kidney. Nox‐derived generation and Nox2 protein level were significantly increased in the renal cortex in A3 +/+ mice after UNX in combination with HS (UNX‐HS), but none of these were changed following UNX‐HS in the A3 −/− mice (A–C). UNX‐HS associated with increased mRNA expressions of Nox2, whereas Nox1 and Nox4 were not significantly changed in A3 +/+ mice (D–F). p22phox and p47phox expression were increased in A3 +/+ mice but not in the A3 −/− mice following UNX‐HS (G and H). No significant changes in p67phox were observed, although expression trended higher in A3 +/+ compared with A3 −/− mice after UNX‐HS (I). Data are shown as mean±SEM, *P<0.05, n=8 to 12 per group. CLU indicates chemiluminescence unit; HS, high salt; Nox, NADPH oxidase; UNX, uninephrectomy.
Markers of Oxidative Stress and NOS Activity
Oxidative stress can affect endogenous nitric oxide bioavailability and vice versa. Urinary excretion of the oxidative stress markers 8‐OH‐dG, 8,12‐iso‐iPF2α‐VI, and its metabolite 2,3‐dinor‐8‐iPF2α were all increased in A3 +/+ mice after UNX‐HS but were not changed in A3 −/− mice (Figure 4A–4C). Arginine metabolism assay using liquid chromatography–tandem mass spectrometry to evaluate NOS (citrulline/arginine ratio) and arginase (ornithine/arginine ratio) activities showed that, interestingly, A3 −/− mice had lower citrulline/arginine and ornithine/arginine ratios at baseline compared with A3 +/+ mice (Figure 4D and 4E). A3 −/− mice displayed higher citrulline/arginine ratios after UNX‐HS, and the ornithine/arginine ratio decreased in A3 +/+ mice after UNX‐HS. The dimethylarginines ADMA and SDMA are considered as endogenous inhibitors of NOS‐dependent nitric oxide generation, namely, ADMA directly inhibits NOS enzyme activity, whereas SDMA can attenuate NOS activity by limiting substrate availability. Both ADMA and SDMA levels were lower in naïve A3 −/− compared with A3 +/+ mice (Figure 4F and 4G). In addition, the SDMA level after UNX‐HS in A3 −/− mice was significantly lower compared with A3 +/+.
Figure 4.
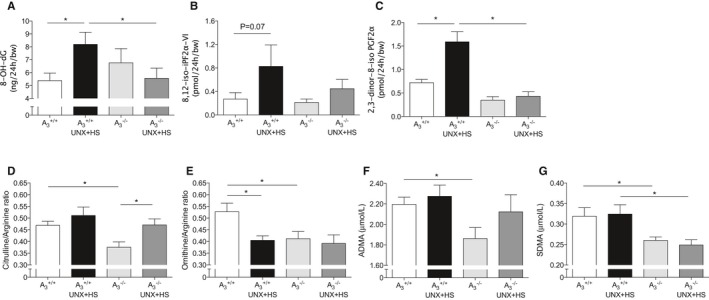
Plasma markers of oxidative stress and nitric oxide synthase activity. Urinary excretion of the oxidative stress markers 8‐OH‐dG (A), 8,12‐iso‐iPF2α‐VI (B), and its metabolite 2,3‐dinor‐8‐iso iPF2α (C) were increased in A3 +/+ mice after UNX in combination with HS (UNX‐HS) but were not significantly changed in the A3 −/− mice. UNX‐HS caused significant increase of plasma citrulline/arginine ratio in A3 −/− mice (D) and significant reduction of plasma ornithine/arginine ratio in A3 +/+ mice only (E). Baseline levels of both citrulline/arginine and ornithine/arginine ratios were lower in the A3 −/− mice compared with A3 +/+ mice. A3 −/− mice had significantly lower plasma ADMA and SDMA levels (F and G). Although UNX‐HS did not influence circulating ADMA and SDMA levels, the SDMA level after UNX‐HS was significantly lower in A3 −/− compared with A3 +/+ mice. Data are shown as mean±SEM, *P<0.05, n=8 to 12 per group. ADMA indicates asymmetric dimethylarginine; HS, high salt; SDMA, symmetric dimethylarginine; UNX, uninephrectomy.
Glucose Disposal and Abdominal Fat Content
To investigate whether UNX‐HS could induce metabolic alterations in addition to high blood pressure, an intraperitoneal glucose tolerance test and body composition analysis were performed. No differences in blood glucose clearance were observed in the naïve mice of either genotype; however, glucose clearance in the A3 +/+ UNX‐HS mice was reduced at both 30 and 60 minutes compared with naïve A3 +/+ mice, and UNX‐HS did not affect glucose disposal in the A3 −/− mice (Figure 5A and 5B). Even though UNX‐HS increased abdominal fat accumulation and total body fat in both genotypes, the A3 −/− mice had significantly less abdominal and total body fat content compared with A3 +/+ both at baseline and after UNX‐HS (Figure 5C and 5D). Plasma glucagon‐like peptide 1, insulin, and leptin levels were significantly increased after UNX‐HS in A3 +/+ but not in A3 −/− mice (Figure 5E–5G). Moreover, insulin and leptin levels after UNX‐HS in A3 −/− were significantly lower than in A3 +/+ mice. No differences in glucagon level were observed between groups (Figure 5H). Circulating adiponectin levels, which are typically decreased in metabolic diseases, trended toward decrease in A3 +/+ UNX‐HS mice but toward increase in A3 −/− UNX‐HS mice compared with the respective naïve mice (Figure 5I).
Figure 5.
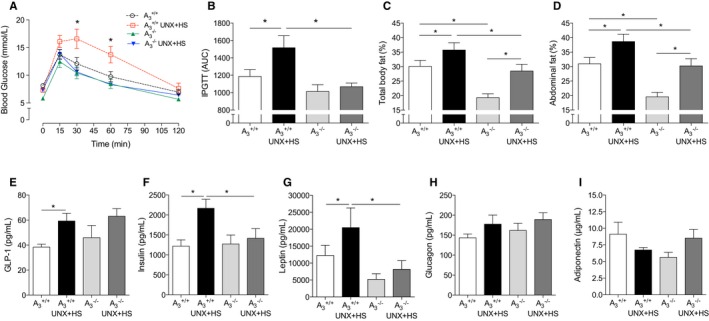
Glucose handling, fat content, and metabolic markers in plasma. UNX in combination with HS (UNX‐HS) significantly impaired glucose clearance ability in the A3 +/+ mice but not in the A3 −/− mice (A and B). 2×2 ANOVA revealed significant (P<0.05) interaction (ie, effects of genotype on the response to UNX‐HS) for the glucose tolerance responses. Although fat content increased in both genotypes after UNX‐HS, the A3 −/− mice showed significantly less total body fat content and abdominal fat content at both baseline and after UNX‐HS compared with A3 +/+ mice (C and D). GLP‐1, insulin, and leptin levels in the A3 +/+ mice were significantly increased after UNX‐HS, but the levels of these metabolic hormones were not changed with UNX‐HS in the A3 −/− mice (E–G). Insulin and leptin were also significantly lower in the A3 −/− UNX‐HS mice compared with A3 +/+ UNX‐HS mice (F and G). No significant differences in circulating glucagon were observed (H). Adiponectin levels trended toward being reduced in A3 +/+ mice but increased in A3 −/− mice after UNX‐HS (I). Data are shown as mean±SEM, *P<0.05, n=8 to 12 per group (A–D), n=8 to 10 per group (E–I). AUC indicates area under the curve; GLP‐1, glucagon‐like peptide 1; HS indicates high salt; IPGTT, intraperitoneal glucose tolerance test; UNX, uninephrectomy.
Systemic Inflammation
UNX‐HS significantly increased levels of both plasma inflammatory cytokines (IL‐1β, IL‐6, and IL‐12 p70) and anti‐inflammatory cytokine (IL‐10) in A3 +/+ mice (Figure 6A–6D). Interestingly, compared with naïve A3 +/+ mice, naïve A3 −/− mice had significantly higher levels of IL‐1β, IL‐6, and IL‐10; however, UNX‐HS did not affect the circulating cytokine levels in A3 −/− mice.
Figure 6.
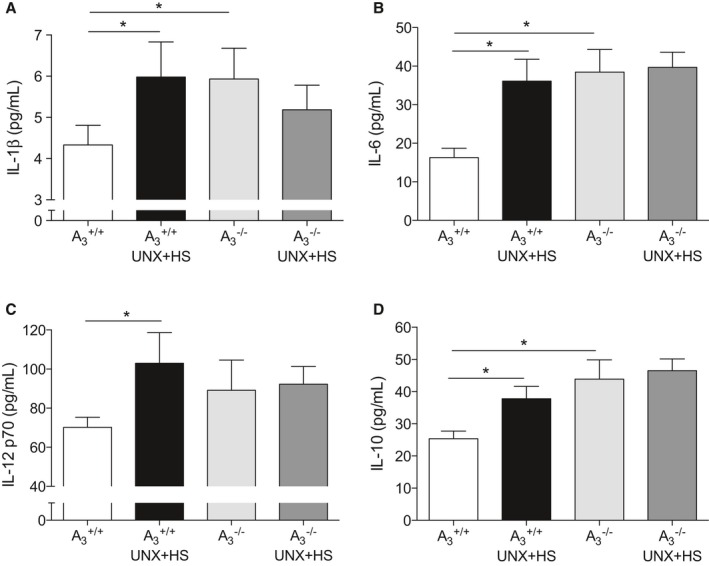
Systemic cytokines. Plasma IL‐1β, IL‐6, IL‐12, and IL‐10 levels were all significantly increased after UNX in combination with HS (UNX‐HS) in the A3 +/+ mice (A–D). UNX‐HS did not affect plasma cytokines levels in A3 −/− mice; however, A3 −/− mice had significantly higher baseline IL‐1β, IL‐6, and IL‐10 compared with A3 +/+ mice. Data are shown as mean±SEM, *P<0.05, n=8 to 12 per group. HS indicates high salt; IL, interleukin; UNX, uninephrectomy.
Immune Cell Populations
Using flow cytometric analysis, we distinguished the immune cell populations in the spleen and kidney in naïve A3 +/+ and A3 −/− mice. A3 −/− mice had significantly lower H2iab+ cells in both kidney CD11b and CD11c populations compared with A3 +/+ mice (Figure 7A and 7B).
Figure 7.
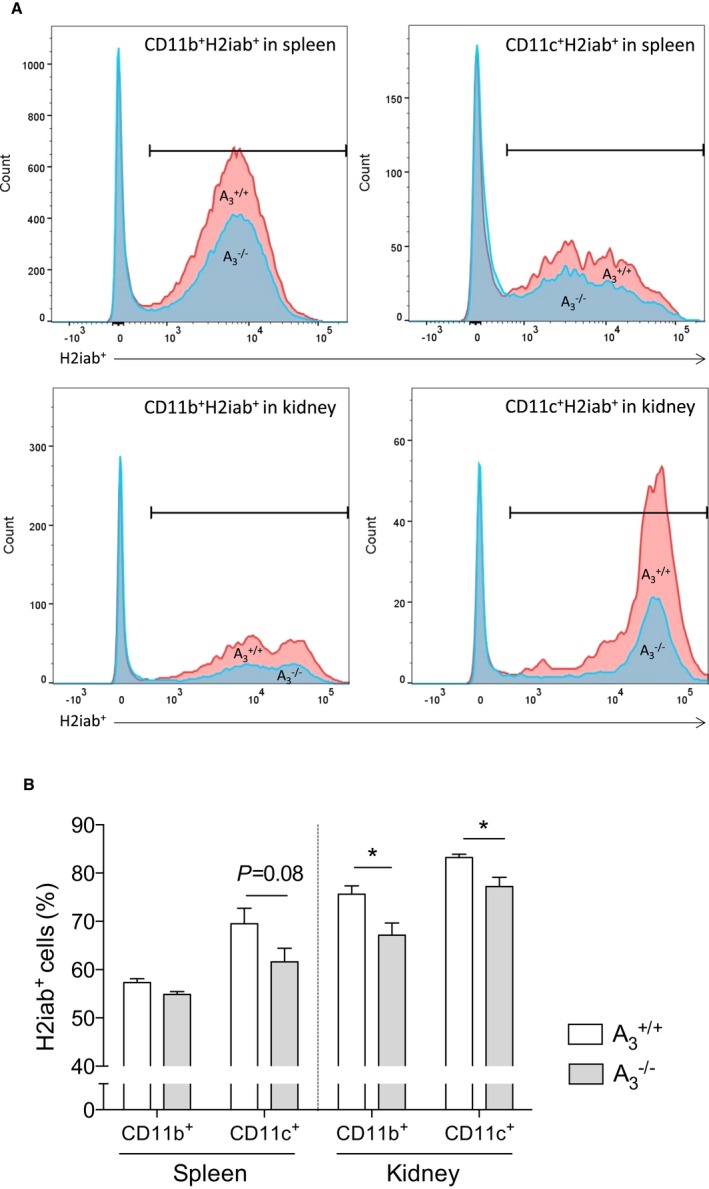
Antigen‐presenting cells in the kidney. A, The gating of the cell population. In kidneys from A3 −/− mice, there was significant less proportion of major histocompatibility complex class II (H2iab+) cells in both CD11b+ macrophages and CD11c+ dendritic cells compared with those from A3 +/+ mice (B). Data are shown as mean±SEM, *P<0.05, n=9 per group. HS indicates high salt; UNX, uninephrectomy.
BMDM Phenotypes
BMDMs were studied to further understand the phenotype and function of the macrophages from A3 +/+ and A3 −/− mice. After stimulating with 10 ng/mL LPS for 24 hours, BMDMs from A3 −/− mice had significantly higher Nox‐mediated generation compared with BMDMs from A3 +/+ mice (Figure 8A and 8B). Both M1 (programmed death ligand 1, CD86) and M2 (programmed death ligand 2) surface markers were significantly higher in the BMDMs from A3 −/− mice than from A3 +/+ mice following stimulation (Figure 8C). Western blot showed that A3 −/− mice had significantly higher Nox2, p22phox, and p47phox levels in BMDMs compared with A3 +/+ mice after LPS treatment (Figure 8D and 8E). In addition, LPS‐stimulated BMDMs from A3 −/− mice secreted significantly higher levels of IL‐1β, IL‐12 and keratinocyte chemoattractant/human growth‐regulated oncogene but a lower level of IL‐10 compared with cells from A3 +/+ mice (Figure 8F–8I). LPS stimulation was associated with significantly higher nitrite levels in the cell culture medium from both genotypes (Figure 8J). Interestingly, the nitrite level in the A3 −/− BMDM culture medium was significantly lower compared with A3 +/+ following LPS stimulation. Moreover, the iNOS mRNA (Figure 8K) and protein (Figure 8L and 8M) levels in stimulated A3 −/− BMDMs were significantly lower than in stimulated A3 +/+ BMDMs.
Figure 8.
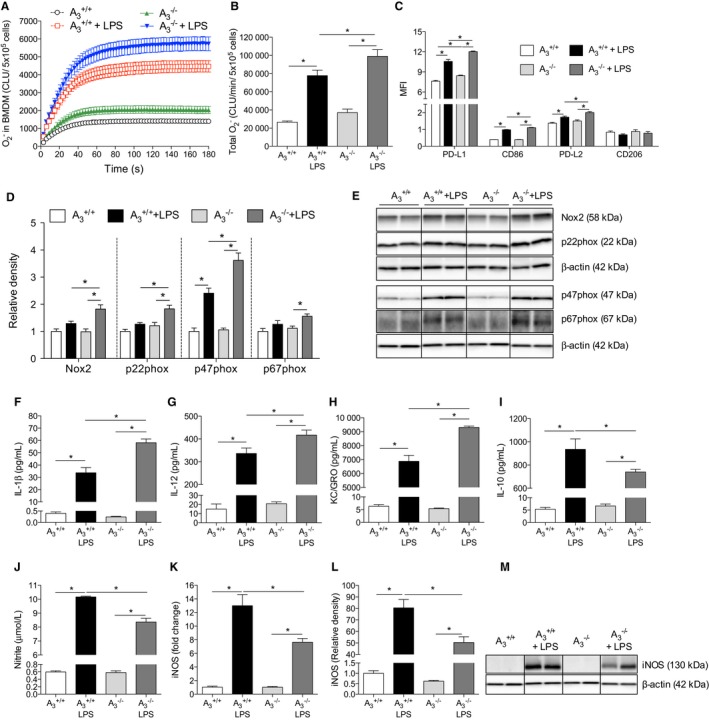
Bone marrow‐derived macrophages. NADPH oxidase‐derived production was significantly increased in the BMDMs following 24 hours of LPS stimulation (10 ng/mL), with this increase being greater in A3 −/− BMDMs (A and B). As indicated by MFI, both M1 markers (PD‐L1 and CD86) and M2 marker (PD‐L2) were significantly increased after LPS stimulation in both genotypes (C). Moreover, cells from A3 −/− expressed higher surface markers after LPS compared with A3 +/+. No differences of CD206 level were observed between groups. LPS significantly increased Nox2, p22phox, and p67phox protein levels in A3 −/− BMDMs but not in the A3 +/+ cells (D and E). The p47phox protein was increased in both genotypes following LPS stimulation; however, after LPS stimulation, the Nox2, p22phox, and p47phox levels were significantly higher in cells from A3 −/− mice than from A3 +/+ mice. The IL‐1β, IL‐12, KC/GRO, and IL‐10 levels in the cell culture medium were significantly increased after LPS stimulation (24 hours) in both genotypes, but the cytokine levels of IL‐1β, IL‐12, and KC/GRO were significantly higher in BMDMs from A3 −/− compared with A3 +/+ mice (F–I). Nitrite levels in the culture medium were significantly increased in both genotypes following LPS stimulation (J); however, nitrite was significantly lower in the A3 −/− group compared with the A3 +/+ group. In agreement with the nitrite levels, both mRNA (K) and protein levels (L and M) of iNOS showed similar patterns. Data are shown as mean±SEM, *P<0.05, n=6 per group (A and B), n=4 to 5 per group (C–J), n=3 to 6 per group (K–M). BMDM indicates bone marrow‐derived macrophage; CLU, chemiluminescence unit; IL, interleukin; iNOS, inducible nitric oxide synthase; KC/GRO, keratinocyte chemoattractant/human growth‐regulated oncogene; LPS, lipopolysaccharide; MFI, mean fluorescence intensity; Nox2, NADPH oxidase 2; PD‐L, programmed death ligand.
Discussion
In the present study, we developed and validated a clinically relevant mouse model of compromised renal function and cardiovascular disease. Specifically, we investigated the role of adenosine A3 receptor signaling in the pathogenesis of UNX‐HS–induced hypertension and end‐organ damage. Several studies have suggested important roles of adenosine A1 and A2 receptors in modulating renal, cardiovascular, or metabolic functions9, 10, 11, 12, 32; however, specific knowledge about A3 signaling from in vivo studies has been hampered by lack of potent and selective adenosine receptor antagonists. Using receptor gene‐modified mice, our study provides the first evidence that adenosine A3 receptor signaling contributes to the development of UNX‐HS–induced hypertension and renal and cardiac injuries. Our data do not exclude the possibility that the observed differences between genotypes are secondary to the differences in blood pressure rather than being the direct consequence of the absence of the A3 receptor. We propose, however, that modulation of Nox‐derived oxidative stress and immune cell function via A3 receptor signaling may be critical mechanisms in the development of hypertension and associated end‐organ damage.
We demonstrated previously that development of hypertension and renal dysfunction in HS‐fed rats with reduced nephron number are closely associated with oxidative stress, nitric oxide deficiency, and progressive inflammation.2 In this study, we report that UNX at early age followed by chronic HS intake in mice resembled many of the key features of the UNX‐HS rat model.2, 5, 6 Wild‐type mice with UNX‐HS had elevated blood pressure and displayed histopathological signs of renal injuries associated with elevated plasma creatinine and proteinuria levels as well as cardiac pathologies such as hypertrophy, fibrosis, and abnormal myocyte appearance. Remarkably, adenosine A3 −/− mice with UNX‐HS were protected from development of hypertension and displayed fewer renal and cardiac pathologies. Although it is well appreciated that reduced renal mass and HS consumption lead to higher risk of hypertension and CKD, the mechanisms are still not fully understood. Factors including oxidative stress,5 nitric oxide deficiency,6, 7 abnormal vasoconstriction,7 and impaired sodium handling in the kidney33 have been implicated. In this study, we found that UNX‐HS is associated with increased renal Nox activity, which was associated with higher Nox2 protein and mRNA expression of Nox subunits. These changes were not observed in A3 −/− mice, and that was consistent with a link to the renal and cardiovascular outcomes in this model. Consequently, our data suggest that Nox‐derived is a key factor causing pathological changes to the kidney. Many epidemiological studies have validated the relationship between CKD and cardiovascular risk in patients.34 In our UNX‐HS model, hypertension and other cardiac pathologies in wild‐type mice may also be complications associated with chronic kidney damage. Once hypertension has been established, elevated blood pressure per se may accelerate the pathological events and create a vicious cycle.
Lankadeva and colleagues recently demonstrated that reduced nitric oxide bioavailability was associated with renal dysfunction following UNX in sheep.7 Dimethylarginines ADMA and SDMA are considered endogenous inhibitors of NOS‐dependent nitric oxide generation, and elevated plasma levels have been proposed as independent risk factors in patients with cardiovascular disease,35 possibly contributing to the development of hypertension in patients with renal disease.36 In contrast to what was observed in rats with UNX‐HS,5, 6 we did not detect any changes in plasma ADMA and SDMA levels after UNX‐HS in mice. Nevertheless, A3 −/− mice showed lower baseline ADMA and SDMA levels and lower SDMA after UNX‐HS compared with A3 +/+ mice. Although further investigations would be required, this finding suggests that absence of A3 signaling may affect NOS activity by decreasing the levels of those endogenous inhibitory compounds.
Ang II is an important modulator of blood pressure and renal function. In our study, naïve A3 −/− mice display slightly higher Ang II levels compared with A3 +/+ mice. Interestingly, reduced renal mass and treatment with dietary HS was associated with reduced Ang II levels in A3 −/− mice, but circulating Ang II was not suppressed in the A3 +/+ mice with UNX‐HS (Figure S2). Increased expression or activation of the Ang II receptor type 1 is linked with hypertension and oxidative stress. Because mRNA expression of all 3 Ang II receptors (AT1A, AT1B and AT2) was similar between groups in our study (Figure S3), it seems unlikely that differential AT receptor activation between the genotypes plays a key role in disease development in this model. Moreover, interaction between Ang II and adenosine A1 or A2 receptor signaling on the renal arterioles modulates nitric oxide and bioavailability,9, 37 which has been reported to influence renal hemodynamics during health and in the progression of renal, cardiovascular, and metabolic disorders.16, 17, 18, 28, 38 Less is known about the A3 receptor, although a recent study21 suggested a modulatory role in renal microcirculation. Recent studies also reported that increased adenosine signaling might directly contribute to hypertensive disorders.39, 40 In our study, quantitative receptor expression analysis did not reveal any differences in the relevant adenosine receptors among the groups (Figure S3). This demonstrates that the phenotypes following UNX‐HS, and between genotypes, were not attributable to changes in the other adenosine receptors.
In both experimental and clinical studies of hypertension, Nox‐mediated oxidative stress is often associated with activation of the immune system. In addition, the role of immune cells and inflammation in the pathogenesis of hypertension has been increasingly appreciated.25 Elevated adenosine levels have been demonstrated during various pathological conditions and, together with increased proinflammatory cytokines via an autocrine pathway, may increase cellular signaling via the A3 receptor. In our model, hypertensive UNX‐HS wild‐type mice presented higher plasma levels of IL‐1β, IL‐6, IL‐12p70, and IL‐10, together with renal inflammation. Interestingly, A3 −/− mice had significantly higher baseline levels of circulating pro‐ and anti‐inflammatory cytokines, which can already be observed at early age (Figure S4); however, the A3 −/− mice displayed only minor inflammation and organ dysfunction in the renal and cardiovascular systems following UNX‐HS. Moreover, UNX‐HS did not induce further changes in systemic cytokine levels in A3 −/−. These data suggest an upregulated immune system homeostasis in mice when the A3 receptors were absent. Cytokines are a double‐edged sword in health and disease. Excessive inflammation can lead to tissue damage, whereas a balance between pro‐ and anti‐inflammatory cytokines helps restore organ function and fight pathogenic stimuli. The fact that A3 −/− mice were resistant to UNX‐HS–induced renal and cardiac pathologies suggested that the elevated immune homeostasis might prevent the development of chronic inflammation and organ injuries in A3 −/− mice. In addition to the elevated circulating levels of cytokines, the primary BMDM cultures from A3 −/− mice revealed a normal or even augmented response to LPS stimulation compared with macrophages from A3 +/+ mice, as indicated by Nox activation, cytokine release, and increased expression of cell surface markers. Interestingly, in contrast to the markers described, the amount of nitrite arising from LPS‐activated A3 −/− BMDMs was significantly lower compared with cells from A3 +/+, indicating less iNOS activation. Indeed, LPS stimulation was associated with significantly lower iNOS mRNA and protein levels in A3 −/− BMDMs. These data suggest that the nitric oxide generation via iNOS from A3 −/− BMDMs under stimulation may be reduced, leading to decreased production of nitric oxide–associated cytotoxic molecules (eg, peroxynitrite) when bone marrow–origin macrophages are recruited into the stressed or injured organs. In addition to the bone marrow–origin macrophages, differences in the constitutive innate immune cell populations in the A3 −/− mouse kidneys were also observed in our study. Although the number of resting macrophages and dendritic cells in the kidney were similar between genotypes (data not shown), the A3 −/− kidneys contained a significantly lower percentage of antigen‐presenting dendritic cells (CD11c+ major histocompatibility complex class II+ cells) and macrophages (CD11b+ major histocompatibility complex class II+ cells), which are vital for T cells to recognize the antigens and to initiate the downstream immune reactions, including the release of cytokines into the circulation. The reduced antigen‐presenting cell population in the A3 −/− kidney might contribute to the fact that A3 −/− mice are more resistant to UNX‐HS–induced inflammation and subsequent CKD and hypertension. This finding is in agreement with previous work that demonstrated the important roles of T cells in renal injury41 and hypertension.24
Taken together, our data suggest that when mice lacking A3 receptors are challenged with UNX‐HS, the “upregulated” immune system reacts to the pathogenic changes in the kidney (ie, oxidative stress, tubular glomerular cells damage), and the innate immune cells then clear harmful components and restore tissue structure and function in a rapid and more efficient way. Because A3 −/− mice have a lower percentage of antigen‐presenting cells in the kidney at baseline level, the downstream immune reaction cascade may be less exacerbated in the A3 −/− kidneys. We propose that these alterations in both innate and adaptive immune systems in A3 −/− mice may help eliminate pathological changes in the renal and cardiovascular systems after UNX‐HS and further protect A3 −/− mice from developing hypertension (Figure 9).
Figure 9.
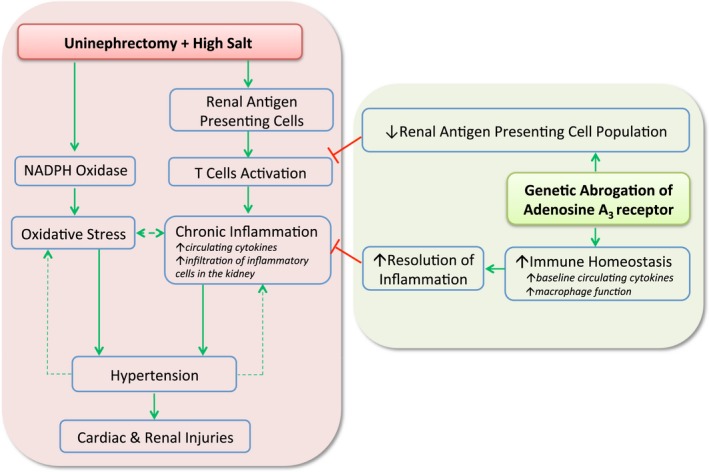
Proposed mechanisms contributing to a protective renal and cardiovascular phenotype in adenosine A3 knockout mice following reduction in nephron number at early age and chronic feeding with high salt diet. Early age reduction of nephron number (UNX) combined with an HS diet (UNX‐HS) induces hypertension, which is associated with increased renal oxidative stress and inflammation in wild‐type mice. Our study demonstrates that gene‐modified mice lacking the adenosine A3 receptor are protected from the development of hypertension and organ injuries in this chronic model of renal and cardiovascular disease. Mechanistically, we proposed a novel role of the A3 receptors in modulating immune system development and homeostasis, which affects the ability to fight chronic inflammation and oxidative stress during conditions of renal and cardiovascular disease. Red lines denote inhibition or negative feedback, whereas the green arrows represent stimulation of a particular response. The dashed green arrows indicate a vicious cycle once hypertension is established, contributing to oxidative stress and progressive inflammation as well as accelerated renal and cardiac injuries following UNX‐HS. HS indicates high salt; UNX, uninephrectomy.
Some studies have reported that adenosine A3 receptors may provide cardiac protective effects, especially during ischemia–reperfusion injury42, 43, 44; however, when similar models were applied to A3 −/− mice, A3 receptor deficiency exerted protective effects against organ injuries45, 46 and ventricular hypertrophy.47 Lee and colleagues have demonstrated that A3 −/− mice, or wild‐type mice with an A3 antagonist, were protected from ischemia‐ or myoglobinuria‐induced renal failure.48 Based on our data, the absence of A3 receptors may influence immune system development in mice from early life. This may, at least in part, explain the paradoxical effects of A3 receptors reported in previous studies.
Renal disease is commonly described as a complication of metabolic syndrome; however, recent studies suggest that compromised renal function may not only contribute to hypertension but also antecede metabolic dysfunction with abnormal insulin and glucose regulation.49 In the present study, UNX‐HS in wild‐type mice was associated with worse metabolic phenotype, as demonstrated by reduced glucose clearance and increased visceral adipose tissue, and with elevated levels of circulating insulin and leptin. Interestingly, none of these metabolic abnormalities were observed following UNX‐HS in A3 −/− mice. Metabolic disorders are reported to be associated with adipose inflammation.50 Considering that UNX‐HS did not further increase levels of circulating cytokines in A3 −/− mice and that the inflammatory changes in heart and kidney in A3 −/− mice after UNX‐HS were also less severe compared with A3 +/+ mice, the ameliorated metabolic phenotypes in A3 −/− mice after UNX‐HS may be due to the limited systemic progressive inflammatory responses systemically and in the adipose tissue.
The interesting phenotype of A3 −/− mice having different immune homeostasis and being resistant to UNX‐HS–induced CKD and hypertension warrants future investigations. In the current study, we did not constantly monitor renal function and blood pressure following UNX‐HS, and that led to difficulties in determining the exact sequence of events regarding the development of hypertension and renal and cardiac injuries. Consequently, our data do not exclude the possibility that some observed differences after UNX‐HS (eg, systemic and renal oxidative stress and inflammation) are secondary to the differences in blood pressure between genotypes. Nevertheless, the upregulated circulating cytokine levels and different immune cells function/populations in the naïve A3 −/− mice are nonnegligible. A long‐term study relating renal and cardiovascular functions to, for example, cytokines and other aspects of immune homeostasis are required to definitely pinpoint the causal sequences and the pathogenesis of UNX‐HS–induced CKD and hypertension. The present data suggest that such studies in wild‐type and A3 −/− mice may be particularly valuable.
Perspectives
Our study demonstrated that gene‐modified mice lacking the adenosine A3 receptor are protected from the development of hypertension and organ injuries in a disease model induced by early age reduction in renal mass (UNX) and chronic HS consumption. Mechanistically, we proposed a novel role of the A3 receptors in modulating immune system development and homeostasis that affects the ability to fight chronic inflammation and oxidative stress during conditions of renal and cardiovascular disease (Figure 9). This study provided new insights about the novel role of adenosine A3 signaling in the pathogenesis of hypertension that may have important clinical implications.
Sources of Funding
This work was supported by grants from the Swedish Research Council (521‐2011‐2639, Carlström, K2009‐64X‐03522, Persson), the Swedish Heart and Lung Foundation (20110589, 20140448), Jeanssons Foundation (JS2013‐00064), the Swedish Society of Medical Research (SSMF), Stockholm City Council (ALF) and by Internal Karolinska Institutet funding for doctoral education (KID).
Disclosures
None.
Supporting information
Figure S1. Western blot membranes. Less cropped images of all Western blot membranes for the kidney (A) and BMDMs (B, C) are presented together with the molecular weight (MW) of each protein and the MW size marker. For BMDMs (B, C), membranes were cut after the transfer step according to MW of target proteins to enable detection of different proteins in the same samples. BMDM indicates bone marrow‐derived macrophages; HS, high salt; LPS, lipopolysaccharide; UNX, uninephrectomy.
Figure S2. Plasma angiotensin II (Ang II) levels. Circulating Ang II was higher in naïve aged adenosine A3 receptor knockout mice (A3 −/−) compared with naïve age‐matched wild‐type controls (A3 +/+). UNX combined with HS was associated with suppressed Ang II levels in the A3 −/−, whereas no change was observed in the A3 +/+ mice. Data are shown as mean±SEM, n=8 to 12 per group. HS indicates high salt; UNX, uninephrectomy.
Figure S3. Angiotensin II and adenosine receptors in kidney. No differences of angiotensin AT1A, AT1B, and AT2 receptors (A–C) and adenosine A1, A2A, and A2B receptors (D–F) were observed between groups. Data are shown as mean±SEM, n=4 to 5 per group. HS indicates high salt; UNX, uninephrectomy.
Figure S4. Systemic cytokines in young mice. Plasma levels of interleukin (IL) 1β (A), IL‐6 (B), IL‐12 (C), and IL‐10 (D) were all significantly increased in naïve adenosine A3 receptor knockout mice aged 10 to 12 weeks (A3 −/−) compared with naïve age‐matched wild‐type controls (A3 +/+). Data are shown as mean±SEM, *P<0.05, n=7 to 9 per group.
Acknowledgments
We thank Carina Nihlén, Annika Olsson and Margareta Stensdotter (Karolinska Institutet, Stockholm) for technical assistance.
(J Am Heart Assoc. 2016;5:e003868 doi: 10.1161/JAHA.116.003868)
References
- 1. Luyckx VA, Brenner BM. Birth weight, malnutrition and kidney‐associated outcomes—a global concern. Nat Rev Nephrol. 2015;11:135–149. [DOI] [PubMed] [Google Scholar]
- 2. Carlstrom M, Sallstrom J, Skott O, Larsson E, Persson AE. Uninephrectomy in young age or chronic salt loading causes salt‐sensitive hypertension in adult rats. Hypertension. 2007;49:1342–1350. [DOI] [PubMed] [Google Scholar]
- 3. Moritz KM, Wintour EM, Dodic M. Fetal uninephrectomy leads to postnatal hypertension and compromised renal function. Hypertension. 2002;39:1071–1076. [DOI] [PubMed] [Google Scholar]
- 4. Woods LL, Weeks DA, Rasch R. Hypertension after neonatal uninephrectomy in rats precedes glomerular damage. Hypertension. 2001;38:337–342. [DOI] [PubMed] [Google Scholar]
- 5. Carlstrom M, Persson AE, Larsson E, Hezel M, Scheffer PG, Teerlink T, Weitzberg E, Lundberg JO. Dietary nitrate attenuates oxidative stress, prevents cardiac and renal injuries, and reduces blood pressure in salt‐induced hypertension. Cardiovasc Res. 2011;89:574–585. [DOI] [PubMed] [Google Scholar]
- 6. Carlstrom M, Brown RD, Yang T, Hezel M, Larsson E, Scheffer PG, Teerlink T, Lundberg JO, Persson AE. L‐arginine or tempol supplementation improves renal and cardiovascular function in rats with reduced renal mass and chronic high salt intake. Acta Physiol (Oxf). 2013;207:732–741. [DOI] [PubMed] [Google Scholar]
- 7. Lankadeva YR, Singh RR, Moritz KM, Parkington HC, Denton KM, Tare M. Renal dysfunction is associated with a reduced contribution of nitric oxide and enhanced vasoconstriction after a congenital renal mass reduction in sheep. Circulation. 2015;131:280–288. [DOI] [PubMed] [Google Scholar]
- 8. Fredholm BB. Adenosine, an endogenous distress signal, modulates tissue damage and repair. Cell Death Differ. 2007;14:1315–1323. [DOI] [PubMed] [Google Scholar]
- 9. Carlstrom M, Wilcox CS, Arendshorst WJ. Renal autoregulation in health and disease. Physiol Rev. 2015;95:405–511. [DOI] [PMC free article] [PubMed] [Google Scholar]
- 10. Fredholm BB, IJzerman AP, Jacobson KA, Linden J, Muller CE. International Union of Basic and Clinical Pharmacology. LXXXI. Nomenclature and classification of adenosine receptors—an update. Pharmacol Rev. 2011;63:1–34. [DOI] [PMC free article] [PubMed] [Google Scholar]
- 11. Rabadi MM, Lee HT. Adenosine receptors and renal ischaemia reperfusion injury. Acta Physiol (Oxf). 2015;213:222–231. [DOI] [PMC free article] [PubMed] [Google Scholar]
- 12. Vallon V, Muhlbauer B, Osswald H. Adenosine and kidney function. Physiol Rev. 2006;86:901–940. [DOI] [PubMed] [Google Scholar]
- 13. Jacobson KA, Gao ZG. Adenosine receptors as therapeutic targets. Nat Rev Drug Discov. 2006;5:247–264. [DOI] [PMC free article] [PubMed] [Google Scholar]
- 14. Chen JF, Eltzschig HK, Fredholm BB. Adenosine receptors as drug targets—what are the challenges? Nat Rev Drug Discov. 2013;12:265–286. [DOI] [PMC free article] [PubMed] [Google Scholar]
- 15. Hasko G, Linden J, Cronstein B, Pacher P. Adenosine receptors: therapeutic aspects for inflammatory and immune diseases. Nat Rev Drug Discov. 2008;7:759–770. [DOI] [PMC free article] [PubMed] [Google Scholar]
- 16. Carlstrom M, Wilcox CS, Welch WJ. Adenosine A2A receptor activation attenuates tubuloglomerular feedback responses by stimulation of endothelial nitric oxide synthase. Am J Physiol Renal Physiol. 2011;300:F457–F464. [DOI] [PMC free article] [PubMed] [Google Scholar]
- 17. Gao X, Patzak A, Sendeski M, Scheffer PG, Teerlink T, Sallstrom J, Fredholm BB, Persson AE, Carlstrom M. Adenosine A(1)‐receptor deficiency diminishes afferent arteriolar and blood pressure responses during nitric oxide inhibition and angiotensin II treatment. Am J Physiol Regul Integr Comp Physiol. 2011;301:R1669–R1681. [DOI] [PubMed] [Google Scholar]
- 18. Lee DL, Bell TD, Bhupatkar J, Solis G, Welch WJ. Adenosine A1‐receptor knockout mice have a decreased blood pressure response to low‐dose ANG II infusion. Am J Physiol Regul Integr Comp Physiol. 2012;303:R683–R688. [DOI] [PMC free article] [PubMed] [Google Scholar]
- 19. Brown R, Ollerstam A, Johansson B, Skott O, Gebre‐Medhin S, Fredholm B, Persson AE. Abolished tubuloglomerular feedback and increased plasma renin in adenosine A1 receptor‐deficient mice. Am J Physiol Regul Integr Comp Physiol. 2001;281:R1362–R1367. [DOI] [PubMed] [Google Scholar]
- 20. Al‐Mashhadi RH, Skott O, Vanhoutte PM, Hansen PB. Activation of A(2) adenosine receptors dilates cortical efferent arterioles in mouse. Kidney Int. 2009;75:793–799. [DOI] [PubMed] [Google Scholar]
- 21. Lu Y, Zhang R, Ge Y, Carlstrom M, Wang S, Fu Y, Cheng L, Wei J, Roman RJ, Wang L, Gao X, Liu R. Identification and function of adenosine A3 receptor in afferent arterioles. Am J Physiol Renal Physiol. 2015;308:F1020–F1025. [DOI] [PMC free article] [PubMed] [Google Scholar]
- 22. Borea PA, Varani K, Vincenzi F, Baraldi PG, Tabrizi MA, Merighi S, Gessi S. The A3 adenosine receptor: history and perspectives. Pharmacol Rev. 2015;67:74–102. [DOI] [PubMed] [Google Scholar]
- 23. Yap SC, Lee HT. Adenosine and protection from acute kidney injury. Curr Opin Nephrol Hypertens. 2012;21:24–32. [DOI] [PMC free article] [PubMed] [Google Scholar]
- 24. McMaster WG, Kirabo A, Madhur MS, Harrison DG. Inflammation, immunity, and hypertensive end‐organ damage. Circ Res. 2015;116:1022–1033. [DOI] [PMC free article] [PubMed] [Google Scholar]
- 25. Crowley SD. The cooperative roles of inflammation and oxidative stress in the pathogenesis of hypertension. Antioxid Redox Signal. 2014;20:102–120. [DOI] [PMC free article] [PubMed] [Google Scholar]
- 26. Ryan MJ. An update on immune system activation in the pathogenesis of hypertension. Hypertension. 2013;62:226–230. [DOI] [PMC free article] [PubMed] [Google Scholar]
- 27. Touyz RM. The neuroimmune axis in the kidney: role in hypertension. Circ Res. 2015;117:487–489. [DOI] [PubMed] [Google Scholar]
- 28. Yang T, Gao X, Sandberg M, Zollbrecht C, Zhang XM, Hezel M, Liu M, Peleli M, Lai EY, Harris RA, Persson AE, Fredholm BB, Jansson L, Carlstrom M. Abrogation of adenosine A1 receptor signalling improves metabolic regulation in mice by modulating oxidative stress and inflammatory responses. Diabetologia. 2015;58:1610–1620. [DOI] [PubMed] [Google Scholar]
- 29. Sallstrom J, Peuckert C, Gao X, Larsson E, Nilsson A, Jensen BL, Onozato ML, Persson AE, Kullander K, Carlstrom M. Impaired EphA4 signaling leads to congenital hydronephrosis, renal injury, and hypertension. Am J Physiol Renal Physiol. 2013;305:F71–F79. [DOI] [PubMed] [Google Scholar]
- 30. Gao X, Yang T, Liu M, Peleli M, Zollbrecht C, Weitzberg E, Lundberg JO, Persson AE, Carlstrom M. NADPH oxidase in the renal microvasculature is a primary target for blood pressure‐lowering effects by inorganic nitrate and nitrite. Hypertension. 2015;65:161–170. [DOI] [PubMed] [Google Scholar]
- 31. Yang T, Peleli M, Zollbrecht C, Giulietti A, Terrando N, Lundberg JO, Weitzberg E, Carlstrom M. Inorganic nitrite attenuates NADPH oxidase‐derived superoxide generation in activated macrophages via a nitric oxide‐dependent mechanism. Free Radic Biol Med. 2015;83:159–166. [DOI] [PubMed] [Google Scholar]
- 32. Fredholm BB, Johansson S, Wang YQ. Adenosine and the regulation of metabolism and body temperature. Adv Pharmacol. 2011;61:77–94. [DOI] [PubMed] [Google Scholar]
- 33. Singh RR, Denton KM, Bertram JF, Jefferies AJ, Moritz KM. Reduced nephron endowment due to fetal uninephrectomy impairs renal sodium handling in male sheep. Clin Sci (Lond). 2010;118:669–680. [DOI] [PubMed] [Google Scholar]
- 34. Gansevoort RT, Correa‐Rotter R, Hemmelgarn BR, Jafar TH, Heerspink HJ, Mann JF, Matsushita K, Wen CP. Chronic kidney disease and cardiovascular risk: epidemiology, mechanisms, and prevention. Lancet. 2013;382:339–352. [DOI] [PubMed] [Google Scholar]
- 35. Nicholls SJ, Wang Z, Koeth R, Levison B, DelFraino B, Dzavik V, Griffith OW, Hathaway D, Panza JA, Nissen SE, Hochman JS, Hazen SL. Metabolic profiling of arginine and nitric oxide pathways predicts hemodynamic abnormalities and mortality in patients with cardiogenic shock after acute myocardial infarction. Circulation. 2007;116:2315–2324. [DOI] [PubMed] [Google Scholar]
- 36. Fleck C, Janz A, Schweitzer F, Karge E, Schwertfeger M, Stein G. Serum concentrations of asymmetric (ADMA) and symmetric (SDMA) dimethylarginine in renal failure patients. Kidney Int Suppl. 2001;78:S14–S18. [DOI] [PubMed] [Google Scholar]
- 37. Persson AE, Lai EY, Gao X, Carlstrom M, Patzak A. Interactions between adenosine, angiotensin II and nitric oxide on the afferent arteriole influence sensitivity of the tubuloglomerular feedback. Front Physiol. 2013;4:187. [DOI] [PMC free article] [PubMed] [Google Scholar]
- 38. Gao X, Peleli M, Zollbrecht C, Patzak A, Persson AE, Carlstrom M. Adenosine A1 receptor‐dependent and independent pathways in modulating renal vascular responses to angiotensin II. Acta Physiol (Oxf). 2015;213:268–276. [DOI] [PubMed] [Google Scholar]
- 39. Iriyama T, Sun K, Parchim NF, Li J, Zhao C, Song A, Hart LA, Blackwell SC, Sibai BM, Chan LN, Chan TS, Hicks MJ, Blackburn MR, Kellems RE, Xia Y. Elevated placental adenosine signaling contributes to the pathogenesis of preeclampsia. Circulation. 2015;131:730–741. [DOI] [PMC free article] [PubMed] [Google Scholar]
- 40. Zhang W, Zhang Y, Wang W, Dai Y, Ning C, Luo R, Sun K, Glover L, Grenz A, Sun H, Tao L, Zhang W, Colgan SP, Blackburn MR, Eltzschig HK, Kellems RE, Xia Y. Elevated ecto‐5′‐nucleotidase‐mediated increased renal adenosine signaling via A2B adenosine receptor contributes to chronic hypertension. Circ Res. 2013;112:1466–1478. [DOI] [PMC free article] [PubMed] [Google Scholar]
- 41. Dong L, Nordlohne J, Ge S, Hertel B, Melk A, Rong S, Haller H, von Vietinghoff S. T cell CX3CR1 mediates excess atherosclerotic inflammation in renal impairment. J Am Soc Nephrol. 2016;27:1753–1764. [DOI] [PMC free article] [PubMed] [Google Scholar]
- 42. Tracey WR, Magee W, Masamune H, Kennedy SP, Knight DR, Buchholz RA, Hill RJ. Selective adenosine A3 receptor stimulation reduces ischemic myocardial injury in the rabbit heart. Cardiovasc Res. 1997;33:410–415. [DOI] [PubMed] [Google Scholar]
- 43. Thourani VH, Ronson RS, Jordan JE, Guyton RA, Vinten‐Johansen J. Adenosine A3 pretreatment before cardioplegic arrest attenuates postischemic cardiac dysfunction. Ann Thorac Surg. 1999;67:1732–1737. [DOI] [PubMed] [Google Scholar]
- 44. Auchampach JA, Rizvi A, Qiu Y, Tang XL, Maldonado C, Teschner S, Bolli R. Selective activation of A3 adenosine receptors with N6‐(3‐iodobenzyl)adenosine‐5′‐N‐methyluronamide protects against myocardial stunning and infarction without hemodynamic changes in conscious rabbits. Circ Res. 1997;80:800–809. [DOI] [PubMed] [Google Scholar]
- 45. Harrison GJ, Cerniway RJ, Peart J, Berr SS, Ashton K, Regan S, Paul Matherne G, Headrick JP. Effects of A(3) adenosine receptor activation and gene knock‐out in ischemic‐reperfused mouse heart. Cardiovasc Res. 2002;53:147–155. [DOI] [PubMed] [Google Scholar]
- 46. Guo Y, Bolli R, Bao W, Wu WJ, Black RG Jr, Murphree SS, Salvatore CA, Jacobson MA, Auchampach JA. Targeted deletion of the A3 adenosine receptor confers resistance to myocardial ischemic injury and does not prevent early preconditioning. J Mol Cell Cardiol. 2001;33:825–830. [DOI] [PMC free article] [PubMed] [Google Scholar]
- 47. Lu Z, Fassett J, Xu X, Hu X, Zhu G, French J, Zhang P, Schnermann J, Bache RJ, Chen Y. Adenosine A3 receptor deficiency exerts unanticipated protective effects on the pressure‐overloaded left ventricle. Circulation. 2008;118:1713–1721. [DOI] [PMC free article] [PubMed] [Google Scholar]
- 48. Lee HT, Ota‐Setlik A, Xu H, D'Agati VD, Jacobson MA, Emala CW. A3 adenosine receptor knockout mice are protected against ischemia‐ and myoglobinuria‐induced renal failure. Am J Physiol Renal Physiol. 2003;284:F267–F273. [DOI] [PubMed] [Google Scholar]
- 49. Gobal F, Deshmukh A, Shah S, Mehta JL. Triad of metabolic syndrome, chronic kidney disease, and coronary heart disease with a focus on microalbuminuria. J Am Coll Cardiol. 2011;57:2303–2308. [DOI] [PubMed] [Google Scholar]
- 50. Hotamisligil GS. Inflammation and metabolic disorders. Nature. 2006;444:860–867. [DOI] [PubMed] [Google Scholar]
Associated Data
This section collects any data citations, data availability statements, or supplementary materials included in this article.
Supplementary Materials
Figure S1. Western blot membranes. Less cropped images of all Western blot membranes for the kidney (A) and BMDMs (B, C) are presented together with the molecular weight (MW) of each protein and the MW size marker. For BMDMs (B, C), membranes were cut after the transfer step according to MW of target proteins to enable detection of different proteins in the same samples. BMDM indicates bone marrow‐derived macrophages; HS, high salt; LPS, lipopolysaccharide; UNX, uninephrectomy.
Figure S2. Plasma angiotensin II (Ang II) levels. Circulating Ang II was higher in naïve aged adenosine A3 receptor knockout mice (A3 −/−) compared with naïve age‐matched wild‐type controls (A3 +/+). UNX combined with HS was associated with suppressed Ang II levels in the A3 −/−, whereas no change was observed in the A3 +/+ mice. Data are shown as mean±SEM, n=8 to 12 per group. HS indicates high salt; UNX, uninephrectomy.
Figure S3. Angiotensin II and adenosine receptors in kidney. No differences of angiotensin AT1A, AT1B, and AT2 receptors (A–C) and adenosine A1, A2A, and A2B receptors (D–F) were observed between groups. Data are shown as mean±SEM, n=4 to 5 per group. HS indicates high salt; UNX, uninephrectomy.
Figure S4. Systemic cytokines in young mice. Plasma levels of interleukin (IL) 1β (A), IL‐6 (B), IL‐12 (C), and IL‐10 (D) were all significantly increased in naïve adenosine A3 receptor knockout mice aged 10 to 12 weeks (A3 −/−) compared with naïve age‐matched wild‐type controls (A3 +/+). Data are shown as mean±SEM, *P<0.05, n=7 to 9 per group.