Abstract
Background
Tubulointerstitial fibrosis, the final outcome of most kidney diseases, involves activation of epithelial mesenchymal transition (EMT). Endothelin‐1 (ET‐1) activates EMT in cancer cells, but it is not known whether it drives EMT in the kidney. We therefore tested the hypothesis that tubulointerstitial fibrosis involves EMT driven by ET‐1.
Methods and Results
Transgenic TG[mRen2]27 (TGRen2) rats developing fulminant angiotensin II–dependent hypertension with prominent cardiovascular and renal damage were submitted to drug treatments targeted to ET‐1 and/or angiotensin II receptor or left untreated (controls). Expressional changes of E‐cadherin and α‐smooth muscle actin (αSMA) were examined as markers of renal EMT. In human kidney HK‐2 proximal tubular cells expressing the ETB receptor subtype, the effects of ET‐1 with or without ET‐1 antagonists were also investigated. The occurrence of renal fibrosis was associated with EMT in control TGRen2 rats, as evidenced by decreased E‐cadherin and increased αSMA expression. Irbesartan and the mixed ET‐1 receptor antagonist bosentan prevented these changes in a blood pressure–independent fashion (P < 0.001 for both versus controls). In HK‐2 cells ET‐1 blunted E‐cadherin expression, increased αSMA expression (both P < 0.01), collagen synthesis, and metalloproteinase activity (P < 0.005, all versus untreated cells). All changes were prevented by the selective ETB receptor antagonist BQ‐788. Evidence for involvement of the Rho‐kinase signaling pathway and dephosphorylation of Yes‐associated protein in EMT was also found.
Conclusions
In angiotensin II–dependent hypertension, ET‐1 acting via ETB receptors and the Rho‐kinase and Yes‐associated protein induces EMT and thereby renal fibrosis.
Keywords: endothelin‐1, epithelial to mesenchymal transition, fibrosis, hypertension, kidney
Subject Categories: Fibrosis, Nephrology and Kidney, High Blood Pressure
Introduction
Tubulointerstitial fibrosis (TIF) is the final outcome of many chronic kidney diseases and was considered to involve angiotensin (Ang) II and endothelin (ET)‐1.1, 2 A key event in TIF entails a phenotypic switch of epithelial cells to a mesenchymal phenotype, a phenomenon commonly known as epithelial mesenchymal transition (EMT).3 This process implies loss of cell‐to‐cell junctions, collagen synthesis, and acquisition of a migratory phenotype.
First identified during tissue and organ differentiation in embryos, EMT was thereafter recognized as a key process in wound healing, cancer development, and fibrosis. Of note, it was found to mediate TIF in chronic allograft dysfunction4 and diabetic nephropathy,5, 6 suggesting that it could be a general mechanism leading to end‐stage kidney disease. Moreover, rat tubular cells exposed to high glucose levels were reported to develop EMT via ET‐1–dependent pathways.7 Hence, it is conceivable that ET‐1 could cause TIF by inducing EMT via activation of 1 or both of its receptor subtypes A (ETA) and B (ETB).
To interrogate this hypothesis we used the TG[mRen2]27 rat (TGRen2), a transgenic rat model of fulminant Ang II–dependent hypertension featuring early‐onset severe cardiovascular and renal damage with ET‐1–dependent TIF.8, 9, 10 In this model we examined the expressional changes of epithelial (E‐cadherin) and mesenchymal markers (αSMA and S100A4) during development of TIF. To verify the relevance of these findings for humans, we then investigated the effect of ET‐1 on these markers and identified the ET receptor subtype that mediates EMT in human HK‐2 proximal tubular cells. We found that ET‐1 affected additional features of EMT, including increased collagen synthesis, activation of metalloproteinases (MMP), and cell migration by acting through Rho‐kinase and Yes‐associated protein (YAP) signaling pathways.
Methods
In Vivo Experiments
The protocol of this experiment is only briefly described here because it was previously published.10, 11 Male heterozygous [mRen2]27 rats (TGRen2) at age 5 weeks underwent measurement of body weight and systolic blood pressure (BP, tail‐cuff method) and then were matched for both body weight and BP and randomly allocated to receiving 1 of the following treatments for 4 weeks: placebo (n = 8), mixed ETA/ETB endothelin receptor antagonist bosentan (100 mg/kg body weight) (n = 5), AT‐1 receptor‐selective antagonist irbesartan (50 mg/kg body weight) (n = 5), ETA‐selective endothelin receptor antagonist BMS‐182874 (BMS; 52 mg/kg body weight) (n = 4), combined treatment with irbesartan (50 mg/kg body weight), and BMS (52 mg/kg body weight) (n = 5). The animal handling followed guidelines for animal studies; the institutional review board approved the protocol.9
At sacrifice after 4 weeks, organs, including the kidneys, were quickly removed, weighed, snap frozen in isopentane precooled on dry ice, and were kept stored in liquid nitrogen until analyzed.
Immunohistochemistry, histomorphometry, and double immunofluorescence were performed on the kidney sections used for our previous studies.9
Immunohistochemistry
Serial sections were incubated in blocking serum solution at room temperature (RT) for 60 minutes in a humidified chamber. After endogenous peroxidase was blocked with 1.5% hydrogen peroxide, the sections were incubated with the primary antibody against E‐cadherin (dilution 1:300) or αSMA (both rabbit polyclonal from Abcam, Cambridge, UK; ab15734, dilution 1:50), or S100A4 (rabbit polyclonal, Santa Cruz, Dallas, TX; dilution 1:100) at +4°C. The immunoreaction was stopped with PBS and visualized by incubating the sections with the secondary antibody (anti–rabbit polyclonal HRP, Chemicon, Billerica, MA) labeled with horseradish peroxidase and 3,3′‐diaminobenzidine (DAB, Sigma‐Aldrich, St. Louis, MO). The sections were counterstained with hematoxylin, dehydrated, cleared, and mounted.
Histomorphometry
This analysis was performed by a single examiner who was kept blind to treatment, using a Leica DM photomicroscope equipped with QWin Standard Image Analysis software (Leica Microsystems GmbH, Wetzlar, Germany). Routines were specifically created to estimate immunoreactivity for E‐cadherin, αSMA, or S100A4 in an operator‐independent fashion. The entire cortical region was examined at magnification of ×20 in 6 sections for each rat, with about 300 views for each treatment. Vessels and glomeruli were excluded from the analysis. Immunoreactivity was quantified in each field as the percentage of total surface area. All sections were stained during the same experiment to minimize experimental variability and examined by a single operator blinded to treatments. The intra‐assay and interassay coefficients of variation were less than 5% and 10%, respectively.
Double Immunofluorescence
Serial sections 4 μm thick of frozen kidneys were fixed with 4% paraformaldheide for 8 minutes at +4°C. After rinsing in PBS and incubation with BSS for 60 minutes at RT, the sections were sequentially incubated with primary antibodies to detect E‐cadherin (Abcam, Cambridge, UK: green) and αSMA (Abcam, Cambridge, UK: red), or E‐cadherin (green) and S100A4 (red), or laminin (green) and αSMA (red) and then with the secondary antibodies conjugated with Alexa Fluor 488 and Alexa Fluor 594 for 24 hours. Subsequent exposure to DAPI allowed detection of the nuclei. The omission of the primary antibody confirmed the specificity of the immunoreaction. The analysis was performed by a single examiner blind to treatment, using QWin Standard Image Analysis software (Leica Microsystems GmbH, Wetzlar, Germany).
In Vitro Experiments
Cell Culture
The human kidney cell line HK‐2 (American Type Cell Culture, ATCC, Manassas, VA), which was originally derived from the proximal tubules of a healthy human subject,12 was used as a model of differentiated proximal tubule cells. Proximal tubular cells are known to express mostly the ETB receptor subtype.13
The cells were cultured in Dulbecco's Modified Eagle's Medium/Nutrient Mixture F‐12 Ham (DMEM‐F12; Sigma‐Aldrich, St. Louis, MO) medium added with 1% glutamine (Sigma Aldrich, St. Louis, MO), 1% antibiotic/antifungin (Sigma Aldrich, St. Louis, MO), 10% fetal bovine serum (FBS) (Sigma Aldrich, St. Louis, MO) and kept at 37°C and 5% CO2. HK‐2 showed a polygonal and cobblestone appearance and expressed E‐cadherin, ZO‐1, α‐actin, cytokeratin, and α3‐β1 integrin (expression assessed with both RT‐PCR and immunohistochemistry), which are markers of the epithelial phenotype. HK‐2 cells maintained this epithelial phenotype for 10 days, after which there was a gradual transition from the polygonal to a spindle morphology.
To ascertain if ET‐1 triggers EMT and identify the time at which EMT is appreciable in HK‐2, the cells were seeded at density 2 × 10⁵ cellule/well in 6‐well (9.62 cm2/well) plates and, after reaching subconfluence, were starved with medium added with 1% FBS and then stimulated with 10−7 mol/L ET‐1. Stimulation with 2 nmol/L TGFβ was used as a positive control. ET‐1 and TGFβ were added every 24 and 48 hours, respectively.6, 14 After 12, 24, 48, 72, and 96 hours and 7 and 10 days of treatment, cells were lysed, and RNA and/or proteins were extracted following standard protocols.
EMT is a multistep process that entails blunting of the epithelial marker expression along with appearance of the mesenchymal markers leading to coexpression of both markers, increase of metalloproteinases, and acquisition of cell migration properties. Hence, to investigate if ET‐1 induces EMT in humans, we exposed the HK‐2 cells to ET‐1 (10−7 mol/L) and examined the expressional changes of (1) E‐cadherin and αSMA genes, (2) E‐cadherin, αSMA, and vimentin proteins, (3) both of these epithelial and mesenchymal markers simultaneously, (4) metalloproteinases MMP‐2 and MMP‐9, (5) cell migration, and (6) the increase of markers of fibrosis such as collagens COL1A, COL2A, COL3A, and COL4A. ETB‐selective (BQ‐788, ETA/ETB Ki ratio >1 × 10⁻⁴) and mixed ETA/ETB (macitentan, ETA/ETB Ki ratio 6 × 10⁻³) antagonists were used to ascertain the ET‐1 receptor subtype(s) mediating EMT in HK‐2 cells exposed to ET‐1. Cells were treated with the antagonist (10−5 mol/L) for 1 hour before being exposed to 10−7 mol/L ET‐1.
Gene Expression
To assess the effects of ET‐1 in HK‐2 cells, the expression of E‐cadherin, αSMA, MMP‐2, MMP‐9, COL1A, COL2A, COL3A, and COL4A mRNA was examined using real‐time PCR with Universal Probe Library Probes (Roche, Basel, Switzerland) in the Light Cycler 480 Instrument (Roche, Basel, Switzerland). After treatment gene expression was calculated by the comparative Ct (2−∆∆Ct) method: each sample was quantified against its glyceraldehyde‐3‐phosphate dehydrogenase (GAPDH) transcript content and normalized to the control group.15 The sequences of primers used in real‐time PCR are reported in Table.
Table 1.
Primer Sequences of the Genes Used for Real‐Time PCR
| Gene | Primers |
|---|---|
| E‐cadherin (epithelial) (CDH1)NM_004360.3 | cggggtctccctgtgttactactctgggaggccaagatg |
| Actin, alpha 2, smooth muscle (ACTA2)NM_001613.2 | ctgttccagccatccttcattcatgatgctgttgtaggtggt |
| Collagen, type I, alpha 1 (COL1A1)NM_000088.3 | gggattccctggacctaaagggaacacctcgctctcca |
| Collagen, type II, alpha 1 (COL2A1)NM_001844.4 | cctgtaagaccttcgggtcaactcagggggcatttgact |
| Collagen, type III, alpha 1 (COL3A1)NM_000090.3 | ctggaccccagggtcttcgaccatctgatccagggtttc |
| Collagen, type IV, alpha 1 (COL4A1)NM_001845.4 | ctcaaaggtttgccaggtctaacgcctggtaccccaat |
| Matrix metallopeptidase 2 (MMP2)NM_001127891.2 | gcttctgccctgaccaagaggtgtaaatgggtgccatc |
| Matrix metallopeptidase 9 (MMP9)NM_004994.2 | gaaccaatctcaccgacagggccacccgagtgtaaccata |
Protein Expression
After 7 and 10 days of stimulation with ET‐1 or TGFβ, proteins extracted from HK‐2 cells with tissue protein extraction reagent (T‐PER , Thermo Scientific, #78510, Rockford, IL) were exposed to a protease inhibitor (Roche, Basel, Switzerland). The concentration was then measured using the BCA quantification assay (Pierce, Thermo Scientific, #23225, Rockford, IL). Equal amounts of proteins (50 μg) were denatured in boiling water for 5 minutes, separated by 10% SDS‐PAGE gel, and electrophoretically transferred onto nitrocellulose membranes (GE Healthcare, RPN203D, Buckinghamshire, UK). The membranes were blocked for 3 hours with 5% skim milk (Carl Roth, T145.2, Karlsruhe, Germany) in PBS added with 0.1% Tween followed by overnight incubation at 4°C or 1 hour at room temperature with the following antibodies: polyclonal antibody against E‐cadherin (sc‐7870, Santa Cruz, Dallas, TX), monoclonal antibody against αSMA (kind gift from Prof. Giulio Gabbiani, University of Geneva, Geneva, Switzerland), monoclonal antibody against vimentin (clone V9, 18‐0052, San Giuliano Milanese, Italy), and monoclonal antibody against MMP9 (sc‐10737, Santa Cruz, Dallas, TX). A monoclonal antibody against GAPDH (Cell Signaling, 14C10, Danvers, MA) was used for normalization. Membranes were incubated with horseradish peroxidase (HRP)‐linked antimouse (1:2000) or antirabbit (1:2000) secondary antibodies (Dako, P0260 and P0448, Glostrup, Denmark). Proteins were visualized with a luminol‐based chemiluminescent substrate (Pierce, Thermo Scientific, 32106, Rockford, IL). Images were processed and analyzed with molecular imager VersaDoc system (Biorad, Hercules, CA).
Immunofluorescence
After HK‐2 cells were grown to a density of 2 × 10⁴ cells/slide with or without 10−7 mol/L ET‐1 for 7 days, they were fixed with 1% paraformaldehyde for 20 minutes and permeabilized with methanol for 5 minutes at −20°C. To investigate if HK‐2 cells coexpress epithelial and mesenchymal markers, after washing with PBS, the cells were incubated for 2 hours at 32°C with a monoclonal antibody against αSMA (kind gift from Prof Giulio Gabbiani), and then bound antibodies were detected by using Alexa Fluor 594‐conjugated goat anti–mouse IgG secondary Ab (1:500; Invitrogen, San Giuliano Milanese, Italy) for 1 hour at room temperature. The samples were after‐incubated with a monoclonal antibody against ZO‐1 (Invitrogen, San Giuliano Milanese, Italy) for 2 hours at 32°C and with Verde DL 488 JACK (1:400; Jackson ImmunoResearch, West Grove, PA) for an additional 1 hour. The samples were analyzed with Leica TCS SP5 confocal microscopy by using laser excitation at 488 nm and LAS AF software.
To investigate if MMP9 synthesis is triggered by ET‐1 in HK‐2 cells, the cells were incubated for 2 hours at 32°C with a monoclonal antibody against MMP9 (sc‐10737, Santa Cruz, Dallas, TX). The immunoreaction was detected by using Alexa Fluor 594‐conjugated goat anti‐mouse IgG secondary Ab (1:500; Invitrogen, San Giuliano Milanese, Italy) for 1 hour at room temperature. The nuclei were counterstained with DAPI (Sigma‐Aldrich, St. Louis, MO), and the sections were analyzed with Leica DM microscopy.
Gelatin Zymography
HK‐2 cells were exposed to ET‐1 for 7 days, and then the conditioned medium was collected after 24 hours. Hence, HK‐2 cells were examined for MMP9 activity after 8 days of exposure to ET‐1. After centrifuging of the medium at 800g for 5 minutes, the supernatant was 30‐fold concentrated in Amicon Ultra‐0.5 centrifugal filter devices with a nominal molecular weight limit of 3K (Merck Millipore Ltd, Tullagreen, Carrigtwohill Co Cork, Ireland). Twenty microliters of concentrated supernatant was added with 4× nonreducing sample buffer (1.25 mol/L Tris‐HCl pH 6.8, 10% [w/v] sodium dodecyl sulfate [SDS], 40% [v/v] glycerol, 1% bromophenol blue) (3:1, v/v) and electrophoresed on 8% SDS‐PAGE containing 1% gelatin (Sigma‐Aldrich, St. Louis, MO) as MMP‐9 substrate. The gels were then washed twice with 2.5% Triton X‐100 and incubated overnight at 37°C in developing buffer (50 mmol/L Tris‐based, 200 mmol/L NaCl, 10 mmol/L CaCl2, pH 7.4). The gels were stained with 0.5% (w/v) Coomassie Brilliant Blue R‐250 (Sigma‐Aldrich, St. Louis, MO) in 30% methanol and 10% acetic acid and subsequently destained in a 30% methanol and 10% acetic acid solution. Gelatinases appear as clear bands against blue background. Recombinant protein molecular weight markers were used to estimate the weights of the gelatinolytic bands, and conditioned medium from A549 cells treated with TNFα 10 ng/mL was used as positive control. Relative enzyme amounts were quantified by measuring the intensity of the bands with the pixel‐based densitometer program Quantity One 1‐D Analysis Software (Bio‐Rad Laboratories, Inc, Hercules, CA). Intensity values of MMP9 obtained for each experimental sample were reported over the untreated cells.
Real‐Time Migration Assays
Cell migration was assessed with the xCELLigence Real‐Time Cell Analyzer (RTCA) DP system (Roche Diagnostics, Mannheim, Germany), a cell–electrode impedance detection‐based technology. The system relies on microelectronic biosensors covering the bottom of each well in the E‐plates (Roche Diagnostics, Mannheim, Germany) that measure the electrical impedance of the cell population inside each well. The impedance is recorded as a cell index, a dimensionless parameter that reflects cell viability and adhesion.
The migration assay was performed using CIM‐Plates 16 (Roche Diagnostics, Mannheim, Germany), characterized by wells equipped with an upper and a lower chamber separated by a microporous membrane with randomly distributed 8 μmol/L pores. HK‐2 cells were plated after 7 days of exposure to ET‐1 on the underside of the upper wells, and the signal was recorded every 5 minutes for the first 8 hours and then every 15 minutes for the next 15 hours. Each cell index value was then ratioed to the cell index recorded at the baseline for the same well, making the normalized cell index values comparable between wells and plates. Analysis was performed with RTCA software (version 1.2, Roche Diagnostics, Mannheim, Germany).
MYPT and YAP Phosphorylation
After HK‐2 cells had been stimulated with ET‐1 for 5 minutes, 30 minutes, or 1 hour, proteins were extracted, and immunoblotting was performed following previously reported protocols with minor modifications.16 After the proteins were transferred onto the membranes, they were blocked for 2 hours with nonfat dry milk (5% in TPBS) and subsequently incubated overnight with a primary polyclonal antibody antiphospho‐MYPT‐1 (Thr853) (1:1000; Cell Signaling, Danvers, MA) and anti‐MYPT‐1 (1:1000; Cell Signaling, Danvers, MA). GAPDH was used as loading control and detected after the membranes had been incubated overnight with monoclonal antibody against GAPDH (1:5000; Millipore, Temecula, CA). After incubation with proper secondary antibodies, HRP‐conjugated immunoreactive proteins (Amersham Biosciences, Uppsala, Sweden) were visualized by chemiluminescence using Super Signal West Pico Chemiluminescent Substrate (Pierce, Rockford, IL). Protein expression was quantified using densitometric semiquantitative analysis and NIH image software. For YAP and phospho‐YAP detection, immunoblot and image analysis were performed as previously described for E‐cadherin staining. Monoclonal antibody against YAP (1:1000; sc‐101199, Santa Cruz, Dallas, TX) and polyclonal antibody against Phospho‐YAP (Ser 127; 1:1000; Cell Signaling, #4911, Danvers, MA) (both YAP and phospho‐YAP kind gifts from Prof. Stefano Piccolo, University of Padova, Italy) were used. To assess intracellular localization of YAP, 100 randomly chosen cells per treatment were analyzed. Cells displaying preferential localization of YAP in the nucleus, cytoplasm, or in both nucleus and cytoplasm were counted for each treatment.17
Power Calculation and Statistical Analysis
Sample size was preliminarily calculated by nQuery Advisor software (version 7.0; Statistical Solutions, Saugus, MA). When applied to E‐cadherin, S100A4, and αSMA immunosignals, a sample size of 200 views from 5 rats for each treatment group was estimated to provide 99% power to detect a difference between means of 0.34, assuming a common SD of 0.8 for both immunosignals and a type 1 error of 5%. Results are expressed as mean ± SEM. The number of independent experiments is reported in the Results and the legends to the figures.
T‐test and 1‐way analysis of variance (ANOVA) with Bonferroni post‐hoc correction for multiple comparisons, or Mann–Whitney and Kruskall‐Wallis tests for the variables that showed a skewed distribution, were used to evaluate differences between or across groups, as appropriate. To allow for comparison across markers, the changes of protein expression induced by ET‐1, alone or with antagonists, were expressed as percentage variation from the baseline values (control cells) set at 0. Chi‐square test followed by post‐hoc comparison procedure that eliminates type 1 error was used to evaluate differences of percentage localization of YAP between groups (https://www.youtube.com/watch?v=Rp0qorrPXA0#t=399.41984921). The statistical significance of these changes was evaluated by a 1‐sample t‐test versus the null hypothesis of no change. P < 0.05 was considered statistically significant. Analyses were performed with SPSS (version 23.0 for Mac, IBM Corp., Armonk, NY).
Study Approval
The animal handling followed guidelines for animal studies, and the protocol was approved by the institutional review board.9
Results
Regulation of EMT by the Renin‐Angiotensin (RAS) and ET‐1 Systems in a Blood Pressure‐Independent Fashion
Systolic blood pressure (SBP) increased significantly during the study period in TGRen2 placebo‐treated (controls; n = 8) rats (Figure 1); the Ang II type 1 receptor (AT1) antagonist irbesartan (n = 5) abolished this increase, whereas bosentan (n = 5) and BMS 182874 (BMS) (n = 4), nonselective (ETA/ETB) and ETA‐selective receptor antagonists, respectively, were not effective (Figure 1).10
Figure 1.
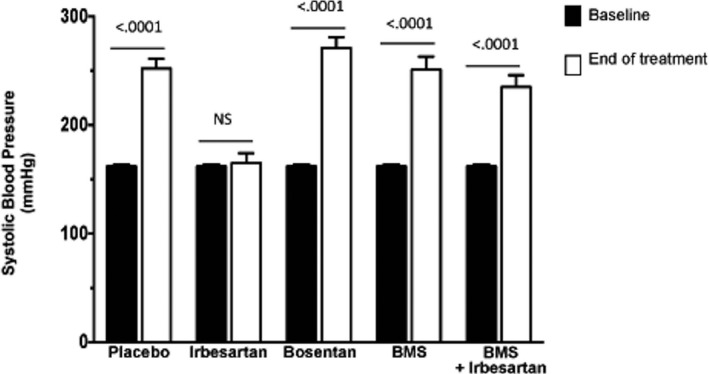
Blood pressure in TGRen2 rats. Systolic blood pressure values in the TGRen2 rats at baseline (age 5 weeks) and after 4 weeks of placebo (controls; n = 8), or treatment with irbesartan (n = 5), bosentan (n = 5), BMS‐182874 (n = 4), and irbesartan plus BMS‐182874 (n = 5). At age 9 weeks control rats showed significantly increased blood pressure. The pressor increase was prevented only in the irbesartan group.
Placebo‐treated TGRen2 rats showed weaker E‐cadherin immunostaining in the tubules (Figure 2A) than irbesartan‐ or bosentan‐treated rats, as evidenced at a quantitative analysis (Figure 2B). They also showed enlarged proximal tubules with evident αSMA immunostaining (Figure 2A‐f) that was only barely detectable in a control group of normal Sprague‐Dawley rats (immunostained percentage area 0.12 ± 0.28). The increased αSMA staining was prevented by irbesartan (−68%, Figure 2B), bosentan (−61%, Figure 2B), and irbesartan on top of BMS treatment (−70%, Figure 2B) but not by BMS alone (Figure 2B).
Figure 2.
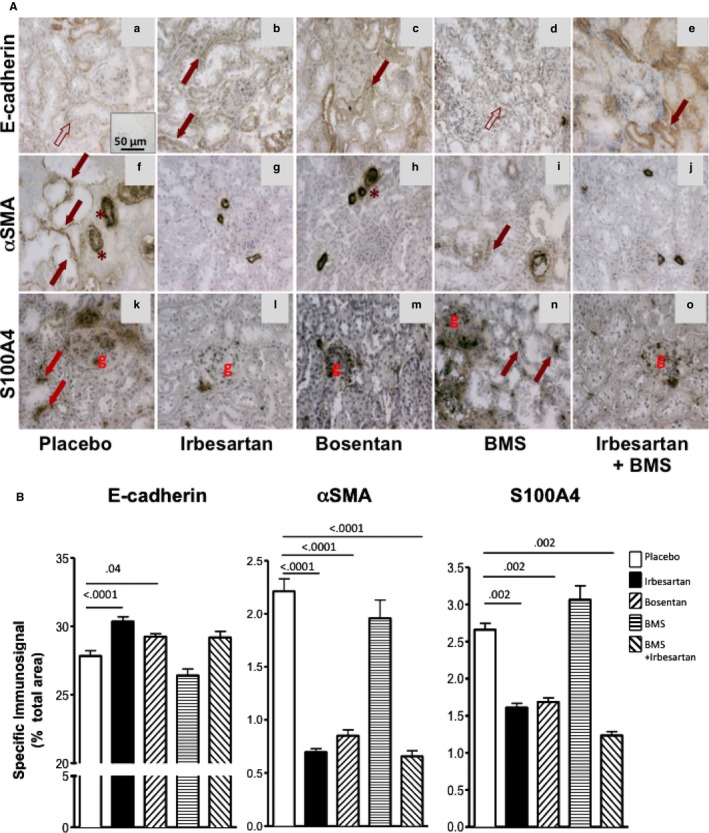
Markers of EMT in kidney of TGRen2 rats. A, Immunostaining for E‐cadherin (top panels), αSMA (middle panels), and S100A4 (bottom panels) of TGRen2 kidney sections after placebo treatment (a, f, k), irbesartan (b, g, l), bosentan (c, h, m), BMS 182874 (BMS) (d, i, n), and irbesartan on top of BMS (e, j, o). The specific signal pertaining to E‐cadherin is barely evident (empty arrows) in most tubules of placebo (a) and BMS‐treated (d) groups, where it is evident only in the vessel wall (asterisks). E‐cadherin can be clearly appreciated (full arrows) in the irbesartan‐ (b) and bosentan‐treated (c) groups. αSMA immunosignal is well recognizable in the proximal tubules of placebo (f) and BMS (i) groups but not in irbesartan‐ (g), bosentan‐ (h), and irbesartan+BMS‐ (j) treated groups. Note that tubules are enlarged in large part of the sections of placebo TGRen2 kidneys (f). The immunoreaction for S100A4 was evident in the tubules of placebo (k) and BMS (n) groups, but not in irbesartan‐ (l) and bosentan‐treated (m) groups. As expected, the immunosignal was clearly appreciated in the glomeruli. Inset, The omission of the primary antibody confirmed the specificity of the reaction. B, Quantitative analysis of immunostaining for the epithelial marker E‐cadherin and the mesenchymal markers αSMA and S100A4 in the kidney of TGRen2 rats after exposure to in vivo treatment with irbesartan, bosentan, BMS, and irbesartan on top of BMS. E‐cadherin (left panel) increased, while αSMA (middle panel) and S100A4 (right panel) decreased, after irbesartan and bosentan treatment, as compared to placebo. Irbesartan on top of BMS, but not BMS alone, prevented αSMA and S100A4 increases. Specific immunoreactivity was estimated as the percentage of total surface area. Only significant comparisons were reported. The number of animals is shown in Figure 1.
The placebo group also showed a scattered S100A4 immunostaining (Figure 2A‐m). This was blunted by irbesartan (−39%) and bosentan (−37%) (Figure 2A‐n, A‐o,B) and by irbesartan and BMS (−59%, Figure 2A‐q,B) but not by BMS alone (Figure 2A‐p). Hence, blockade of AT1 and of ETA/ETB, but not of ETA receptor alone, prevented EMT in the renal interstitium and the development of TIF in TGRen2 rats, which involves both the RAS and the ET‐1 system acting via AT1 and ETB receptors, respectively.
To ascertain the concurrence of loss of epithelial markers alongside expression of mesenchymal markers in the same tubular cells, we immunolabeled serial sections of TGRen2 kidneys for E‐cadherin and αSMA or for E‐cadherin and S100A4. Only occasionally did we find coexpression of E‐cadherin and S100A4 in the placebo group (Figure 3D,E), whereas many tubules showed αSMA and E‐cadherin coexpression, which sometimes involved most of the tubule circumference (Figure 3A,B). Of note, a few tubules showed exclusive αSMA expression, indicating full transformation into mesenchymal cells (Figure 3C). Coexpression of E‐cadherin and αSMA occurred in tubular cells of BMS‐treated rats (Figure 3I) but never in the other treatment groups (Figure 3G,H,L).
Figure 3.
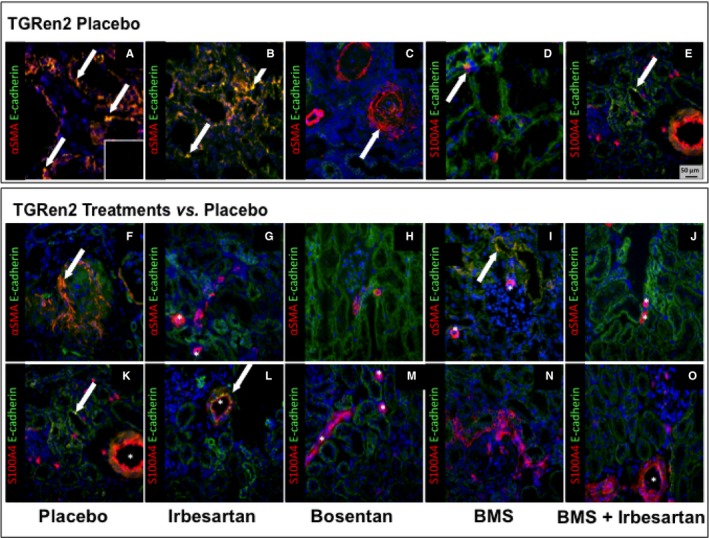
Coexpression of the epithelial and mesenchymal markers in the kidney of TGRen2 rats. Double immunofluorescence for E‐cadherin (green) and αSMA (red), or E‐cadherin (green) and S100A4 (red) in placebo TGRen2 kidney sections that include proximal tubules. Double immunofluorescence indicates coexpression of the epithelial and mesenchymal markers, thereby suggesting EMT. Tubules showed coexpression of αSMA and E‐cadherin (A and B; yellow, arrows) in few cells, thereby suggesting, as expected, that EMT occurred in only a small number of cells. However, some tubules showed only signal for αSMA, suggesting replacement of epithelial cells with myofibroblastoid cells throughout the tubule circumference, indicating overt fibrosis (C). Coexpression of S100A4 with E‐cadherin was rarely detected (D and E; arrows). The specificity of the immunoreaction for each marker was confirmed by the lack of signal after omission of primary antibody (inset). Coexpression of E cadherin and αSMA (F–J), or E cadherin and S100A4 (K–O) was restricted to vessels (asterisk) in irbesartan‐ and bosentan‐treated rats (G, L, M), thereby suggesting that EMT in the nephrons was fully prevented by either AT1 antagonism or nonselective ETA/ETB antagonism. In contrast, coexpression of epithelial and mesenchymal markers (yellow) was evident in some epithelial tubular cells after BMS (I; arrow), thereby suggesting that ETA antagonism failed to prevent EMT. Irbesartan on top of BMS prevented coexpression of epithelial and mesenchymal markers, indicating the beneficial effect of AT1 antagonism. Yellow or orange‐reddish staining indicates double labeling. ×20 magnification.
Hence, IHC and double immunofluorescence also support the contention that EMT develops in the tubules of TGRen2 rats and involves the ET‐1 system acting predominantly via ETB receptors.
Expression of the Epithelial and Mesenchymal Markers in HK‐2 Cells
We exposed in vitro renal proximal tubular HK‐2 cells to ET‐1 to investigate if ET‐1 alone could drive EMT in humans. The peptide decreased E‐cadherin gene expression at 12 hours, with a nadir at 48 hours, an effect that persisted up to 72 hours (Figure 4) (4 independent experiments, each done at least in duplicate). ET‐1 also activated αSMA expression (Figure 4) while leaving vimentin unaffected (data not shown).
Figure 4.
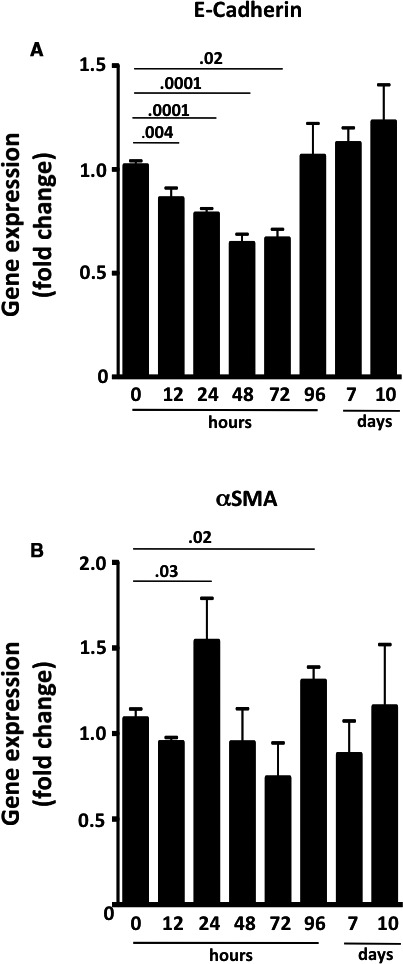
Time course of gene expression of E‐cadherin and αSMA in HK‐2 cells after exposure to ET‐1. A, E‐cadherin gradually decreased until it reached a nadir at 48 to 72 hours after the ET‐1 challenge, and it returned to pretreatment levels after 96 hours. B, αSMA increased at 24 hours and at 96 hours, but its changes followed a less consistent course. It was back to pretreatment levels by day 10. Values are means of 4 independent experiments, each done at least in duplicate. P < 0.05, ANOVA with Bonferroni post‐hoc test for multiple comparisons.
The well‐known inducer of EMT TGFβ, used as positive control, blunted E‐cadherin and increased αSMA protein expression (Figure 5A,B). Likewise, ET‐1 decreased E‐cadherin (Figure 5A) and increased vimentin (Figure 5C) and αSMA protein (Figure 5B) (time 0: n = 5; 7 days: n = 6; 10 days: n = 5; n independent experiments, each at least in duplicate).
Figure 5.
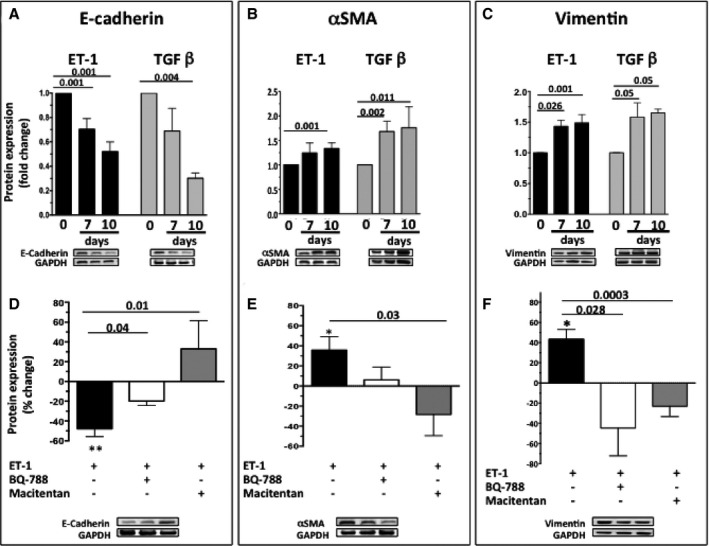
Time course of the changes of E‐cadherin (A), αSMA (B), and vimentin (C) protein expression in HK‐2 cells exposed to ET‐1 or TGFβ. Both 10−7 mol/L ET‐1 and 2 nmol/L TGFβ, a well‐known inducer of EMT used as a positive control, caused a progressive decrease of E‐cadherin and an increase of αSMA and vimentin protein expression. Values are expressed as fold changes of the values recorded in untreated cells at time 0, set to 1 (0: n = 5; 7 days: n = 6; 10 days: n = 5, n: independent experiments, each at least in duplicate). Percentage changes of protein expression of E‐cadherin (D), αSMA (E), and vimentin (F) over control untreated cells, set to 0, after exposure of HK‐2 cells to ET‐1 for 10 days, or to macitentan and the selective ETB receptor antagonist BQ‐788 on top of ET‐1. Asterisks indicate comparisons between ET‐1 and control untreated cells (*P < 0.05; **P < 0.01). Values are means of 3 independent experiments, each done at least in duplicate.
The discontinuation of the ZO‐1 signal at the membrane level, indicating loss of tight junctions in HK‐2 cells exposed to ET‐1 (Figure 6A), alongside the shift toward an elongated cell shape and appearance of αSMA altogether also indicated that ET‐1 drives EMT.
Figure 6.
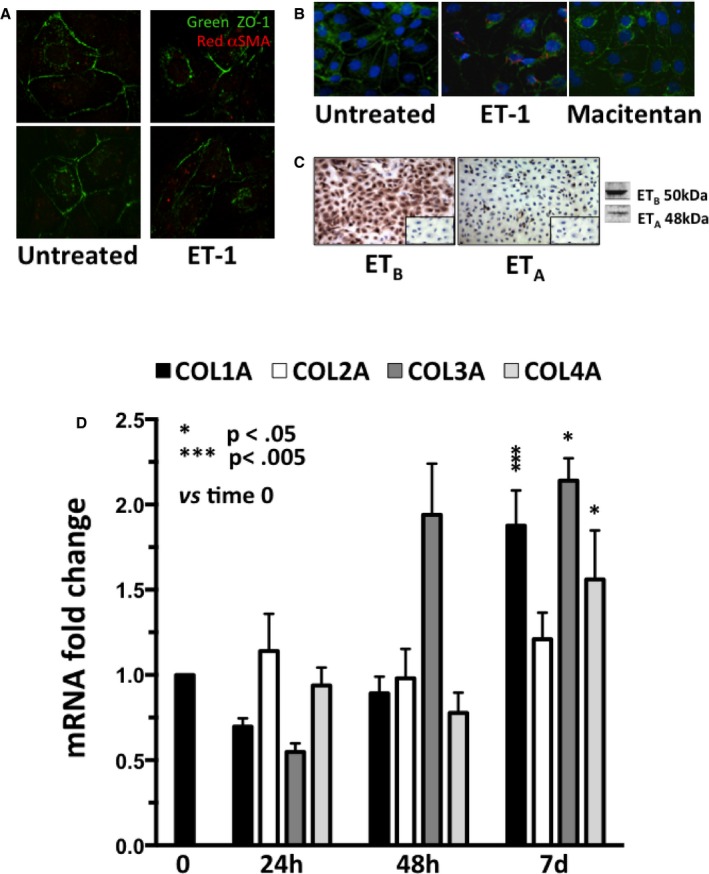
Disruption of cell junctions (panel A), onset of αSMA (panel B), expression of ET receptor subtypes (panel C), and changes of collagens after exposure of HK‐2 cells to ET‐1 (panel D). A, Confocal analysis of HK‐2 cells, which revealed integrity of the tight junctions immunolabeled in green with antibody against ZO‐1. After treatment with ET‐1, the junctions appeared to be partially disrupted, and αSMA (red) was evident in some cells. B, Onset of αSMA (red) was prevented by macitentan pretreatment. ZO‐1 and the nuclei are labeled in green and blue, respectively. C, ETB was expressed more markedly than ETA in HK‐2 cells, with a ratio ETA/ETB equal to 4.5. The omission of primary antibody confirmed the specificity of the reaction (inset). D, Gene expression of collagen 1α (COL1A), 2α (COL2A), 3α (COL3A), and 4α (COL4A) in HK‐2 cells at 24 hours, 48 hours, and 7 days after exposure to ET‐1 (4 independent experiments, each in duplicate). The value measured at time 0 for each gene set at 1 was used as control. *P = 0.05; ***P = 0.005, vs time 0.
Pretreatment of HK‐2 cells with BQ‐788, or macitentan, prevented the ET‐1‐induced decrease of E‐cadherin at day 10 (Figure 5D) (3 independent experiments, each done at least in duplicate); both antagonists also appeared to blunt the ET‐1–induced increase in αSMA protein expression, although the effect of BQ‐788 did not attain statistical significance (Figure 5E) (3 independent experiments, each done at least in duplicate). Likewise, both antagonists prevented the ET‐1–induced increase of vimentin at day 7 (Figure 5F) (3 independent experiments, each done at least in duplicate). Moreover, macitentan prevented αSMA appearance in ET‐1–treated cells (Figure 6B).
Along with the fact that the ETB was found to be on average 4.5‐fold more abundant than ETA (Figure 6C), these observations collectively suggest that in human renal proximal tubular cells ETB is the major receptor subtype mediating ET‐1–induced EMT.
ET‐1 Promotes Collagen Synthesis, MMP9 Activity, and Cell Migration in HK‐2 Cells
We evaluated collagen and MMP synthesis and the migration properties of ET‐1–treated HK‐2 cells to determine if ET‐1 is sufficient for full transition of epithelial into mesenchymal cells. We found that after 7 days of exposure ET‐1 increased collagen (COL)1A (+87%), COL3A (+114%), and COL4A (+56%) genes (Figure 6D) (4 independent experiments, each in duplicate).
The expression of MMP2 gene (Figure 7A) (4 independent experiments, each in duplicate) and MMP9 protein (Figure 7B,C) was increased by ET‐1; macitentan prevented the MMP9 increase (Figure 7B,C) (3 independent experiments, each in duplicate).
Figure 7.
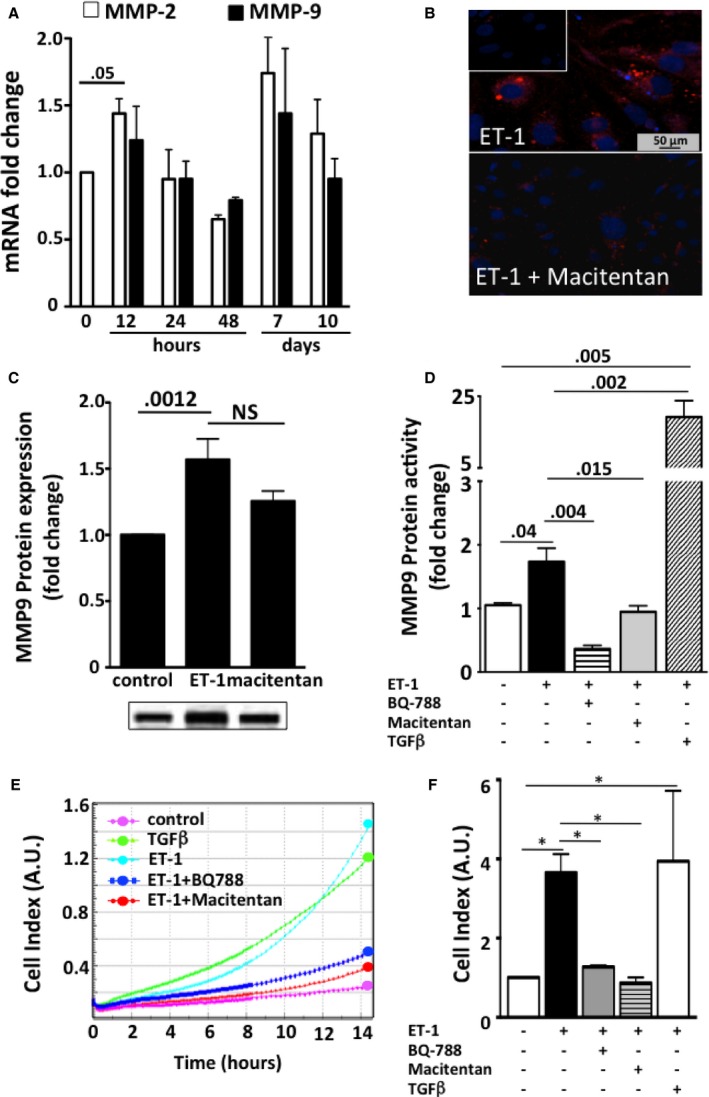
Gene expression of metalloproteinases (MMP) (panel A), immunofluorescence of MMP9 (panel B), protein expression of MMP9 (panel C), and cell migration after exposure of HK‐2 cells to ET‐1 (panel D). A, MMP‐2 transiently increased after 12 hours of exposure to ET‐1 (4 independent experiments, each in duplicate). No significant differences between times were found for MMP‐9 gene expression. B, MMP9 (red) in HK‐2 cells after incubation was evident after treatment with ET‐1 (top) and blunted after pretreatment with macitentan (bottom). The omission of primary antibody confirmed the specificity of the reaction (inset). C, MMP9 increased after treatment with ET‐1 for 7 days, and macitentan was effective in preventing its expression (3 independent experiments, each in duplicate). D, Because gene and/or protein expression cannot parallel enzymatic activity of MMP, we measured MMP9 protein activity in HK‐2 cells exposed to ET‐1 or macitentan or BQ‐788 on top of ET‐1 for 24 hours. Untreated cells were used for comparison (3 independent experiments, each in duplicate). TGFβ was used as positive control. E, Representative curves showing cell migration, as assessed with cell–electrode impedance detection‐based technology. ET‐1 (turquoise) was able to induce migration, similar to that induced by the well‐known EMT inducer TGFβ (green). Untreated cells (purple) were used as negative controls. ET‐1–induced cell migration was abolished by pretreatment with macitentan (red) and BQ‐788 (blue). A.U., arbitrary units. F, Cell index values recorded 12 hours after the treatment. Mean values of 3 independent experiments, each in duplicate. *P = 0.01.
We found that ET‐1 treatment increased MMP9 activity (Figure 7D), but less than TGFβ; this increase was prevented by both macitentan and BQ‐788 (Figure 7D) (3 independent experiments, each in duplicate). By contrast, MMP2 activity did not significantly change at any time (data not shown), indicating that activation of ETB subtype receptor regulates MMP9 but not MMP2 activity in HK‐2 cells.
After 7 days of treatment with ET‐1, HK‐2 cells acquired a proliferating/migratory phenotype, as shown by the increase in the cell index (P < 0.001 versus unstimulated; Figure 7E,F; 3 independent experiments, each in duplicate). Both macitentan and BQ‐788 prevented cell migration, thus indicating that this phenomenon occurs via ETB receptor subtype (Figure 7E,F).
Because the Rho‐kinase pathway is activated in EMT,18, 19 and ET‐1 acts via Rho‐kinase and YAP signaling pathways,20 we measured Rho‐associated serine‐threonine protein kinase‐1 (Rock‐1) expression and MYPT‐1 phosphorylation, an index of ROCK activity, in HK‐2 cells exposed to ET‐1. We found that ET‐1 induced phosphorylation of MYPT‐1, an effect that was prevented by macitentan (Figure 8A) and BQ788 (Figure 8B) (3 independent experiments, each in duplicate) but left Rock‐1 unaffected (data not shown). Because activation of the YAP has been recently described in EMT,21 and a link between E‐cadherin and YAP has been suggested,22, 23, 24 we also examined YAP activity in HK‐2 cells after an ET‐1 challenge. We found that 30 minutes of ET‐1 exposure doubled the ratio of YAP to phosphorylated YAP (Figure 9A) (3 independent experiments, each in duplicate). This finding was consistent with a high YAP immunofluorescent signal in the nucleus after exposure of HK‐2 cells to ET‐1 (Figure 9B,C versus untreated control cells), indicating that ET‐1 hindered phosphorylation and translocation of YAP to the nucleus, where YAP activates transcription by binding to DNA. Pretreatment of HK‐2 cells with either macitentan or BQ‐788 prevented the ET‐1–induced increase of YAP immunofluorescent signal in the nucleus (Figure 9B,C) (3 independent experiments, each in duplicate). Hence, ET‐1 drives EMT via Rho‐kinase and YAP signaling pathways.
Figure 8.
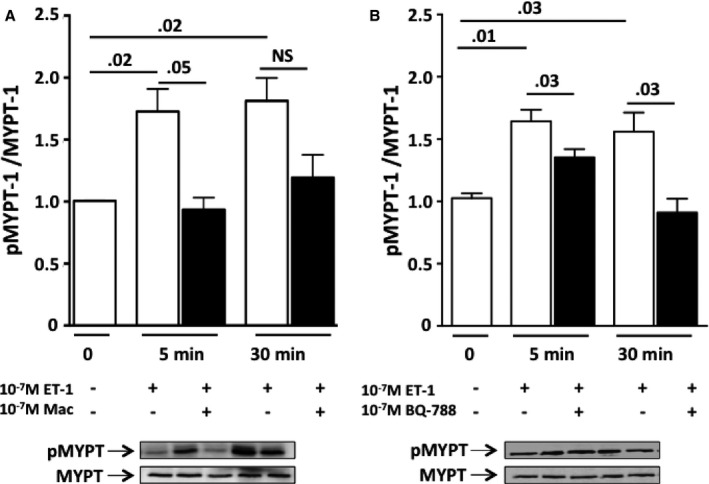
Changes of phosphorylation of MYPT‐1 after exposure of HK‐2 cells to ET‐1. A, Time course of MYPT‐1 phosphorylation showed that the ratio of phosphorylated MYPT‐1 to MYPT‐1 increased, as expected, early, ie, after 5 and 30 minutes of exposure of HK‐2 cells to ET‐1. Macitentan effectively prevented such an effect. B, BQ‐788 also prevented the increase in the phosphorylated MYPT‐1/MYPT‐1 ratio induced by ET‐1. Mean values of 3 independent experiments, each in duplicate.
Figure 9.
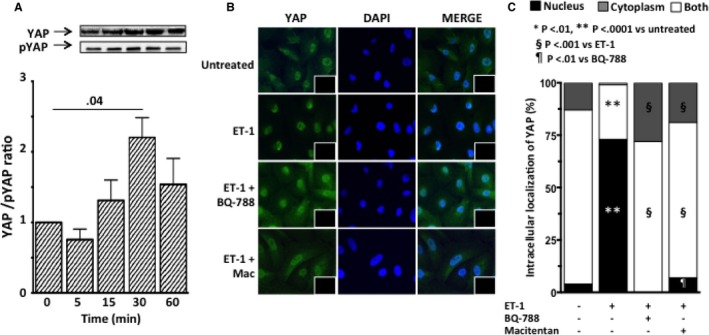
YAP activation and intracellular localization of YAP after exposure of HK‐2 cells to ET‐1. A, Time course of YAP activation, expressed as the ratio of YAP to phosphorylated YAP, showed YAP activation 30 minutes after ET‐1 exposure. Graph bars represent mean values ± SEM. B, Immunofluorescence for YAP (green) in HK‐2 cells after exposure to ET‐1, in the presence or absence of either macitentan or BQ‐788. In untreated HK‐2 cells the immunosignal was clearly evident in both nucleus and cytoplasm. ET‐1 induced blunting of the YAP signal in the cytoplasm and its increase in the nucleus, indicating dephosphorylation of YAP and translocation to the nucleus, where it can trigger transcription of genes involved in EMT. Pretreatment with either macitentan or BQ‐788 prevented the ET‐1–induced increase of YAP immunosignal in the nucleus. Nuclei were labeled with DAPI (blue); the omission of primary antibody confirmed the specificity of the reaction (insets). C, Intracellular YAP localization. Quantitative analysis confirmed that ET‐1 favors translocation of YAP to the nucleus (vs untreated cells) and that macitentan and BQ‐788 prevented such translocation. For all experiments mean values of 3 independent experiments, each in duplicate, are reported.
Discussion
We showed that the development of TIF is accompanied by EMT in TGRen‐2 rats. The latter was evidenced by reduced expression of the epithelial marker E‐cadherin and augmented expression of 2 mesenchymal markers, αSMA and S100A4. The coexpression of epithelial and mesenchymal markers in the same cells, which did not occur in Sprague‐Dawley rats, unambiguously proved the occurrence of EMT. Moreover, this study showed that ET‐1 induces EMT, and thereby TIF, by acting via ETB receptor‐mediated mechanisms. In a model of fulminant hypertension with early‐onset renal and cardiovascular damage created with the insertion of the mouse Ren‐2 gene into the rat genome,8 irbesartan lowered blood pressure, but the mixed ETA/ETB receptor antagonist bosentan did not.11 Both drugs prevented renal TIF and cardiac perivascular fibrosis, whereas the ETA‐selective antagonist BMS aggravated it, so there seems to be a dissociation between development of hypertension and TIF.9, 10 This dissociation between BP and fibrosis is consistent with data found in transgenic mice overexpressing human ET‐1 gene25 and in L‐NAME–treated rats treated with an ETA subtype‐selective receptor antagonist.26
Of note, EMT changes were prevented by irbesartan and bosentan, which effectively prevented TIF, but not by BMS.9 Thus, in the kidney the occurrence of EMT involves both Ang II and ET‐1 acting via ETB receptors but independent of blood pressure changes.
Importantly, the role of ET‐1 in EMT found in vivo was confirmed in vitro: exposure of human proximal tubular HK‐2 cells to ET‐1 changed the expression of E‐cadherin and αSMA in a way closely mimicking the in vivo findings and by action via similar effectors. In TGRen‐2 rats, which have an activated ET‐1 system,27 the ETA receptor antagonist BMS did not prevent, but rather worsened, TIF9 and EMT, suggesting that ET‐1 induced EMT via ETB receptors. The latter can be overactivated when ETA receptors are blocked. In vitro the ET‐1–induced decrease of E‐cadherin and the increase of vimentin were both prevented by BQ‐788, which also blunted, albeit not significantly, the αSMA increase.
Of note, high glucose levels, which activated ET‐1 synthesis,7 were found to induce EMT in rat tubular cells. However, the role of ETA and ETB receptors remained unknown, as the changes of EMT markers were prevented by a high (3 × 10⁻⁶ mol/L) BQ‐123 concentration, at which selectivity for ETA can be lost. Our present results with the highly selective ETB antagonist BQ‐788, alongside the notion that ETB is the only ET‐1 receptor subtype in the rat proximal tubules13 and in human HK‐2 cells, that ETB is expressed to a greater extent than ETA (Figure 6C), provide compelling evidence for a major role of ETB in EMT.
The phenotype switch of epithelial into mesenchymal cells involves digestion of the basal membrane by metalloproteinases, acquisition of migratory properties, and production of collagen. Accordingly, our cell migration studies also point to a major role of ETB receptor in EMT: in HK‐2 cells ET‐1 increased MMP9 activity and cell migration, all of which were abolished by BQ‐788. This key role of the ETB receptor subtype in EMT and TIF could partially explain the negative results obtained with the ETA selective antagonist avosentan in type 2 diabetic patients with overt nephropathy in the ASCEND trial. ETA blockade conceivably leads to increased ETB activation, thereby potentiating ETB‐mediated effects.28
MYPT‐1, a member of the RhoA/ROCK signaling pathway, is a marker of ROCK activity, which mediates ET‐1 effects.29 We found that ET‐1 induced MYPT‐1 phosphorylation, likely via activation of ROCK, thus inhibiting its activity. This inhibition of MYPT‐1 entails a key mechanism of cardiovascular‐renal remodeling,30, 31 as it modulates the phosphorylation state of the regulatory chain of myosin II.16
YAP is an adaptor protein that regulates cytoskeleton and cell motility by activating the transcriptional enhancer activator domain factors (TEADs). Phosphorylation of YAP prevents its translocation into the nucleus and the downstream binding to TEADs, with ensuing suppression of such target genes as those for vimentin and αSMA.23, 24 Although it has repeatedly been proposed,21, 22, 23, 24 a role for activation of YAP in EMT in the kidney remained to be demonstrated. The fact that ET‐1 hindered YAP phosphorylation in human proximal tubular cells, which points to YAP as a mediator of ET‐1–driven EMT, is a further novel finding of this study (Figure 10).
Figure 10.
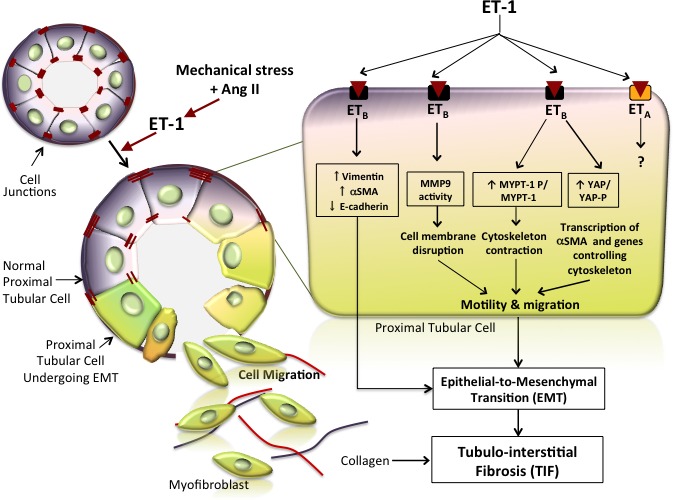
ET‐1 drives EMT and consequently fibrosis in the kidney. The cartoon depicts the epithelial‐to‐mesenchymal phenotypic shift induced by ET‐1 in the renal tubules. Tubular cells are tightly linked to adjacent cells by junctions (visualized as red dashes) under physiologic conditions. On binding of ET‐1, the ETB receptor subtype triggers a cell phenotype switch by which cells start expressing mesenchymal markers such as αSMA and vimentin and gradually lose their epithelial markers, such as E‐cadherin, which is the major component of adherent junctions. The phenotypic switch is represented in this cartoon as a change of color from bluish‐violet to greenish. Hence, coexistence of blue and greenish denotes an intermediate phenotype, whereas greenish indicates a complete transition to the mesenchymal phenotype. The cells undergoing this switch also exhibit a loss of cell junctions alongside activation of MMP‐9, which promotes degradation of the basal membrane. These concomitant processes allow the modified cells to move toward the interstitium, where they start producing extracellular matrix proteins, including collagen (red and blue lines) that, by accumulating in the interstitium between tubules, leads to tubulointerstitial fibrosis. The magnified tubular cell illustrates in greater detail the intracellular pathways activated by ET‐1. Phosphorylation of MYPT, a member of the Rho/Rock pathway that leads to cytoskeleton contraction and cell motility, is activated, whereas YAP phosphorylation is prevented, thereby allowing entry of YAP into the nucleus and finally leading to transcription of target genes that promote cell migration. Dashed lines indicate yet not proven effects.
The results obtained in vivo in a model of fulminant high tissue Ang II hypertension suggest that Ang II and ET‐1 work in parallel in a concerted way or that ET‐1 entails a downstream effector of Ang II. The latter is also supported by the observation that Ang II stimulates ET‐1 synthesis32 and activates EMT and by our finding that both irbesartan and bosentan prevented TIF and EMT. This finding can be important for developing more rational and effective strategies to prevent tubular interstitial fibrosis in Ang II–dependent hypertension.
Limitations of the Study
An issue that remained unexplored is the relationship among mechanical stress, Ang II, and ET‐1 and, in particular, whether Ang II induces EMT by activating ET‐1 synthesis in the tubular cells. The signaling pathways, including the identification of the G‐protein subtype triggered by the ETB receptor subtype, also compose an interesting issue that remains to be clarified with silencing experiments.
Conclusions
A better understanding of the mechanisms by which TIF develops and the identification of EMT as a key underlying process, along with the demonstration of the role of ET‐1 and related pathways, can open new avenues to the prevention of chronic kidney disease, not only in hypertension but also in many other renal diseases, thus representing a further step toward a personalized medicine approach to the prevention of end‐stage renal failure. A cartoon (Figure 10) schematically recapitulates the novel pieces of evidence concerning EMT and TIF that have been identified in this study: (1) EMT is implicated in TIF and is regulated by both Ang II and ET‐1; (2) EMT depends on ET‐1 acting via ETB receptors and the Rho‐kinase and YAP pathways.
Sources of Funding
The work was supported by grants 60A07‐7498/13 and 60A07‐0833/13 from the University of Padova to Seccia and Rossi, respectively, by Project RF‐2011‐02352318 of Italy's Health Ministry to Seccia, and from the Foundation for Advanced Research in Hypertension and Cardiovascular Diseases (FORICA).
Disclosures
None.
Acknowledgments
We thank Prof Giulio Gabbiani, University of Geneva, for the kind gift of the monoclonal antibody against αSMA, and Prof Stefano Piccolo, University of Padova, for the kind gift of the polyclonal antibody against phospho‐YAP. We also thank Dr Francesco Cinetto for his cogent suggestions about MMP analysis, Dr Federica Frezzato, Department of Medicine, University of Padova for her help in confocal microscopy analysis and Prof. Achille C. Pessina for critically reading the manuscript.
(J Am Heart Assoc.2016;5:e003888 doi:10.1161/JAHA.116.003888)
References
- 1. Nangaku M. Chronic hypoxia and tubulointerstitial injury: a final common pathway to end‐stage renal failure. J Am Soc Nephrol. 2006;17:17–25. [DOI] [PubMed] [Google Scholar]
- 2. Liu Y. Cellular and molecular mechanisms of renal fibrosis. Nat Rev Nephrol. 2011;7:684–696. [DOI] [PMC free article] [PubMed] [Google Scholar]
- 3. Iwano M, Plieth D, Danoff TM, Xue C, Okada H, Neilson EG. Evidence that fibroblasts derive from epithelium during tissue fibrosis. J Clin Invest. 2002;110:341–350. [DOI] [PMC free article] [PubMed] [Google Scholar]
- 4. Strutz F. Pathogenesis of tubulointerstitial fibrosis in chronic allograft dysfunction. Clin Transplant. 2009;23(suppl 21):26–32. [DOI] [PubMed] [Google Scholar]
- 5. Hills CE, Squires PE. TGF‐beta1‐induced epithelial‐to‐mesenchymal transition and therapeutic intervention in diabetic nephropathy. Am J Nephrol. 2010;31:68–74. [DOI] [PubMed] [Google Scholar]
- 6. Hills CE, Siamantouras E, Smith SW, Cockwell P, Liu KK, Squires PE. TGFbeta modulates cell‐to‐cell communication in early epithelial‐to‐mesenchymal transition. Diabetologia. 2012;55:812–824. [DOI] [PubMed] [Google Scholar]
- 7. Tang L, Li H, Gou R, Cheng G, Guo Y, Fang Y, Chen F. Endothelin‐1 mediated high glucose‐induced epithelial‐mesenchymal transition in renal tubular cells. Diabetes Res Clin Pract. 2014;104:176–182. [DOI] [PubMed] [Google Scholar]
- 8. Mullins JJ, Peters J, Ganten D. Fulminant hypertension in transgenic rats harbouring the mouse Ren‐2 gene. Nature. 1990;344:541–544. [DOI] [PubMed] [Google Scholar]
- 9. Seccia TM, Maniero C, Belloni AS, Guidolin D, Pothen P, Pessina AC, Rossi GP. Role of angiotensin II, endothelin‐1 and L‐type calcium channel in the development of glomerular, tubulointerstitial and perivascular fibrosis. J Hypertens. 2008;26:2022–2029. [DOI] [PubMed] [Google Scholar]
- 10. Seccia TM, Belloni AS, Kreutz R, Paul M, Nussdorfer GG, Pessina AC, Rossi GP. Cardiac fibrosis occurs early and involves endothelin and AT‐1 receptors in hypertension due to endogenous angiotensin II. J Am Coll Cardiol. 2003;41:666–673. [DOI] [PubMed] [Google Scholar]
- 11. Rossi GP, Sacchetto A, Rizzoni D, Bova S, Porteri E, Mazzocchi G, Belloni AS, Bahcelioglu M, Nussdorfer GG, Pessina AC. Blockade of angiotensin II type 1 receptor and not of endothelin receptor prevents hypertension and cardiovascular disease in transgenic (mREN2)27 rats via adrenocortical steroid‐independent mechanisms. Arterioscler Thromb Vasc Biol. 2000;20:949–956. [DOI] [PubMed] [Google Scholar]
- 12. Ryan MJ, Johnson G, Kirk J, Fuerstenberg SM, Zager RA, Torok‐Storb B. HK‐2: an immortalized proximal tubule epithelial cell line from normal adult human kidney. Kidney Int. 1994;45:48–57. [DOI] [PubMed] [Google Scholar]
- 13. Wendel M, Knels L, Kummer W, Koch T. Distribution of endothelin receptor subtypes ETA and ETB in the rat kidney. J Histochem Cytochem. 2006;54:1193–1203. [DOI] [PubMed] [Google Scholar]
- 14. Jain R, Shaul PW, Borok Z, Willis BC. Endothelin‐1 induces alveolar epithelial‐mesenchymal transition through endothelin type A receptor‐mediated production of TGF‐beta1. Am J Respir Cell Mol Biol. 2007;37:38–47. [DOI] [PMC free article] [PubMed] [Google Scholar]
- 15. Caroccia B, Seccia TM, Campos AG, Gioco F, Kuppusamy M, Ceolotto G, Guerzoni E, Simonato F, Mareso S, Lenzini L, Fassina A, Rossi GP. GPER‐1 and estrogen receptor‐beta ligands modulate aldosterone synthesis. Endocrinology. 2014;155:4296–4304. [DOI] [PubMed] [Google Scholar]
- 16. Calo LA, Davis PA, Pagnin E, Dal Maso L, Maiolino G, Seccia TM, Pessina AC, Rossi GP. Increased level of p63RhoGEF and RhoA/Rho kinase activity in hypertensive patients. J Hypertens. 2014;32:331–338. [DOI] [PubMed] [Google Scholar]
- 17. Choi HJ, Zhang H, Park H, Choi KS, Lee HW, Agrawal V, Kim YM, Kwon YG. Yes‐associated protein regulates endothelial cell contact‐mediated expression of angiopoietin‐2. Nat Commun. 2015;6:6943. [DOI] [PubMed] [Google Scholar]
- 18. Zhang K, Zhang H, Xiang H, Liu J, Liu Y, Zhang X, Wang J, Tang Y. TGF‐beta1 induces the dissolution of tight junctions in human renal proximal tubular cells: role of the RhoA/ROCK signaling pathway. Int J Mol Med. 2013;32:464–468. [DOI] [PubMed] [Google Scholar]
- 19. Peng J, Zhang G, Wang Q, Huang J, Ma H, Zhong Y, Zhou F, Xie C, Zhang A. ROCK cooperated with ET‐1 to induce epithelial to mesenchymal transition through SLUG in human ovarian cancer cells. Biosci Biotechnol Biochem. 2012;76:42–47. [DOI] [PubMed] [Google Scholar]
- 20. Schutte U, Bisht S, Heukamp LC, Kebschull M, Florin A, Haarmann J, Hoffmann P, Bendas G, Buettner R, Brossart P, Feldmann G. Hippo signaling mediates proliferation, invasiveness, and metastatic potential of clear cell renal cell carcinoma. Transl Oncol. 2014;7:309–321. [DOI] [PMC free article] [PubMed] [Google Scholar]
- 21. Shao DD, Xue W, Krall EB, Bhutkar A, Piccioni F, Wang X, Schinzel AC, Sood S, Rosenbluh J, Kim JW, Zwang Y, Roberts TM, Root DE, Jacks T, Hahn WC. KRAS and YAP1 converge to regulate EMT and tumor survival. Cell. 2014;158:171–184. [DOI] [PMC free article] [PubMed] [Google Scholar]
- 22. Kim NG, Koh E, Chen X, Gumbiner BM. E‐cadherin mediates contact inhibition of proliferation through Hippo signaling‐pathway components. Proc Natl Acad Sci USA. 2011;108:11930–11935. [DOI] [PMC free article] [PubMed] [Google Scholar]
- 23. Calvo F, Ege N, Grande‐Garcia A, Hooper S, Jenkins RP, Chaudhry SI, Harrington K, Williamson P, Moeendarbary E, Charras G, Sahai E. Mechanotransduction and YAP‐dependent matrix remodelling is required for the generation and maintenance of cancer‐associated fibroblasts. Nat Cell Biol. 2013;15:637–646. [DOI] [PMC free article] [PubMed] [Google Scholar]
- 24. Johnson R, Halder G. The two faces of Hippo: targeting the Hippo pathway for regenerative medicine and cancer treatment. Nat Rev Drug Discov. 2014;13:63–79. [DOI] [PMC free article] [PubMed] [Google Scholar]
- 25. Hocher B, Thone‐Reineke C, Rohmeiss P, Schmager F, Slowinski T, Burst V, Siegmund F, Quertermous T, Bauer C, Neumayer HH, Schleuning WD, Theuring F. Endothelin‐1 transgenic mice develop glomerulosclerosis, interstitial fibrosis, and renal cysts but not hypertension. J Clin Invest. 1997;99:1380–1389. [DOI] [PMC free article] [PubMed] [Google Scholar]
- 26. Boffa JJ, Tharaux PL, Dussaule JC, Chatziantoniou C. Regression of renal vascular fibrosis by endothelin receptor antagonism. Hypertension. 2001;37:490–496. [DOI] [PubMed] [Google Scholar]
- 27. Rothermund L, Kossmehl P, Neumayer HH, Paul M, Kreutz R. Renal damage is not improved by blockade of endothelin receptors in primary renin‐dependent hypertension. J Hypertens. 2003;21:2389–2397. [DOI] [PubMed] [Google Scholar]
- 28. Mann JF, Green D, Jamerson K, Ruilope LM, Kuranoff SJ, Littke T, Viberti G; ASCEND Study Group . Avosentan for overt diabetic nephropathy. J Am Soc Nephrol. 2010;21:527–535. [DOI] [PMC free article] [PubMed] [Google Scholar]
- 29. Lee TM, Chung TH, Lin SZ, Chang NC. Endothelin receptor blockade ameliorates renal injury by inhibition of RhoA/Rho‐kinase signalling in deoxycorticosterone acetate‐salt hypertensive rats. J Hypertens. 2014;32:795–805. [DOI] [PubMed] [Google Scholar]
- 30. Diah S, Zhang GX, Nagai Y, Zhang W, Gang L, Kimura S, Hamid MR, Tamiya T, Nishiyama A, Hitomi H. Aldosterone induces myofibroblastic transdifferentiation and collagen gene expression through the rho‐kinase dependent signaling pathway in rat mesangial cells. Exp Cell Res. 2008;314:3654–3662. [DOI] [PubMed] [Google Scholar]
- 31. Loirand G, Pacaud P. The role of rho protein signaling in hypertension. Nat Rev Cardiol. 2010;7:637–647. [DOI] [PubMed] [Google Scholar]
- 32. Kohno M, Horio T, Ikeda M, Yokokawa K, Fukui T, Yasunari K, Kurihara N, Takeda T. Angiotensin II stimulates endothelin‐1 secretion in cultured rat mesangial cells. Kidney Int. 1992;42:860–866. [DOI] [PubMed] [Google Scholar]


