

Abstract
Relapses and progression contribute to multiple sclerosis (MS) disease course, but neither the relationship between them nor the spectrum of clinical heterogeneity has been fully characterized. A hypothesis-driven, biologically informed model could build on the clinical phenotypes to encompass the dynamic admixture of factors underlying MS disease course. In this medical hypothesis, we put forth a dynamic model of MS disease course that incorporates localization and other drivers of disability to propose a clinical manifestation framework that visualizes MS in a clinically individualized way. The topographical model encapsulates 5 factors (localization of relapses and causative lesions; relapse frequency, severity, and recovery; and progression rate), visualized utilizing dynamic 3-dimensional renderings. The central hypothesis is that, like symptom recrudescence in Uhthoff phenomenon and pseudoexacerbations, progression clinically recapitulates prior relapse symptoms and unmasks previously silent lesions, incrementally revealing underlying lesion topography. The model uses real-time simulation software to depict disease course archetypes and illuminate several well-described but poorly reconciled phenomena including the clinical/MRI paradox and prognostic significance of lesion location and burden on disease outcomes. Utilization of this model could allow for earlier and more clinically precise identification of progressive MS and predictive implications can be empirically tested.
CONTEMPORARY CONCEPTUALIZATION OF MS DISEASE COURSE
Multiple Sclerosis (MS) is a disease characterized by both relapses and insidious progression, and is notably heterogeneous in clinical course, symptomatology, and severity. The accepted MS clinical course phenotypes1 have been foundational in clinical practice and are utilized to inform the eligibility requirements and outcomes of clinical trials, which shape regulatory approvals and indications for MS therapeutics.
While relapsing and progressive processes contribute to MS disease course,1,2 neither the relationship between them3,4 nor the spectrum of clinical heterogeneity has been fully characterized.2,3 Although the contemporary phenotypes, revised in 2013,5 have been refined with subdescriptors based on the presence or absence of inflammatory activity and disease progression, they maintain distinctions between relapsing and progressive disease as separate core disease subtypes at a given time point. These phenotypes have focused on clinical manifestations, yet by design, they do not directly represent the diversity of symptoms, relapse severity, and the pattern and manner of accumulation of disability.
Furthermore, uncertainties remain regarding the biological underpinnings of the disease. Perhaps relapsing-remitting MS (RRMS) is also progressive from onset, as atrophy is known to begin early in the disease.2,6 Perhaps progressive MS is inflammatory throughout the course, as there is evidence of inflammation even late in progressive disease.7 A contemporary view is that MS is a single disorder with an intermingling of acute focal recurrent inflammation and diffuse chronic neurodegeneration from the outset of the disease.3 In clinical practice, the line between relapsing and progressive MS is not always discrete. In one study, we found a mean period of diagnostic uncertainty of 4.3 years during the transition from RRMS to secondary progressive MS (SPMS), highlighting that there is no way to clinically determine a precise moment of transition between these 2 categories.8 A dynamic model of MS disease course must visualize this admixture of relapsing and progressive aspects of the disease in a way that remains true to MS clinical phenomenology, while also capturing the clinical variability manifested by individual patients.
THE TOPOGRAPHICAL MODEL OF MS AND THE RECAPITULATION HYPOTHESIS
The topographical model of MS described in this medical hypothesis builds directly on the 2013 clinical course revisions' delineation of relapse activity and progression as distinct processes coexisting in parallel.5 As a unified visualization of disease course, this new model illustrates the interplay of relapses and progression in MS across the entire range of disease course depictions, including the transitions between clinical phenotypes. The model provides a clinical manifestation framework through which disease course may be better understood.
Central to this model is the observation that progression clinically recapitulates a patient's prior relapse symptoms and unmasks previously clinically silent lesions, incrementally manifesting above the clinical threshold a patient's underlying “disease topography.” The recapitulation hypothesis central to this new clinical framework may better elucidate the drivers of disability accumulation and could allow for earlier and more clinically precise identification of progressive MS. A novel contribution of this model is to depict both the location and severity of an individual patient's lesions in the form of a topographical map of MS disease burden, explicating the clinical heterogeneity inherent to the disease. It is important to acknowledge that this model does not attempt to address or answer unresolved questions about the underlying immunologic or pathologic bases of the disease. Indeed, the model is designed to encapsulate and depict clinical course while remaining agnostic to, and not predicated on assumptions regarding, currently unreconciled questions2 of MS pathogenesis and etiology.
Fundamental assumptions and variables.
The topographical model of MS visualizes the CNS as a pool divided into 3 basic anatomical regions with increasing amounts of functional reserve. MS lesions are represented as topographical peaks that rise up from the pool base. Localization of lesions is visualized by plotting lesions on an anatomical grid with lateralization grouped across the 3 key regions: (1) the spinal cord and optic nerves occupy the shallow end, (2) the brainstem and cerebellum comprise the middle; and (3) the cerebral hemispheres constitute the deep end of the pool.
The water itself represents neurologic functional capacity: in essence, the compensatory ability of the nervous system that keeps regions of damage “submerged.” Functional reserve is thus a “fluid” construct, variable over time, and subject to periods of depletion (during fever or concurrent illness), renewal, and decline over the long-term disease course to a variable degree. The water's surface depicts the clinical threshold: those peaks that cross above the threshold upon formation cause clinical relapses; those topographical peaks below the surface are seen as clinically silent lesions on MRI. Depending on extent of relapse recovery, a topographical peak that crosses the threshold may recede again beneath the water's surface, or remain above the clinical threshold, leaving residual deficits. Progression is depicted as the slowly declining water level, representing a gradual depletion of functional capacity, and revealing clinical symptoms referable to the underlying disease topography.
To express the heterogeneity of clinical course and varied prognostic outcomes, the model design encapsulates 5 variable factors: localization of relapses and causative lesions; relapse frequency, severity, and recovery; and progression rate (table).
Table.
Five variable factors in the topographical model of multiple sclerosis
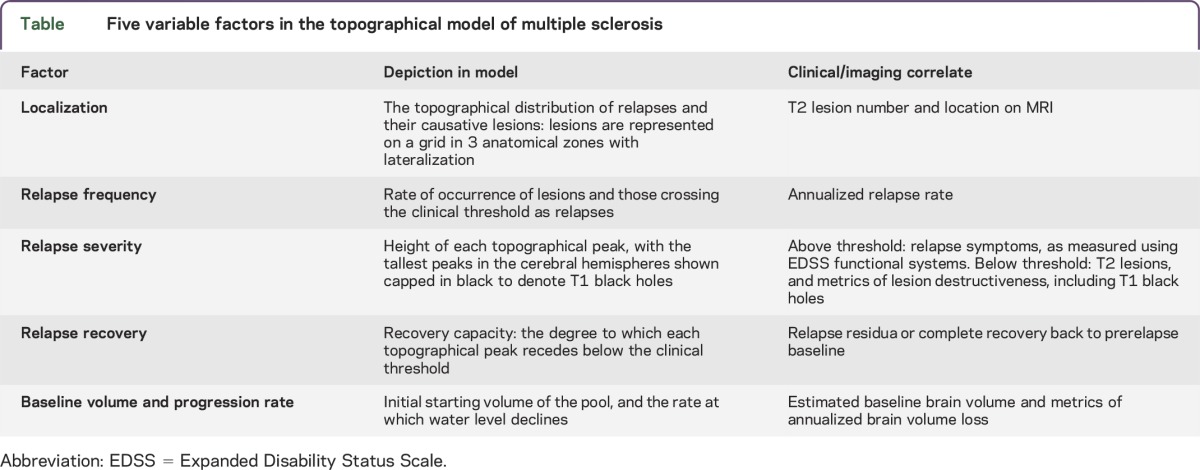
The selection of these factors is predicated on studies showing that lesion characteristics are crucial to symptoms and clinical course, with implications for prognosis and disability on the basis of their localization (e.g., spinal cord and brainstem)9–13; their severity (e.g., T1 black holes)14; and their recovery.15–18 By adjusting these factors, this model is able to visualize a wide range of disease course patterns and severity outcomes.15 To visualize disease course over time and demonstrate disease variability, the model was created in a real-time simulation software environment to dynamically vary these disease parameters.
Model visualization.
The topographical model of MS builds on the existing phenotype categories to dynamically visualize a model of disease course continuum. The key proposition, that clinical signs and disability in MS can be driven by a specific relationship between focal lesion formation and the generalized loss of CNS reserve, is depicted in the visual model as topographical peaks emerging above the clinical threshold, both acutely upon initial formation (relapse) and insidiously as the threshold itself declines (progression) (figure 1).
Figure 1. The topographical model of multiple sclerosis, clinical (A) and subclinical (B) views.

(A) Clinical view: water is opaque, only above-threshold peaks are visible. (a) Above-threshold topographical peaks depict relapses and quantified Expanded Disability Status Scale/functional system disability measures. Each peak yields localizable clinical findings; the topographical distribution defines the clinical picture for an individual patient. (b) Water level at outset reflects baseline functional capacity and may be estimated by baseline brain volume. (c) Water level decline reflects loss of functional reserve and may be estimated by metrics of annualized brain atrophy. (B) Subclinical view: water is translucent, both clinical signs and subthreshold lesions are visible. (d) Subthreshold topographical peaks depict T2 lesion number and volume. (e) The tallest peaks (i.e., the most destructive) in the cerebral hemispheres are shown capped in black as T1 black holes.
Lesions arising from the more eloquent shallow end cross the clinical threshold more readily than those arising from the deep end.19 This is consistent with the relative predilection for partial myelitis, optic neuritis, and brainstem syndromes that typify MS relapses.9,10 A top view of the model emphasizes lesion location and distribution, akin to an MRI (figure 2).
Figure 2. Lesion localization visualized in the top view of the model.

In this view, the topographical distribution of lesions is shown in the anatomical grid, grouped across the 3 key regions with lateralization, replicating a distilled MRI perspective. Both T2 lesions and a representative T1 black hole are shown. (A) Top (clinical) view: water is opaque, only above-threshold peaks are visible. (B) Top (subclinical) view: water is translucent, subthreshold lesions are visible.
As a depiction of clinical functional capacity, the water encompasses both CNS structural integrity and dynamic physiology. The clinical threshold is not static, as indicated by the small waves and fluctuations at the water's surface. Uhthoff phenomenon or pseudoexacerbations cause transient and profound recrudescence of prior relapse symptoms related to recurrent fluctuations in axonal conduction properties (including conduction block) due to an increase in core body temperature.20 This clinical phenomenon is depicted in the model as a brief, reversible drop in the water level, signifying physiologic impairment briefly and reversibly revealing a patient's underlying disease topography above the clinical threshold. The gradual decline in the water level depicts the chronic depletion, or diffuse loss, of CNS substrate that occurs over decades. Thus, in the long term, functional capacity, or reserve, may be best assessed and quantified chronically by metrics of brain volume and brain atrophy,6,21 as outlined in the table.
Dynamic disease course rendering.
The model can represent disease course archetypes that encapsulate stages of disease and represent the categories as currently defined (video 1 at Neurology.org/nn). The Lublin/Reingold course phenotypes5 are shown as stills corresponding to specific points in time in figure 3, B–E.
Figure 3. Archetypal MS clinical course depicted over 20 years.

Still images from 5 key time points in this 20-year clinical course depiction are shown. (A) RIS: lesions emerge as topographical peaks that are apparent as T2 lesions on MRI but have not crossed the clinical threshold. (B) CIS: the first lesion (circled) to cross the clinical threshold denotes CIS. Lesions arising in the shallow end are more likely to cross the clinical threshold, as there is less functional reserve in these regions. (C) RRMS: the emergence of subsequent subthreshold lesions defines RRMS by the McDonald criteria. The second clinical relapse (circled) defines clinically definite MS—in this example, a brainstem attack. Additional lesions denote ongoing disease activity, i.e., “base effects.” (D) SPMS is characterized by a gradual decline in functional capacity, revealing the underlying lesion topography above the clinical threshold. Disability is driven here principally by the dropping threshold, i.e., “surface effects” (downward arrow). Progression takes the form of a patient's particular disease topography, unmasking existing deficits and recapitulating symptoms of prior relapse—in this example, multifocal myelopathy and brainstem/cerebellar signs. (E) SPMS with activity is demonstrated by a new relapse (circled) occurring in the context of progressive disease. CIS = clinically isolated syndrome; MS = multiple sclerosis; RIS = radiologically isolated syndrome; RRMS = relapsing-remitting MS; SPMS = secondary progressive MS.
Crucially, by varying the 5 factors in the model, depictions of both relapsing and progressive-onset course, and a range of disease severities, from mild MS to highly active relapsing MS, can be achieved. The model can thus visualize a series of archetypes, representative of a heterogeneous range of both disease course and severity (figure 4; see also videos 1–4).
Figure 4. Four representative disease-course archetypes.

The model conceptualizes relapsing and progressive contributions to disease course along a continuum: an individual's disease course can be driven predominantly by relapses, or predominantly by progression, and those with very mild or stable disease may demonstrate neither. Each archetypal disease course is shown at year 5 and year 20. (A) Relapsing-remitting MS with early secondary progressive disease: relapsing disease transitions to secondary progressive MS with disability being driven in the early years by relapse (“base effects”) and in the later years primarily by the declining threshold (“surface effects”). (B) Relapsing-remitting MS with highly active disease is characterized topographically by extensive clinical and subclinical inflammatory activity. Here, several lesions in the spinal cord and brainstem do not resolve below the clinical threshold, demonstrating lesions with high severity and low recovery capacity. (C) Primary progressive MS: several subthreshold lesions denote underlying disease activity, which do not cross the clinical threshold until functional reserve declines. Disability is driven here by the dropping threshold. (D) Mild course: no demonstrable disability is accumulated at 20 years of disease. All relapses resolve below the clinical threshold—demonstrating lesions with a high recovery capacity—and there is little depletion of functional reserve beyond that of normal aging. MS = multiple sclerosis.
CLINICAL PHENOMENA ILLUMINATED BY THE TOPOGRAPHICAL MODEL
The prevailing view in MS clinical phenomenology is that relapses and lesions are focal events,19 whereas progression represents a generalized degenerative process.2 If this were strictly true, however, MS progression would presumably manifest as a largely uniform, symmetrical deterioration of upper motor neuron, visual, sensory, and cognitive function, akin to a leukodystrophy. In contrast, the clinical recapitulation hypothesis posited by this model is that the relationship between the inflammatory lesions that characterize relapsing MS and the generalized loss of functional capacity seen in progressive disease is such that the clinical signs and symptoms of a given patient's progression principally localize to the multifocal lesions sustained from inflammatory disease activity. This is exemplified by the patient who, having recovered from a partial myelopathy affecting motor function of the right lower extremity, develops disability from incrementally worsening paresis of this leg, years after the relapse. In this way, like symptom recrudescence occurring transiently in the Uhthoff phenomenon and pseudoexacerbations,20 progression in MS manifests as a permanent, incremental recapitulation of prior relapse symptoms and an unmasking of previously clinically silent lesions.
The model seeks to illuminate several well-described but poorly reconciled phenomena in the MS clinical course. It takes into account that some lesions have more prognostic significance than others on the basis of localization.15,22,23 Lesions in the shallow end are more apt to cause the long tract motor or sensory symptoms that contribute disproportionately to MS disability accumulation. This is congruent with recent data that spinal cord MRI may better discriminate between levels of disability than conventional brain MRI.12,13 Conversely, lesions in the cerebral hemispheres, such as prototypical MS periventricular lesions, are depicted as arising in the deep end of the pool, as they are least likely to cause discrete symptoms10 by virtue of the depth of cerebral functional reserve and compensatory ability. This elucidates the “clinical/MRI paradox” in MS, in which the clinical picture often appears more favorable than the lesion burden seen on conventional brain MRI would suggest.19,24–27 The inflammatory activity that forges much of a patient's disease topography occurs early in the disease.28 The model illustrates how, although a significant brain lesion burden may appear discordant with a favorable clinical picture early in the disease course, early disease activity29 or the amount of clinically silent disease seen on MRI30 are meaningful predictors of disability in the long term.
While focal inflammatory lesions are depicted as topographical peaks rising from the pool base, the diffuse neurodegenerative process is depicted in this model by the water level's gradual decline. This is congruent with emerging data on diffuse tissue loss and brain atrophy,31 which may be present from the outset of disease course,6 even at the time of radiologically isolated syndrome,32 and may be the principal driver of disability during progressive disease.2,33 The model also incorporates the beneficial effect of large baseline brain volume, which has been shown to exert a protective influence in both cognitive21 and physical34 manifestations of the disease. It is important to note that the water in this model is indeed a depiction of functional capacity—physiology and structure—and not literally CNS parenchymal volume. This is also true, however, for all modalities of structural brain imaging; brain volume measures are themselves a surrogate for brain function, and atrophy for the loss thereof. It remains to be empirically determined what structural and functional metric, or combination of metrics, may be the most robust correlate of reserve and its decrement in this model.
Visualizing the loss of reserve in this way, the topographical model may help to demonstrate why some patients with MS “catch up to their MRIs,” in that subthreshold lesions may lie in wait to ultimately manifest clinically if the loss of functional reserve—the declining threshold—is sufficient to clinically reveal them. As the relationship between focal inflammation and diffuse neurodegeneration, at the mechanistic level, has not been conclusively determined,2 in the model, the rate of water decline can be varied independently from lesion formation. However, as the recapitulation hypothesis of this model posits: even if relapse rate and lesion burden have no direct effect on the rate of loss of functional reserve,35 the topographical peaks, which are incrementally revealed as reserve is lost, are the loci of clinical progression. Thus, the model suggests that development of these lesions would more readily yield a progressive clinical course18 even without a direct effect on neurodegeneration itself.4 The crucial variable is the rate at which the threshold declines, as the loss of reserve determines whether these topographical peaks are revealed above the clinical threshold to a great or trivial degree.
IMPLICATIONS OF THE TOPOGRAPHICAL MODEL
Potential implications for basic research.
Conceptualizing MS as a unified continuum has implications for bench research. Studies seeking to identify biological differences between RRMS and SPMS, or primary progressive MS (PPMS) and SPMS, are inherently methodologically predicated on the assumption of discrete clinical phenotype categorizations. Thus, these studies may be looking for biological differences between categories that were not drawn along biological lines. Investigations into pathogenic mechanisms of disease could be evaluated across an MS continuum defined by varying the 5 factors outlined in the table, according to the clinical recapitulation hypothesis posited by this model.
The topographical model depicts both PPMS and SPMS clinical course patterns by varying these 5 factors, and thus argues that the clinical manifestation framework is not demonstrably different between patients with primary and secondary progressive forms of the disease.35–37 It is worth noting that the depiction of PPMS in this model is concordant with the observation that the mean age at PPMS diagnosis is approximately 10 years later than in RRMS.38 In this model, it takes that amount of time for the threshold to decline to the point that the lesions accumulated asymptomatically begin to be clinically revealed (see figure 4C and video 3). All MS lesions—even those in progressive disease—had to form at some point, and their occurrence is considered (by both the current clinical phenotypes and by the topographical model) to be “disease activity.” The model does not, however, take a position on the primacy of inflammation or neurodegeneration2,39,40: the model depicts topographical peaks beginning to form (“base effects”) and the water level beginning to decline (“surface effects”) simultaneously from the outset of disease.
Potential implications for clinical research and therapeutic goals.
Considering progressive MS as part of a continuum may also have clinical implications: the topographical model suggests that patients with relapsing forms of MS may also have evidence of progression, and that those with PPMS or SPMS warrant vigilance for relapses or inflammatory activity. In clinical trials of both SPMS41 and PPMS,42 patients with a greater admixture of relapse/disease activity in a progressive context have been more apt to demonstrate a treatment benefit. Clinical trial outcomes of disease-modifying therapies could be evaluated through the lens of the topographical model on the basis of their distinct “base effects” (preventing new lesions and the relapses they cause) and their “surface effects” (preventing the decline of functional reserve and potential imaging correlates thereof,43 as outlined in the table). From a clinical research perspective, this could have bearing on how combination treatment strategies are designed, with a focus on combining therapeutics that work differentially on the “base” and on the “surface.” If empirically validated, future investigations could include designing inclusion criteria for trials across a spectrum of disease as encapsulated in the topographical model.
Prior disease course depictions in MS classically show an accumulation of disability over time. The topographical model can show clinical quiescence, or disease stability, with little to no activity manifesting above the clinical threshold as displayed from years 11 through 17 in the “mild MS” example (figure 4D and video 4). As no evidence of disease activity (NEDA)44 becomes an ever more achievable goal for more patients, it is appropriate that a new disease-course model be able to represent this outcome. In addition, positing functional reserve as dynamic may open up investigational avenues into maintenance or renewal of reserve, including through management of comorbidities shown to have deleterious effects on MS clinical course.45 Studies of positive health-related behavior (e.g., physical activity,46 cognitive enrichment,21,47 avoidance of smoking48) can thus be incorporated into empirical studies of functional renewal, conceptualized as “filling up the tank” in this model.
FUTURE DIRECTIONS AND LIMITATIONS OF THE MODEL
The topographical model of MS has both theoretical and practical limitations. Although it is congruent with clinical and imaging findings, not all of the assumptions in this model have been proven, and the central hypothesis, that progression clinically recapitulates prior relapse symptoms and unmasks previously clinically silent lesions, is empirically testable. Evaluating whether disability accumulation can be mapped to locations of previous lesions/relapses, and empirically validating the relationships among factors in this model, will require studying well-characterized longitudinal cohorts of patients with known relapse and lesion history who have progressed over time.
Empirical testing of the model initially warrants a mathematical simulation. As expressed in this model, above-threshold peaks cause demonstrable clinical signs and symptoms. Thus, the combined volume of above-threshold peaks corresponds with the degree of accumulated disability. The formula shown below depicts the fundamental summative relationship among the factors in the model.
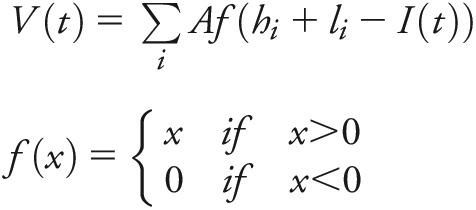 |
Above-threshold topographical peaks correspond to accumulated disability. This formula is for above-threshold topographical volume calculation at time point t, where V(t) = volume of above-threshold cumulative topographical peaks at time point t; I(t) = water level at time point t; li = topographical peak height; hi = height of floor from lower baseline, based on slope and peak location. A = area of topographical peaks. li(A) = topographical peak volume.
This can be used as a first-order approximation to calculate disability accumulation over time and produce MS disease course tracings congruent with the existing clinical phenotypes. Moving forward, the cumulative volume of above-threshold peaks can be calibrated to Expanded Disability Status Scale (EDSS) levels. This framework can then be benchmarked against functional system and EDSS trajectories. Crucial to the empirical testing of this model is the mapping of above-threshold topographical peaks to their referable EDSS functional systems by lesion location. Precise anatomical mapping would allow multiple lesions affecting a particular pathway (for example, the pyramidal system) to exert a cumulative effect on that functional system score. Operationalizing this model will require identification of precise clinical and imaging metrics for each parameter and appropriate weighting of these variables outlined in the table to correspond to clinical course.
There remain unanswered questions in this regard. For example, the model depicts a single clinical threshold descending uniformly across anatomical regions in the CNS. This is intended as a first-order approximation to encapsulate the recapitulation hypothesis essential to the model. This single threshold may need to be further divided into uneven subsections, perhaps moving at different rates, if empirical evidence suggests variability in progression rate in different anatomical regions or functional systems (for instance, to elucidate greater inherent compensatory neuroplasticity in the visual system as compared to the motor system). The optic nerves reside in the shallow end of this model, as they possess relatively little functional reserve, and optic neuritis is one of the most common early relapse symptoms.49 Optic nerve lesions, however, most often recover below the clinical threshold,49,50 such that progressive visual loss is a relatively uncommon phenomenon. The anterior visual system in MS is subject to both focal events, as with optic neuritis, and gradual insidious loss of tissue substrate as seen by optical coherence tomography,51 thus demonstrating that the basic clinical manifestation framework of this model holds true even for this location. The favorable prognostic contribution of optic neuritis to clinical course can be accounted for in this model by the high degree of below-threshold recovery of this symptom type (1 of the 5 variable factors in the model) and appropriate weighting of this functional system in EDSS calculations.
The concept of a clinical threshold itself may require adjustment based on CNS region or symptom type: a discrete threshold may be more applicable to the presence or absence of pyramidal tract dysfunction, and less to multifaceted symptomatic domains poorly assessed by the EDSS and in clinical practice, such as MS-related cognitive dysfunction. This model is predicated on metrics that can be acquired in clinical practice using conventional MRI. Emerging MRI techniques demonstrate pathology within white and gray matter that appears normal on conventional imaging. As modern MRI methods become increasingly more sensitive to MS-related pathology (such as gray matter lesions and segmental atrophy), we may have even more robust imaging indicators that could be evaluated in the context of this model. Empirical studies could be designed to elucidate how these focal and diffuse disease processes may be indicative of subthreshold peaks, and a lowering of the clinical threshold, respectively.
In conclusion, the topographical model of MS has been designed to serve as a conceptual framework for depicting the clinical manifestation of MS disease course, and to set the stage for future empirical research. As it is refined and validated, the model has potential implications for patient care across the spectrum of disease, including a more clinically nuanced and individualized representation of disease course, which could allow for earlier identification of progressive MS. Analyzing existing clinical trial data from patient cohorts using the factors outlined in the model may have implications for future design of clinical trials. The model also has utility as an educational tool for patients and health care providers. A fully operationalized version of this model could utilize quantified metrics for individual patients in order to depict clinical course and may allow this tool to be used to prognosticate personalized outcomes.
Supplementary Material
ACKNOWLEDGMENT
The authors acknowledge Dr. Fred D. Lublin from Mount Sinai for his support, spirited debate, and careful review of the manuscript, as well as Drs. Andrew Solomon from the University of Vermont, and James Sumowski, Michelle Fabian, and Benjamin Laitman from Mount Sinai for their suggested revisions. The authors thank Drs. Aaron E. Miller, Ilana Katz Sand, Sylvia Klineova, Rebecca Farber, Robert Gross, Asaff Harel, Sam Horng, Achilles Ntranos, DNP Aliza Ben-Zacharia, and NP Gretchen Mathewson from Mount Sinai for workshopping the concept. They thank Oliver Bühler from New York University for collaborating on the mathematical expression of the model. They are grateful to the editorial review provided by Rose Krieger and the personal support provided by Nada Gligorov. This project was made possible by the pro bono services of Harrison and Star, in particular David Brungard, Carol Eng, Erik Gorka, Joseph Gonzalez, Chris Graves, Charles Heermann, Mardene Miller, Kathleen Murphy, John Panagis, Victoria Sperling, Daren Tillinger, and Jessica Weisman, whose digital and design expertise contributed to the visualization of the model.
GLOSSARY
- EDSS
Expanded Disability Status Scale
- MS
multiple sclerosis
- PPMS
primary progressive multiple sclerosis
- RRMS
relapsing-remitting multiple sclerosis
- SPMS
secondary progressive multiple sclerosis
Footnotes
Supplemental data at Neurology.org/nn
AUTHOR CONTRIBUTIONS
S.C.K. initiated the hypothesis project concept, was involved in model design and visualization, drafted the figures, drafted the manuscript, edited and revised the manuscript. K.C. was involved in model design and visualization, drafted the figures, drafted the manuscript, edited and revised the manuscript. S.D.N. was involved in model design and visualization, drafted the figures, edited and revised the manuscript. M.F. was involved in model design and visualization, edited and revised the manuscript.
STUDY FUNDING
No outside source of funding was utilized in this project.
DISCLOSURE
S.C. Krieger served on the scientific advisory board for Teva Neuroscience, received honoraria from Acorda Therapeutics, Bayer Healthcare, Biogen Idec, EMD Serono, Genentech, Genzyme, Novartis, Questcor, Takeda, Teva Neuroscience, consulted for Bayer Healthcare, Biogen Idec, EMD Serono, Genzyme, Genentech, Novartis, Questcor, Teva Neuroscience, was a speaker for Biogen Idec, Genzyme, received research support from National MS Society. K. Cook, S. De Nino and M. Fletcher have been employed by Harrison and Star. Go to Neurology.org/nn for full disclosure forms.
REFERENCES
- 1.Lublin FD, Reingold SC. Defining the clinical course of multiple sclerosis: results of an international survey. Neurology 1996;46:907–911. [DOI] [PubMed] [Google Scholar]
- 2.Mahad DH, Trapp BD, Lassmann H. Pathological mechanisms in progressive multiple sclerosis. Lancet Neurol 2015;14:183–193. [DOI] [PubMed] [Google Scholar]
- 3.Confavreux C, Vukusic S. Natural history of multiple sclerosis: a unifying concept. Brain 2006;129:606–616. [DOI] [PubMed] [Google Scholar]
- 4.Leray E, Yaouanq J, Le Page E, et al. Evidence for a two-stage disability progression in multiple sclerosis. Brain 2010;133:1900–1913. [DOI] [PMC free article] [PubMed] [Google Scholar]
- 5.Lublin FD, Reingold SC, Cohen JA, et al. Defining the clinical course of multiple sclerosis: the 2013 revisions. Neurology 2014;83:278–286. [DOI] [PMC free article] [PubMed] [Google Scholar]
- 6.Chard DT, Griffin CM, Parker GJ, et al. Brain atrophy in clinically early relapsing-remitting multiple sclerosis. Brain 2002;125:327–337. [DOI] [PubMed] [Google Scholar]
- 7.Magliozzi R, Howell O, Vora A, et al. Meningeal B-cell follicles in secondary progressive multiple sclerosis associate with early onset of disease and severe cortical pathology. Brain 2007;130:1089–1104. [DOI] [PubMed] [Google Scholar]
- 8.Katz Sand I, Krieger SC, Farrell C, Miller AE. Diagnostic uncertainty during the transition to secondary progressive multiple sclerosis. Mult Scler 2014;20:1654–1657. [DOI] [PubMed] [Google Scholar]
- 9.Mowry EM, Deen S, Malikova I, et al. The onset location of multiple sclerosis predicts the location of subsequent relapses. J Neurol Neurosurg Psychiatry 2008;80:400–403. [DOI] [PubMed] [Google Scholar]
- 10.Mowry EM, Pesic M, Grimes B, et al. Demyelinating events in early multiple sclerosis have inherent severity and recovery. Neurology 2009;72:602–608. [DOI] [PMC free article] [PubMed] [Google Scholar]
- 11.Kearney H, Altmann DR, Samson RS, et al. Cervical cord lesion load is associated with disability independently from atrophy in MS. Neurology 2015;84:367–373. [DOI] [PubMed] [Google Scholar]
- 12.Kearney H, Miller DH, Ciccarelli O. Spinal cord MRI in multiple sclerosis: diagnostic, prognostic and clinical value. Nat Rev Neurol 2015;11:327–338. [DOI] [PubMed] [Google Scholar]
- 13.Okuda DT, Mowry EM, Cree BA, et al. Asymptomatic spinal cord lesions predict disease progression in radiologically isolated syndrome. Neurology 2011;76:686–692. [DOI] [PMC free article] [PubMed] [Google Scholar]
- 14.Zivadinov R, Stosic M, Cox JI, et al. The place of conventional MRI and newly emerging MRI techniques in monitoring different aspects of treatment outcome. J Neurol 2008;255:61–74. [DOI] [PubMed] [Google Scholar]
- 15.Scott TF, Schramke CJ, Novero J, Chieffe C. Short-term prognosis in early relapsing-remitting multiple sclerosis. Neurology 2000;55:689–693. [DOI] [PubMed] [Google Scholar]
- 16.Lublin FD, Baier M, Cutter G. Effect of relapses on development of residual deficit in multiple sclerosis. Neurology 2003;61:1528–1532. [DOI] [PubMed] [Google Scholar]
- 17.Scott TF, Schramke CJ. Poor recovery after the first two attacks of multiple sclerosis is associated with poor outcome five years later. J Neurol Sci 2010;292:52–56. [DOI] [PubMed] [Google Scholar]
- 18.Novotna M, Mateo Paz Soldán MM, Abou Zeid N, et al. Poor early relapse recovery affects onset of progressive disease course in multiple sclerosis. Neurology 2015;85:722–729. [DOI] [PMC free article] [PubMed] [Google Scholar]
- 19.Giovannoni G, Kieseier B, Hartung HP. Correlating immunological and magnetic resonance imaging markers of disease activity in multiple sclerosis. J Neural Neurosurg Psychiatry 1998;64(suppl):S31–S36. [PubMed] [Google Scholar]
- 20.Frohman TC, Davis SL, Beh S, et al. Uhthoff's phenomena in MS: clinical features and pathophysiology. Nat Rev Neurol 2013;9:535–540. [DOI] [PubMed] [Google Scholar]
- 21.Sumowski JF, Rocca MA, Leavitt VM, et al. Brain reserve and cognitive reserve protect against cognitive decline over 4.5 years in MS. Neurology 2014;82:1776–1783. [DOI] [PMC free article] [PubMed] [Google Scholar]
- 22.Sastre-Garriga J, Tintoré M. Multiple sclerosis: lesion location may predict disability in multiple sclerosis. Nat Rev Neurol 2010;6:648–649. [DOI] [PubMed] [Google Scholar]
- 23.Dalton CM, Bodini B, Samson RS, et al. Brain lesion location and clinical status 20 years after a diagnosis of clinically isolated syndrome suggestive of multiple sclerosis. Mult Scler 2012;18:322–328. [DOI] [PubMed] [Google Scholar]
- 24.Barkhof F. The clinico-radiological paradox in multiple sclerosis revisited. Curr Opin Neurol 2002;15:239–245. [DOI] [PubMed] [Google Scholar]
- 25.Barkhof F, Scheltens P, Frequin ST, et al. Relapsing-remitting multiple sclerosis: sequential enhanced MR imaging vs clinical findings in determining disease activity. Am J Roentgenol 1992;159:1041–1047. [DOI] [PubMed] [Google Scholar]
- 26.Bakshi R, Thompson AJ, Rocca MA, et al. MRI in multiple sclerosis: current status and future prospects. Lancet Neurol 2008;7:615–625. [DOI] [PMC free article] [PubMed] [Google Scholar]
- 27.Okuda DT, Siva A, Kantarci O, et al. Radiologically isolated syndrome: 5-year risk for an initial clinical event. PLoS One 2014;9:e90509 DOI: 10.1371/journal.pone.0090509. [DOI] [PMC free article] [PubMed] [Google Scholar]
- 28.Scalfari A, Neuhaus A, Daumer M, et al. Early relapses, onset of progression, and late outcome in multiple sclerosis. JAMA Neurol 2013;70:214–222. [DOI] [PubMed] [Google Scholar]
- 29.Weinshenker BG, Bass B, Rice GP, et al. The natural history of multiple sclerosis: a geographically based study: 2: predictive value of the early clinical course. Brain 1989;112:1419–1428. [DOI] [PubMed] [Google Scholar]
- 30.Fisniku LK, Brex PA, Altmann DR, et al. Disability and T2 MRI lesions: a 20-year follow-up of patients with relapse onset of multiple sclerosis. Brain 2008;131:808–817. [DOI] [PubMed] [Google Scholar]
- 31.Vollmer T, Signorovitch J, Huynh L, et al. The natural history of brain volume loss among patients with multiple sclerosis: a systematic literature review and meta-analysis. J Neurol Sci 2015;357:8–18. [DOI] [PubMed] [Google Scholar]
- 32.De Stefano N, Stromillo ML, Rossi F, et al. Improving the characterization of radiologically isolated syndrome suggestive of multiple sclerosis. PLoS One 2011;6:e19452 DOI: 10.1371/journal.pone.0019452. [DOI] [PMC free article] [PubMed] [Google Scholar]
- 33.Bermel RA, Bakshi R. The measurement and clinical relevance of brain atrophy in multiple sclerosis. Lancet Neurol 2006;5:158–170. [DOI] [PubMed] [Google Scholar]
- 34.Sumowski JF, Rocca MA, Leavitt VM, et al. Brain reserve against physical disability progression over 5 years in multiple sclerosis. Neurology 2016;86:2006–2009. [DOI] [PMC free article] [PubMed] [Google Scholar]
- 35.Confavreux C, Vukusic S, Adeleine P. Early clinical predictors and progression of irreversible disability in multiple sclerosis: an amnesic process. Brain 2003;126:770–782. [DOI] [PubMed] [Google Scholar]
- 36.Vukusic S, Confavreaux C. Primary and secondary multiple sclerosis. J Neurol Sci 2003;206:153–155. [DOI] [PubMed] [Google Scholar]
- 37.Kremenchutzky M, Rice GP, Baskerville J, et al. The natural history of multiple sclerosis: a geographically based study 9: observations on the progressive phase of the disease. Brain 2006;129:584–594. [DOI] [PubMed] [Google Scholar]
- 38.Tutuncu M, Tang J, Zeid NA, et al. Onset of progressive phase is an age-dependent clinical milestone in multiple sclerosis. Mult Scler 2013;19:188–198. [DOI] [PMC free article] [PubMed] [Google Scholar]
- 39.Trapp BD, Nave KA. Multiple sclerosis: an immune or neurodegenerative disorder? Annu Rev Neurosci 2008;31:247–269. [DOI] [PubMed] [Google Scholar]
- 40.Lassman H, van Horssen J, Mahad D. Progressive multiple sclerosis: pathology and pathogenesis. Nat Rev Neurol 2012;8:647–656. [DOI] [PubMed] [Google Scholar]
- 41.Kappos L, Weinshenker B, Pozzilli C, et al. Interferon beta-1b in secondary progressive MS: a combined analysis of the two trials. Neurology 2004;63:1779–1787. [DOI] [PubMed] [Google Scholar]
- 42.Hawker K, O'Connor P, Freedman MS, et al. OLYMPUS Trial Group. Rituximab in patients with primary progressive multiple sclerosis: results of a randomized double-blind placebo-controlled multicenter trial. Ann Neurol 2009;66:460–471. [DOI] [PubMed] [Google Scholar]
- 43.Sormani MP, Arnold DL, De Stefano N. Treatment effect on brain atrophy correlates with treatment effect on disability in multiple sclerosis. Ann Neurol 2014;75:43–49. [DOI] [PubMed] [Google Scholar]
- 44.Bevan CJ, Cree BAC. Disease activity free status: a new end point for a new era in multiple sclerosis clinical research? JAMA Neurol 2014;71:269–270. [DOI] [PubMed] [Google Scholar]
- 45.Conway DS, Thompson NR, Cohen JA. Influence of hypertension, diabetes, hyperlipidemia, and obstructive lung disease on multiple sclerosis disease course. Mult Scler Epub 2016 May 26. DOI: 10.1177/1352458516650512. [DOI] [PubMed]
- 46.Giesser BS. Exercise in the management of persons with multiple sclerosis. Ther Adv Neurol Disord 2015;8:123–130. [DOI] [PMC free article] [PubMed] [Google Scholar]
- 47.Sumowski JF, Leavitt VM. Cognitive reserve in multiple sclerosis. Mult Scler 2013;19:1122–1127. [DOI] [PubMed] [Google Scholar]
- 48.Manouchehrinia A, Tench CR, Maxted J, et al. Tobacco smoking and disability progression in multiple sclerosis: United Kingdom cohort study. Brain 2013;136:2298–2304. [DOI] [PMC free article] [PubMed] [Google Scholar]
- 49.Toosy AT, Mason DF, Miller DH. Optic neuritis. Lancet Neurol 2014;13:83–99. [DOI] [PubMed] [Google Scholar]
- 50.Beck RW, Cleary PA, Backlund JC. The course of visual recovery after optic neuritis: experience of the Optic Neuritis Treatment Trial. Ophthalmology 1994;101:1771–1778. [DOI] [PubMed] [Google Scholar]
- 51.Petzold A, de Boer JF, Schippling S, et al. Optical coherence tomography in multiple sclerosis: a systematic review and meta-analysis. Lancet Neurol 2010;9:921–932. [DOI] [PubMed] [Google Scholar]
Associated Data
This section collects any data citations, data availability statements, or supplementary materials included in this article.