

Abstract
Acute Respiratory Distress Syndrome (ARDS) severity may be influenced by heterogeneity of neutrophil activation. Interferon-stimulated genes (ISG) are a broad gene family induced by Type I interferons, often as a response to viral infections, which evokes extensive immunomodulation. We tested the hypothesis that over- or under-expression of immunomodulatory ISG by neutrophils is associated with worse clinical outcomes in patients with ARDS. Genome-wide transcriptional profiles of circulating neutrophils isolated from patients with sepsis-induced ARDS (n = 31) and healthy controls (n = 19) were used to characterize ISG expression. Hierarchical clustering of expression identified 3 distinct subject groups with Low, Mid and High ISG expression. ISG accounting for the greatest variability in expression were identified (MX1, IFIT1, and ISG15) and used to analyze a prospective cohort at the Colorado ARDS Network site. One hundred twenty ARDS patients from four urban hospitals were enrolled within 72 hours of initiation of mechanical ventilation. Circulating neutrophils were isolated from patients and expression of ISG determined by PCR. Samples were stratified by standard deviation from the mean into High (n = 21), Mid, (n = 82) or Low (n = 17) ISG expression. Clinical outcomes were compared between patients with High or Low ISG expression to those with Mid-range expression. At enrollment, there were no differences in age, gender, co-existing medical conditions, or type of physiologic injury between cohorts. After adjusting for age, race, gender and BMI, patients with either High or Low ISG expression had significantly worse clinical outcomes than those in the Mid for number of 28-day ventilator- and ICU-free days (P = 0.0006 and 0.0004), as well as 90-day mortality and 90-day home with unassisted breathing (P = 0.02 and 0.004). These findings suggest extremes of ISG expression by circulating neutrophils from ARDS patients recovered early in the syndrome are associated with poorer clinical outcomes.
Introduction
Extensive variability in severity and survival is a common feature of acute respiratory distress syndrome (ARDS), and identification of mechanisms that regulate this variability may lead to more personalized treatment. Age, race, cigarette smoking, and alcoholism impair the immune system, and are linked to increased prevalence or worse ARDS outcomes [1–9]. Specific forms of inflammatory dysregulation are also linked to worse outcomes from sepsis or ARDS, including coding variations in over 25 genes [10–12]. ARDS is most commonly precipitated by pneumonia or sepsis [9,13], resulting in massive neutrophil accumulation within the pulmonary vasculature [14]. Both over-exuberant or diminished innate immune response to bacterial products can worsen clinical outcomes, as the protective benefit of pathogen killing is balanced against the considerable injurious capacity of neutrophils [15,16]. Various stimuli may evoke complex “adaptive” responses to pathogens by neutrophils, by either decreasing (tolerance) or increasing (priming) activation [17,18]. Neutrophil function appears dysregulated in ARDS [19–26], and the potential exists that a beneficial adaptation to one microbe may place the host at a disadvantage against other infectious agents or inflammatory insults.
Viral infections can modify the immune response to subsequent bacterial infections [27–34], and thus could predispose to ARDS. A principal immune response to viral infections is production of the Type I interferons (IFNα and IFNβ), which are evoked by a broad range of viral factors, and in turn upregulate expression of interferon-stimulated genes (ISG) [35–39]. Hundreds of diverse ISG have been identified, with gene products which may act to reduce viral replication and release [40], or alternatively function as inflammatory cytokines [35,41,42]. However, ISG upregulation is neither sensitive nor specific for viral infection. Not all viral infections trigger the response, and certain intracellular bacteria or systemic autoimmune disorders have also been associated with IFNα/β release and ISG upregulation [35,43]. In animal models and human neutrophils, our group and others have reported elevated IFNα/β release and/or ISG expression is associated with impaired response to specific bacteria [43–48]. Conversely, severe bacterial-induced inflammation can suppress Type I IFN-regulated pathways, and certain viruses have acquired virulence factors that inhibit ISG [49–54].
Based on findings that ISG expression can modify the immune response, we hypothesized that both elevated and suppressed ISG expression could be associated with more severe outcomes in ARDS. Herein, we analyzed the range of neutrophil ISG expression in ARDS patients, and the correlation with clinical outcomes. Hierarchical clustering of neutrophil ISG demonstrated the presence of 3 distinct cohorts of subjects with High, Mid, or Low ISG expression. Three ISG with the greatest variability in expression were selected for expression analysis, and the association of these ISG expression levels with clinical outcome was prospectively tested at the onset of ARDS.
Material and Methods
Ethics Statement
The study protocol was approved by the Colorado Multiple Institutional Review Board (COMIRB) committee and the National Jewish Health Institutional Review Board. All subjects, or an appropriate proxy, gave written informed consent. The study was conducted in accordance with the Declaration of Helsinki.
Enrollment of healthy controls
Volunteers (n = 40) were administered an 18-point questionnaire to verify they were not experiencing any acute symptoms of a viral illness, did not have any recently diagnosed medical problems, vaccinations, underlying chronic conditions, or had recently received blood products. In addition, these healthy subjects were verified to have negative screening results for hepatitis B and HIV within 6 months of the blood collection. Vital signs checked on the day of the collection were within the normal range.
Subjects with ARDS used to characterize ISG
Peripheral blood neutrophils isolated from patients with sepsis-induced ARDS (n = 31) were used to establish ISG expression levels. Neutrophils were isolated within 24 hours of meeting criteria for ARDS criteria. Gene expression analysis from a subset of this cohort were previously reported in an analysis of HMGB1 and LPS induced patterns of gene expression in ARDS [55].
Whole transcriptome analysis of neutrophil ISG expression to characterize ISG expression
Samples were obtained from 31 patients and 19 healthy volunteers. Briefly, total RNA was stabilized in freshly isolated neutrophils by resuspension of 2x10⁷ cells in 1 ml of RNAlater (Ambion, Austin, Texas), then stored at –20°C. Subsequent isolation with Trizol (Life Technologies, Rockville, Md.) and purification with RNEasy MinElute columns (Qiagen, Valencia, Calif.) was performed following the manufacturer’s protocol. Between 1 and 5 μg of total RNA was used for microarray target labeling using standard methods for reverse transcription and one round of in vitro transcription [56]. HG-U133A microarrays were hybridized with 10 μg cRNA and processed per the manufacturer’s protocol (Affymetrix, Foster City, Calif.). Experiments for this study were performed as recommended by the Microarray Gene Expression Data society [57]. Individual arrays were determined to be of high quality [58] by: (a) visual inspection; (b) comparison of the overall fluorescence intensity (scaling factor) to other arrays in the group; and (c) low 3’/5’ ratios for GAPDH and β-actin (ratio < 3). This procedure insures that each of the arrays in the group can be directly compared, and that the input mRNA was intact. Single channel hybridization was performed per sample. The internal quality control for each hybridization included comparison of overall intensity across all arrays (intensity consistently varied within two standard deviations of the median intensity) and the integrity of the labeled target as determined by the ratio of hybridization intensity to 3’ and 5’ regions of GAPD and β-actin (3’/5’ ratios were less than 3 for all arrays). RNA quality was assessed by spectrophotometry (A260/A280> 1.8) and Agilent Bioanalyzer (28S/18S rRNA intensity > 1.5). Affymetrix Eukaryotic Hybridization Control mixture was employed as external control. The complete set of gene expression data has been deposited in the GEO database (www.ncbi.nlm.nih.gov/geo/, accession #GSE3037).
Analyses of gene expression in subjects to establish ISG variability
Gene expression analysis was performed using modules within MeV 4.6 [59]. Genes included in the “Type I Interferon-mediated Signaling Pathway Cluster” by the Gene Ontology Consortium (GO:0060337) were analyzed by Significance Analysis for Microarrays to eliminate genes whose expression did not vary between subjects and to detect those genes with significant variation between subjects. Hierarchical clustering was performed on this subset using Euclidean distance and complete linkage. Variability of gene expression was examined descriptively by comparing standard deviations, and principal Component Analysis was also performed on the genes using median centering. These analyses independently identified Mx1, ISG15, IFIT1, and IFIT3 as genes whose expression differences were the greatest between subjects. A three-gene panel including MX1, ISG15, and IFIT1 was used in subsequent analyses; IFIT3 was eliminated from further analyses because of the high similarity, known co-expression, and co-evolutionary origin between it and IFIT1.
Prospective evaluation of ISG expression from circulating neutrophils of ARDS patients
Circulating neutrophils of ARDS patients (n = 120) were isolated from patients enrolled into one of four NHLBI ARDS Network studies conducted at the University of Colorado affiliated hospitals, each with identical enrollment criteria. The parent studies were: Drug Study of Albuterol to Treat ALI (ALTA, ClinicalTrials.gov Identifier: NCT00434993)[60], Early Versus Delayed Enteral Feeding and Omega-3 Fatty Acid/Antioxidant Supplementation for Treating People With ALI or ARDS (EDEN-Omega Study: NCT00609180), or Early Versus Delayed Enteral Feeding to Treat People With ALI or ARDS (The EDEN Study: NCT00883948) [61,62], or Statins for Acutely Injured Lungs From Sepsis (SAILS: NCT00979121) [63]. The proportion of patients enrolled from each parent study was not different between the cohorts with High, Mid, or Low ISG expression (definitions for these groups described below)(Table 1). None of the interventions tested in the parent studies resulted in a treatment benefit [60–63]. The central inclusion criteria for all of these studies was ARDS, as defined by occurrence within a 24-hour time period of an acute onset of hypoxia (PaO2/FiO2<271 –adjusted for Denver altitude of 1600m), bilateral infiltrates by chest radiograph, and requirement for intubation and positive pressure ventilation in the absence of evidence for left-sided cardiac failure or other exclusionary criteria[60]. Sepsis was identified by standard criteria [64]. All patients enrolled into the parent ARDS Network studies were eligible for this ancillary study. All subjects were ventilated using the same protocol[60–62]. Peripheral blood samples were obtained 2.4±1.1 (mean±S.D.) days after ARDS criteria were met (2.6±1.2 days after intubation). Sample processing and data analysis was performed at NJH, with approval by the National Jewish Health Institutional Review Board. This ancillary trial was also registered in ClinicalTrials.gov (Identifier: NCT00548795). Diagnostic testing for acute or chronic viral infections was performed in the context of clinical care, and not as part of the study protocol. There were no common subjects between the two patient sets used in this study.
Table 1. ARDSNET study enrollment numbers (%) by ISG group.
| Study | Mid-range ISG (n = 82) | High ISG (n = 21) | Low ISG (n = 17) | Overall P-valuea |
|---|---|---|---|---|
| ALTA | 14 (17.1) | 5 (23.8) | 3 (17.7) | p = 0.72 |
| EDEN/OMEGA | 58 (70.7) | 15 (71.4) | 14 (82.4) | p = 0.64 |
| SAILS | 14 (17.1) | 1 (4.8) | 0 (0) | p = 0.09 |
aP-value corresponds to Fisher’s exact test for categorical variables comparing three groups.
Isolation of neutrophils and RNA from ARDS and healthy controls
Neutrophils were isolated from peripheral blood using the plasma Percoll method [65] in an identical fashion for healthy subjects and ARDS patients. Cells were confirmed to be >95% pure by visual inspection of cytospins. RNA was extracted immediately from 10–20 x 106 isolated neutrophils in the absence of ex vivo stimulation using TRIzol reagent [66].
PCR analysis of ISG expression
Gene expression in ARDS patients and healthy controls was quantified by real-time PCR of MX1, IFIT1, and ISG15 relative to GAPDH by the ΔCt method using standard conditions. Primers and probes were obtained from Applied BioSystems (MX1, Hs00182073_m1; ISG15, Hs00192713_m1; GAPDH Endogenous Control) and Roche (IFIT1, Universal Probe Library #9 and forward: 5’-AGAACGGCTGCCTAATTTACA-3’; reverse: 5’-GCTCCAGACTATCCTTGACCT-3’) as previously described [48]. Relative ISG expression was multiplied by 105 to convert all values greater than 1, and the mean of the log2 transformed expression values for each subject was calculated (S1 Dataset).
Determination of IFNα levels
IFNα levels were measured from plasma of ARDS patients (n = 111) using an ELISA from PBL Laboratories, as directed by the manufacturer. Plasma was isolated during the course of neutrophil isolation.
Data analysis of ISG groups
Because hierarchical clustering is less reliable for grouping samples when the number of variables is small, we divided groups based on deviation from the mean. Other methods to model high versus low ISG expression in ARDS patients were tested (sum of expression values, splitting into high, median and low ISG by quartiles, dichotomizing at the mean, dichotomizing at the median), but were found to have worse model fit by Akaike information criterion comparison (not shown). Overall group comparisons were made using ANOVA or Kruskal-Wallis tests for continuous variables and Fisher’s exact tests for categorical variables, as indicated in the text. Pairwise comparisons were made between the High and Mid-range and Low and Mid-range ISG groups when the corresponding overall test was significant. Ventilator-free and ICU-free days [67] were analyzed using linear regression. Twenty-eight day home with unassisted breathing and mortality and 90-day home with unassisted breathing and mortality were modeled using logistic regression. Cox proportional hazards models were used to model time to discharge to home and mortality outcomes. All regression and survival analyses were adjusted for gender, race, age and BMI. P-values corresponding to two-tailed tests that were less than 0.05 were considered statistically significant. Analyses were performed using SAS (Version 9.4, SAS Institute), and plotted using GraphPad Prism software.
Results
Transcriptional profiling of ISG expression in ARDS neutrophils
Genome-wide transcriptional profiles of circulating neutrophils isolated from patients with sepsis-induced ARDS (n = 31) and healthy controls (n = 19) was used to characterize ISG expression. Genes identified as the “Type I Interferon-mediated Signaling Pathway Cluster” by the Gene Ontology Consortium (GO:0060337) yielded 66 unique genes with available expression data. Significance Analysis for Microarrays determined that 31 genes were significantly changed between subjects. Using hierarchical clustering of expression, 3 distinct subject groups were identified. Both healthy controls and patients were found distributed in clusters of High and Mid ISG expression, while only ARDS patients were found within a cluster of Low ISG expression (Fig 1).
Fig 1. Transcriptome analysis to characterize ISG expression of ARDS patient and healthy control neutrophils.

(A) Log2-transformed expression of 31 unique transcripts within the Type I Interferon-mediated Signaling Pathway Cluster from neutrophils isolated from sepsis-induced ARDS patients (n = 31) and healthy volunteers (n = 19). ISG expression was ordered by hierarchical clustering (Euclidean distance with complete linkage), and contains only genes determined to significantly change between subjects. Three major clusters of subjects (columns) are broadly grouped as High ISG expression (left), Mid (middle) and Low (right). Subject groupings are represented by yellow (healthy) and blue (ARDS) blocks at the profile base. Only ARDS patients were contained within the Low ISG expression subject cluster. When these genes were ranked for extent of variance of expression using relative size of the standard deviation between subjects, the genes with the largest variance were identified as MX1, ISG15, IFIT1, and IFIT3 (identified by shading). (B) A Principal Component Analysis identified the same 4 genes that comprised nearly all of the variability between subjects in Panel A.
A test for variance was used to identify ISG that were representative of variability between subjects. When these genes were ranked for extent of variance of expression levels using relative size of the standard deviation between subjects, the genes with the largest variance were identified as MX1, ISG15, IFIT1, and IFIT3 (Fig 1A). Alternatively, when gene expression was examined by Principal Component Analysis to discern changes in variation, the same four previously identified genes were identified as a distinct cluster (Fig 1B). PC1 (accounting for 91.6% of the variability) appears to generally represent average expression across subjects (high expression at the low end). PC2 (accounting for 4.5% of the variability) appears to distinguish within gene variability, where genes with the highest variability in expression are at the low end.
ISG expression in neutrophils isolated from ARDS patients and healthy controls
A three-gene panel (MX1, ISG15, and IFIT1) identified as having the most variable expression (Fig 1) was used as a marker of neutrophil ISG expression in ARDS. IFIT3 was not further analyzed due to its high similarity, co-regulation, nearby chromosomal location, and co-evolutionary origin with IFIT1. We hypothesized that the variable expression of these genes would be associated with changes in clinical outcomes in ARDS. Relative expression level of each gene was determined prospectively by quantitative PCR of neutrophils isolated from ARDS patients (n = 120). The means of the transformed values of gene expression were normally distributed (Fig 2). Samples greater than one standard deviation above mean expression were designated as the “High” ISG expression cohort (n = 21), and the corresponding group of samples with ISG expression less than one standard deviation below the mean was designated as the “Low” ISG expression cohort (n = 17). Subjects falling within one standard deviation of the mean were designated as “Mid” ISG expression (n = 82) (Fig 2). ARDS patients in the test set were compared with healthy control subjects (n = 40) analyzed in an identical fashion. As with the first cohort, ISG expression of healthy controls was found to fall only within the High and Mid-ranges (Fig 2), while the Low-expressing cohort was confined to subjects with ARDS.
Fig 2. Classification of ARDS patients based on neutrophil ISG expression.

The mean of the transformed expression values of neutrophil MX1, IFIT1, and ISG15 is plotted for ARDS patients (triangle, n = 120) or healthy subjects (circle, n = 40). Subjects whose ISG expression was greater or less than one standard deviation from the mean were designated as High (red) or Low (blue) ISG expressers, respectively. ISG expression in healthy subjects overlapped only with the High and Mid cohorts of ARDS patients.
Patient characteristics at study enrollment
Demographic features and underlying medical conditions for ARDS patients were quite similar across cohorts at the time of enrollment (Table 2). Compared to the Mid cohort, patients with High and Low ISG expression were not different in age or gender. Within the High ISG cohort, 19% were identified as Black or African American, compared to 2.4% of the Mid cohort (pairwise P = 0.015). No differences in race or ethnicity were identified in the Low ISG cohort compared to Mid. BMI was significantly lower in the Low ISG cohort compared to the Mid cohort (pairwise P = 0.006). However, the Low ISG cohort did not have an increased frequency of identified pre-existing medical conditions. Patients with at least one identified underlying medical condition ranged from 63.4% to 71.4% across the three groups (Fisher’s test P = 0.80).
Table 2. Baseline characteristics of ARDS patients.
| Characteristic | Mid-range ISG (n = 82) | High ISG (n = 21) | Low ISG (n = 17) | Overall P-valuea |
|---|---|---|---|---|
| Male sex no. (%) | 45 (54.9) | 9 (42.9) | 9 (52.9) | P = 0.67 |
| Age in years (mean±S.D.) | 53.7±16.2 | 53.4±11.7 | 55.1±14.2 | P = 0.93 |
| White race no. (%) | 63 (76.8) | 14 (66.7) | 10 (58.8) | P = 0.23 |
| Black or African American no. (%) | 2 (2.4) | 4 (19.0) | 2 (11.8) | P = 0.01b |
| Hispanic no. (%) | 16 (19.5) | 6 (28.6) | 5 (29.4) | P = 0.45 |
| BMI (mean±S.D.) | 28.7±6.5 | 29.8±8.1 | 24.0±4.5 | P = 0.02c |
| Underlying Medical Conditions | ||||
| Any Medical Condition- no. (%) | 52 (63.4) | 15 (71.4) | 11 (64.7) | P = 0.80 |
| Chronic dialysis- no. (%) | 1 (1.2) | 1 (4.8) | 2 (11.8) | P = 0.06 |
| AIDS- no. (%) | 2 (2.4) | 2 (9.6) | 0 (0) | P = 0.23 |
| Leukemia- no. (%) | 0 (0) | 0 (0) | 0 (0) | P = 1.0 |
| Non-Hodgkin’s lymphoma- no. (%) | 0 (0) | 0 (0) | 0 (0) | P = 1.0 |
| Solid tumor w/ metastasis- no. (%) | 2 (2.4) | 1 (4.8) | 0 (0) | P = 0.68 |
| Immune suppression- no. (%) | 5 (6.1) | 4 (19.1) | 0 (0) | P = 0.06 |
| Hepatic failure- no. (%) | 2 (2.4) | 0 (0) | 0 (0) | P = 1.0 |
| Cirrhosis- no. (%) | 8 (9.8) | 3 (14.3) | 2 (11.8) | P = 0.74 |
| Diabetes Mellitus- no. (%) | 16 (19.5) | 5 (23.8) | 7 (41.2) | P = 0.17 |
| History of hypertension- no. (%) | 29 (35.4) | 8 (38.1) | 6 (35.3) | P = 0.96 |
| Prior myocardial infarction- no. (%) | 5 (6.1) | 1 (4.8) | 2 (11.8) | P = 0.64 |
| Peripheral vascular disease- no. (%) | 3 (3.7) | 1 (4.8) | 1 (5.9) | P = 0.81 |
| Prior stroke with sequelae- no. (%) | 1 (1.2) | 0 (0) | 2 (11.8) | P = 0.07 |
| Dementia- no. (%) | 3 (3.7) | 1 (4.8) | 1 (5.9) | P = 0.56 |
| Chronic pulmonary disease- no. (%) | 9 (11.0) | 2 (9.5) | 0 (0) | P = 0.49 |
| Arthritis- no. (%) | 4 (4.9) | 0 (0) | 0 (0) | P = 0.77 |
| Peptic ulcer disease- no. (%) | 3 (3.7) | 2 (9.5) | 0 (0) | P = 0.34 |
aP-value corresponds to overall ANOVA for continuous variables comparing three groups, and Fisher’s exact test for categorical variables comparing three groups.
b Significant difference between Mid-range and High ISG groups.
c Significant difference between Mid-range and Low ISG groups.
Identified risk factors for ARDS at presentation were also not different between the study groups (Table 3). The most common presenting injury was pneumonia, with a prevalence ranging from 71.9% to 76.5% between the three groups (Fisher’s test P = 0.95), followed by secondary sepsis (range 57.1% to 73.2%, Fisher’s test P = 0.33). No patient had primary trauma. Study enrollment occurred 2.4±1.1 days (mean±S.D.) after meeting ARDS criteria. Clinical and physiologic assessment made at this early time point demonstrated a divergence in disease severity (Table 4). While gas exchange as measured by the PaO2 to FiO2 ratio was not different between the three groups, the Glasgow Coma score (GCS) and the APACHE III score differed significantly, with the Mid group averaging a less severe score. GCS represented the major contributor to the observed difference within the APACHE III score.
Table 3. Injury etiology at initial presentation by ISG group.
| Primary physiological injury | Mid-range ISG (n = 82) | High ISG (n = 21) | Low ISG (n = 17) | Overall P-valuea |
|---|---|---|---|---|
| Pneumonia–primary | 59 (71.9) | 16 (76.2) | 13 (76.5) | P = 0.95 |
| Pneumonia–secondary | 8 (9.8) | 1 (4.8) | 2 (11.8) | P = 0.71 |
| Aspiration–primary | 6 (7.3) | 1 (4.8) | 2 (11.8) | P = 0.75 |
| Aspiration–secondary | 20 (24.4) | 3 (14.3) | 1 (5.9) | P = 0.18 |
| Multiple transfusions–primary | 3 (3.7) | 0 (0) | 0 (0) | P = 1.0 |
| Multiple transfusions–secondary | 5 (6.1) | 1 (4.8) | 0 (0) | P = 0.83 |
| Sepsis–primary | 10 (12.2) | 3 (14.3) | 2 (11.8) | P = 0.91 |
| Sepsis–secondary | 60 (73.2) | 12 (57.1) | 12 (70.6) | P = 0.33 |
aP-value corresponds to Fisher’s exact test for categorical variables comparing three groups.
Table 4. Physiologic assesment at enrollmenta by ISG group.
| ASSESSMENT | Mid-range ISG (n = 82) | High ISG (n = 21) | Low ISG (n = 17) | Overall P-valueb |
|---|---|---|---|---|
| Gas exchange | ||||
| PaO2/FiO2 | 107±40.8 | 104±45.1 | 128±53.1 | P = 0.16 |
| APACHE III score | 87.5±22.8 | 106.2±20.4 | 100.1±38.8 | P = 0.006c |
| Glasgow Coma Score | 8.3±2.8 | 5.7±2.6 | 8.0±3.1 | P = 0.002c |
aValues measured 2.4 ± 1.1 days (mean ± S.D.) after ARDS criteria met.
bP-value corresponds to overall ANOVA for continuous variables comparing three groups.
c Significant difference between Mid-range and High ISG groups.
Extremes in ISG expression are associated with decreased survival and greater disease severity
Outcomes for patients with High or Low ISG expression were compared with the Mid ISG cohort. High ISG expression was associated with worse outcomes, with fewer ventilator-free and ICU-free days over the first 28 days than the Mid cohort (pairwise P-values = 0.006 and 0.009, respectively Table 5). The fraction of patients discharged to home with unassisted breathing was significantly lower at 90 days for High ISG compared to Mid (pairwise P-value = 0.02, Table 5). Mortality was higher by 90 days for High ISG, with 33.3% reported as dead prior to discharge to home with unassisted breathing for High ISG, compared to 12.2% for the Mid ISG group (pairwise P-value = 0.04).
Table 5. Summary Statistics for Clinical Outcomes.
Elements in table are median (Q1-Q3) or number (percent) as indicated.
| Characteristic | Mid-range ISG (n = 82) | High ISG (n = 21) | Low ISG (n = 17) | Overall P-valuea |
|---|---|---|---|---|
| 28-day freeb | ||||
| Ventilation, median (Q1-Q3) | 18 (4–22) | 4 (0–18) | 2 (0–18) | P = 0.006c |
| ICU, mean, median (Q1-Q3) | 17 (6–22) | 1 (0–16) | 1 (0–14) | P = 0.02c |
| Home with unassisted breathing | ||||
| 2Day 28, No. (%) | 20 (24.4) | 6 (28.6) | 4 (23.5) | P = 0.95 |
| 2Day 90, No. (%) | 65 (79.3) | 11 (52.4) | 9 (52.9) | P = 0.01c |
| Mortality | ||||
| 2Day 28, No. (%) | 7 (8.5) | 4 (19.1) | 5 (29.4) | P = 0.04c |
| 2Day 90, No. (%) | 10 (12.2) | 7 (33.3) | 6 (35.3) | P = 0.02c |
aP-value corresponds to overall Kruskal-Wallis test for 28-day free data comparing three groups, and Fisher’s exact test for categorical variables comparing three groups
bNumber of days that patient is both alive and free of mechanical ventilation or ICU care for the first 28 days or first 90 days since start of mechanical ventilation or ICU care.
cSignificant pairwise P-values between Mid and High ISG groups and Mid and Low ISG groups are stated in the text.
Patients with Low ISG expression also demonstrated worse outcomes, similar in severity to the High ISG expression cohort, with fewer ICU-free days over the first 28 days compared to the Mid cohort (pairwise P-value = 0.02, Table 5). The fraction of patients discharged to home with unassisted breathing was lower at 90 days for Low ISG compared to Mid (pairwise P-value = 0.03, Table 5). Mortality was significantly increased at 28 days (pairwise P-value = 0.03), and by 90 days, with 35.3% reported as dead prior to discharge to home with unassisted breathing for Low ISG (P = 0.03 compared to Mid, Table 5).
Multivariate analysis of risk associated with extremes in ISG expression
After adjusting for gender, race, age and BMI, both High and Low ISG expression cohorts had significantly fewer days ventilation-free compared to the Mid ISG cohort (P-values = 0.002 for both comparisons, Table 6). Similarly, after adjusting for covariates, both High and Low ISG expression cohorts had significantly fewer days ICU-free compared to the Mid ISG cohort (P-value = 0.001 for both comparisons, Table 6). Multivariate analysis was not performed for APACHE III score, as it measures elements of disease severity likely associated with extremes in ISG expression.
Table 6. Estimated Differences And Odds Ratios For Adjusted Clinical Outcomes, Between High And Mid-Range Or Low- And Mid-Range ISG Groups.
All models adjusted for age, race (African American or other), gender and BMI.
| Characteristic | High ISG (n = 21) | Low ISG (n = 17) | Overall P-value |
|---|---|---|---|
| 28-day freea | |||
| Ventilation, mean difference (95% CI) | -7.00 (-11.38, -2.62) | -7.52 (-12.33, -2.71) | 0.0006c |
| ICU, mean difference (95% CI) | -7.02 (-11.32, -2.72) | -7.71 (-12.43, -2.98) | 0.0004c |
| Home with unassisted breathing b | |||
| 28 Day Period, odds ratio (95% CI) | 1.62 (0.52, 5.05) | 0.94 (0.26, 3.45) | 0.69 |
| 90 Day Period, odds ratio (95% CI) | 0.19 (0.06, 0.63) | 0.20 (0.06, 0.73) | 0.004c |
| Mortality b | |||
| Day 28, odds ratio (95% CI) | 2.83 (0.65, 12.33) | 4.23 (0.94, 18.97) | 0.12 |
| Day 90, odds ratio (95% CI) | 4.90 (1.37, 17.52) | 4.29 (1.11, 16.59) | 0.02c |
aFor 28-day free variables, mean differences are High or Low ISG group mean minus Mid-range ISG group mean; p-value corresponds to Type 3 analysis from linear regression model.
bFor home with unassisted breathing and mortality models, Odds Ratio are odds for High or Low ISG group relative to odds for Mid-range ISG group; P-value corresponds to Type 3 analysis from logistic regression model.
c Significant pairwise P-values between Mid and High ISG groups and Mid and Low ISG groups are stated in the text.
Patients’ status of being discharged home with unassisted breathing by day 90 was significantly different for High and Low ISG expression cohorts, compared to the Mid cohort (P-values = 0.006 and 0.01, respectively, Table 6). Patients’ 90 day mortality was significantly different for High and Low ISG expression cohorts, compared to the Mid cohort (p-values = 0.01 and 0.035, respectively, Table 6). In addition, time to discharge to home with unassisted breathing was significantly delayed in the High and Low cohorts compared to the Mid cohort (P-values = 0.006 and 0.004, respectively; p-values from Cox PH model)(Fig 3A). A survival analysis of time to mortality by day 90 was also significantly different for High and Low ISG expression cohorts, compared to the Mid cohort (P-values = 0.01 and 0.009, respectively, from Kaplan Meier analysis; adjusted P-values = 0.02 and 0.02, respectively, from Cox PH model) (Fig 3B).
Fig 3. Kaplan-Meier Analysis of 90-Day Discharge to Home with Unassisted Breathing and Survival.

(A) Proportion of patients confirmed to be discharged to home with unassisted breathing within 90 days of study enrollment. Overall log-rank P-value comparing groups was 0.009. After adjusting for age, race, gender and BMI, rate of discharge to home was significantly lower for both the High ISG (red line, P = 0.006) and Low ISG (blue line, P = 0.004; p-values from Cox PH model) expressing cohorts when compared to the Mid (black line). (B) Proportion of patients confirmed to be dead within 90 days of study enrollment. Overall log-rank P-value comparing groups was 0.01. After adjusting for age, race, gender and BMI, rate of death was significantly worse for both the High ISG (red line, P = 0.02) and Low ISG (blue line, P = 0.02; p-values from Cox PH model) expressing cohorts when compared to the Mid (black line).
Association of ISG expression with viral infection or circulating IFNα
Screening of patients for viral infection was not systemically performed. However, acute or chronic viral infections were identified in 15 subjects during clinical care, including H1N1 influenza (n = 6), HIV (n = 4), Hepatitis B (n = 1), Hepatitis C (n = 3), or H1N1 combined with Hepatitis C (n = 1). While 24% of the High ISG expression cohort had a confirmed viral infection, compared to 11% in the Mid ISG cohort and 5.9% in the Low ISG cohort, these differences were not significant (Fisher’s exact test P = 0.23)(Fig 4). We measured serum IFNα in patients as a possible surrogate to detect viral infection. At enrollment into this protocol, 52.4% of patients in the High ISG cohort had detectable IFNα in their circulation, which trended greater than patients in the Mid ISG cohort (26.3%) and the Low ISG cohort (33.3%, Fisher’s exact test P = 0.08)(Fig 4). The quantity of IFNα in circulation was highly variable, but greater in the High ISG cohort (median 13.3 pg/mL, range <0.1 to 544) compared to the Mid ISG cohort (median <0.1, range <0.1 to 1000, Kruskal-Wallis P = 0.009)(Fig 4).
Fig 4. Association of ISG expression with confirmed viral infections and circulating IFNα.
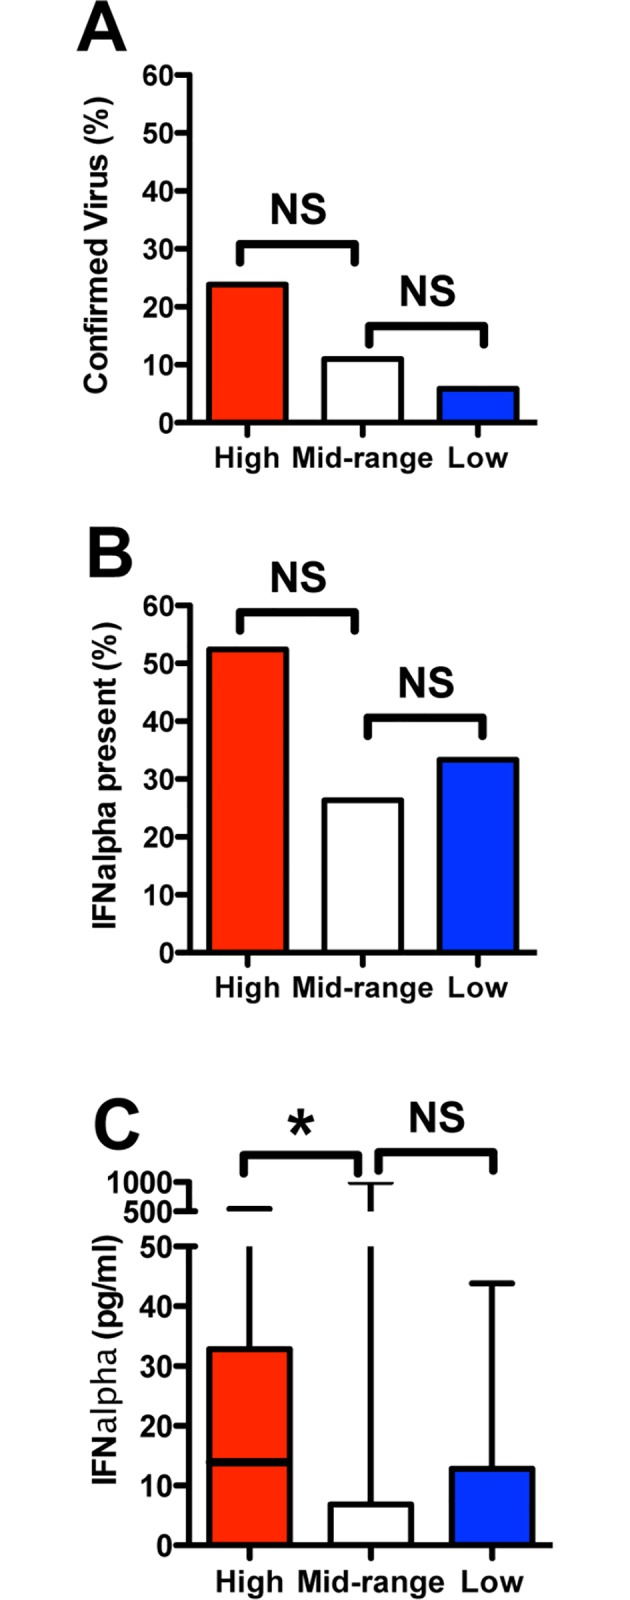
(A) The presence of a viral infection, as determined either through available medical history or within the course of clinical care, did not reach significance in the cohort with High ISG expression (5 of 21) compared to the Mid (8 of 82) and Low (1 of 17) cohorts (Fisher’s exact test P = 0.23). (B) Detection of circulating IFNα tended to occur more frequently within the High ISG cohort (11 of 21) compared to the Mid (20 of 76) and Low (5 of 15) cohorts, but this difference did not reach significance (Fisher’s exact test P = 0.08). (C) Levels of circulating IFNα trended higher within the High ISG cohort (n = 21) compared to the Mid (n = 76), (Kruskal-Wallis overall P-value = 0.03; High vs. Mid pairwise P = 0.009). n = 15 for the Low cohort. Plot depicts range (minimum≈0, maximum = upper whisker), 1st to 3rd quartile (box) and median (line).
Discussion
This single-center prospective study is the first known exploration of the clinical significance of systemic ISG expression in ARDS. In a preliminary set of patients (n = 31) we identified the ISGs that account for the greatest variability in expression. These genes (MX1, ISG15, IFIT1, and IFIT3) are prototypical ISGs, previously shown to be highly expressed in stimulated neutrophils [66,68,69], lymphocytes [37], peripheral blood mononuclear cells [38,39], and whole blood [70]. Using a panel of three of these unrelated genes in a non-overlapping cohort (n = 120), we found that ARDS patients with ISG expression greater or less than one standard deviation from the mean had significantly worse clinical outcomes. These data suggest the potential for immunomodulation as a result of ISG expression to affect ARDS outcomes. At the time of admission, these three cohorts were indistinguishable with regards to age, gender, co-existing medical conditions, or type of physiologic injury. Likewise, circulating white blood cell count or plasma levels of IL6 and TNFα showed no correlation with ISG levels (data not shown). Use of single genes over the 3-gene panel offered no distinction in the analyses.
Occurrence of elevated ISG expression in a subgroup of ARDS patients and healthy controls is not surprising. Acute and chronic viral infections are common within the population [52], and may remain undiagnosed or indolent. While a higher prevalence of acute or chronic viral infection were identified in the High ISG group of ARDS patients (Fig 4), most of the High ISG group were not known to have a co-existing viral infection. Conversely, patients with proven viral infections were also found (in lower percentages) in the Mid and Low ISG expression cohorts, underscoring the relatively poor correlation between clinically evident viral infections and systemic ISG expression. Although IFNα/β and ISG expression is indicative for viral infections, we have no evidence outside the confirmed cases that viral infection was responsible for ISG expression. IFNα/β is released into the circulation early after viral infections, and may be undetectable or present in very low quantities, even in experimental settings [36], a finding confirmed in this study. Thus direct testing for IFNα/β in the serum is not clinically useful. However, leukocyte ISG expression has been identified as a more sensitive marker of Type 1 IFN release [36]. ISG expression signatures have been proposed as a useful marker to distinguish between bacterial and viral infections [38], and even between specific viruses [39] as part of a paradigm shift to focus on host gene profiles to diagnosis infections rather than the traditional search for the pathogen [71]. Similarly, TLR4 activated IFNα/β production has been reported in human macrophages [72], and a sizeable subpopulation within the ARDS cohort were septic, suggesting that TLR4 activation could also be responsible for enhanced ISG expression. However, it is unknown if TLR4 mediates IFNα/β production by systemic cells, and ISG expression is equally elevated in some healthy subjects, suggesting that sepsis is not the major cause of ISG expression.
The association of worse clinical outcomes with High ISG expression in ARDS is supported by clinical observations and animal models that demonstrate viral infections increase susceptibility to secondary bacterial infections [27–34]. Primary or secondary bacterial infections precipitate an overwhelming majority of ARDS cases [10]. Previously, we reported that ARDS neutrophils with elevated ISG expression have an altered response to S. aureus, which included reduced p38 MAP kinase activation, attenuation of O2- generation and IL8 secretion, increased apoptosis, and impaired bacterial killing [48]. Others have reported IFNα/β release and ISGs expression promote anti-bacterial activity against select pathogens [44–47]. No demographic or clinical feature at study enrollment associated with worse outcomes in the High ISG expression compared with the Mid group, with the exception of a greater prevalence of African Americans in the High ISG group (19% vs 2.4%, P = 0.015). African Americans have been found to experience worse outcomes from ARDS [8]. However, multivariate analysis confirmed that ISG expression was still a risk factor after accounting for race in the High expression cohort.
The presence of a distinct subpopulation of ARDS patients with relatively inhibited ISG expression was seen in both cohorts of patients used in this study. Outcomes in this cohort were also worse than the Mid ISG group, without differences in demographic or clinical features. The Low ISG group had a normal BMI, which was significantly lower than the Mid group, who were on average overweight (mean±sd: 24.0±4.5 vs 28.7±6.5, P = 0.006). However, the prevalence of pre-existing medical conditions was not greater in the Low ISG subgroup, and differences in BMI within this range are not associated with changes in outcomes from ARDS [73]. Worse outcomes in ARDS patients with abnormally Low ISG expression is supported by a preponderance of data that indicate ISG expression is generally a protective mechanism[41]. In the absence of ISG-encoded products, the host is more vulnerable to sustained or recurrent viral infection[74]. While ISG expression is believed to be induced by anti-viral signals, it is of interest that the Low ISG cohort has levels of some ISG that are lower than in healthy subjects, particularly the genes identified as having the greatest expression variability. Increasingly, viruses have been identified with the capacity to suppress ISG expression through a variety of mechanisms, including strains of herpes simplex virus I [50], rhinovirus [51], hepatitis C [52,54] and pseudorabies virus [49]. A recent trial demonstrated a reduction in ARDS mortality associated with the administration of IFN-beta-1a[75], supporting our finding that a subpopulation of ARDS patients with high mortality has low ISG expression.
In conclusion, systemic ISG expression within the first days of ARDS onset is associated with disease severity and prognosis. This response should be considered along with other identified genetic, environmental, and complex demographic factors as a contributor to heterogeneity of ARDS outcomes. Other identified disease modifiers, such as age, race, or alcoholism [1–9], or coding variation in inflammatory response regulating genes [10–12], are generally chronic or permanent risk factors. Yet no risk factor is apparent in many ARDS patients, and the general lack of recurrent ARDS argues for the existence of transient risk factor(s). Up or downregulation in ISG expression could represents a “window” of vulnerability that places an otherwise healthy subject at increased risk for a period of days or weeks. This is a clinically plausible scenario in many patients, supported by analysis of mortality from respiratory failure during viral pandemics [28,29]. While ISG expression was assessed early after clinical presentation in this trial, cytomegalovirus reactivation may occur 1–2 weeks after hospitalization in critically ill patients [76], which could upregulate ISG expression later in ARDS. Longitudinal studies are needed to determine the duration of abnormal ISG expression in ARDS patients, and if late upregulation occurs with CMV reactivation. While ISG expression may be of prognostic value at the onset of ARDS, the potential exists for this marker to modify clinical care, either by alerting clinicians to the possibility of an unsuspected viral or autoimmune disease, or as a direct target for immunomodulation through administration of Type 1 interferons[75].
Supporting Information
(TXT)
Acknowledgments
The authors thank Meredith Mealer and the Colorado ARDSNet research coordinators for assistance with this project.
Data Availability
Data are included as Supporting Information (S1 Dataset) and at www.ncbi.nlm.nih.gov/geo/, accession #GSE3037.
Funding Statement
Funding provided by NIH R01HL090991 JAN, NIH P01 HL068743 MBS, NIH Z01 ES102005 (Intramural Research Program, NIEHS) MBS, NIH NHLBI ARDS Network MM, Cystic Fibrosis Foundation (NICK14G0) JAN and Rebecca Runyon Bryan Chair for Cystic Fibrosis.
References
- 1.Iribarren C, Jacobs DR Jr., Sidney S, Gross MD, Eisner MD (2000) Cigarette smoking, alcohol consumption, and risk of ARDS: a 15-year cohort study in a managed care setting. Chest 117: 163–168. [DOI] [PubMed] [Google Scholar]
- 2.Calfee CS, Matthay MA, Eisner MD, Benowitz N, Call M, Pittet JF, et al. (2011) Active and passive cigarette smoking and acute lung injury after severe blunt trauma. Am J Respir Crit Care Med 183: 1660–1665. 10.1164/rccm.201011-1802OC [DOI] [PMC free article] [PubMed] [Google Scholar]
- 3.Hudson L, Milberg J, Anardi D, Maunder R (1995) Clinical risk for development of the acute respiratory distress syndrome. Am J Respir Crit Care Med 151: 293–301. [DOI] [PubMed] [Google Scholar]
- 4.Moss M, Bucher B, Moore FA, Moore EE, Parsons PE (1996) The role of chronic alcohol abuse in the development of acute respiratory distress syndrome in adults. Jama 275: 50–54. [PubMed] [Google Scholar]
- 5.Milberg JA, Davis DR, Steinberg KP, Hudson LD (1995) Improved survival of patients with acute respiratory distress syndrome (ARDS): 1983–1993. Jama 273: 306–309. [PubMed] [Google Scholar]
- 6.Ely EW, Wheeler AP, Thompson BT, Ancukiewicz M, Steinberg KP, Bernard GR (2002) Recovery rate and prognosis in older persons who develop acute lung injury and the acute respiratory distress syndrome. Ann Intern Med 136: 25–36. [PubMed] [Google Scholar]
- 7.Kangelaris KN, Sapru A, Calfee CS, Liu KD, Pawlikowska L, Witte JS, et al. (2012) The association between a Darc gene polymorphism and clinical outcomes in African American patients with acute lung injury. Chest 141: 1160–1169. 10.1378/chest.11-1766 [DOI] [PMC free article] [PubMed] [Google Scholar]
- 8.Moss M, Mannino DM (2002) Race and gender differences in acute respiratory distress syndrome deaths in the United States: an analysis of multiple-cause mortality data (1979–1996). Crit Care Med 30: 1679–1685. [DOI] [PubMed] [Google Scholar]
- 9.Rubenfeld GD, Caldwell E, Peabody E, Weaver J, Martin DP, Neff M, et al. (2005) Incidence and outcomes of acute lung injury. N Engl J Med 353: 1685–1693. [DOI] [PubMed] [Google Scholar]
- 10.Matthay MA, Ware LB, Zimmerman GA (2012) The acute respiratory distress syndrome. J Clin Invest 122: 2731–2740. 10.1172/JCI60331 [DOI] [PMC free article] [PubMed] [Google Scholar]
- 11.Gao L, Barnes KC (2009) Recent advances in genetic predisposition to clinical acute lung injury. Am J Physiol Lung Cell Mol Physiol 296: L713–725. 10.1152/ajplung.90269.2008 [DOI] [PMC free article] [PubMed] [Google Scholar]
- 12.Arcaroli J, Fessler MB, Abraham E (2005) Genetic Polymorphisms And Sepsis. Shock 24: 300–312. [DOI] [PubMed] [Google Scholar]
- 13.Ware LB, Matthay MA (2000) The acute respiratory distress syndrome. N Engl J Med 342: 1334–1349. [DOI] [PubMed] [Google Scholar]
- 14.Abraham E (2003) Neutrophils and acute lung injury. Crit Care Med 31: S195–199. [DOI] [PubMed] [Google Scholar]
- 15.Lamb NJ, Gutteridge JMC, Baker C, Evans TW, Quinlan GJ (1999) Oxidative damage to proteins of BAL fluid in patients with ARDS: Evidence for neutrophil-mediated hydroxylation, nitration, and chlorination. Critical Care Medicine 27: 1738–1744. [DOI] [PubMed] [Google Scholar]
- 16.Borregaard N, Cowland JB (1997) Granules of the Human Neutrophilic Polymorphonuclear Leukocyte. Blood 89: 3503–3521. [PubMed] [Google Scholar]
- 17.Buckley JM, Wang JH, Redmond HP (2006) Cellular reprogramming by gram-positive bacterial components: a review. J Leukoc Biol 80: 731–741. [DOI] [PubMed] [Google Scholar]
- 18.Fan H, Cook JA (2004) Molecular mechanisms of endotoxin tolerance. J Endotoxin Res 10: 71–84. [DOI] [PubMed] [Google Scholar]
- 19.Lee KS, Choi YH, Kim YS, Baik SH, Oh YJ, Sheen SS, et al. (2008) Evaluation of bronchoalveolar lavage fluid from ARDS patients with regard to apoptosis. Respir Med 102: 464–469. [DOI] [PubMed] [Google Scholar]
- 20.Aggarwal A, Baker CS, Evans TW, Haslam PL (2000) G-CSF and IL-8 but not GM-CSF correlate with severity of pulmonary neutrophilia in acute respiratory distress syndrome. Eur Respir J 15: 895–901. [DOI] [PubMed] [Google Scholar]
- 21.Goodman RB, Strieter RM, Martin DP, Steinberg KP, Milberg JA, Maunder RJ, et al. (1996) Inflammatory cytokines in patients with persistence of the acute respiratory distress syndrome. Am J Respir Crit Care Med 154: 602–611. [DOI] [PubMed] [Google Scholar]
- 22.Lesur O, Kokis A, Hermans C, Fulop T, Bernard A, Lane D (2000) Interleukin-2 involvement in early acute respiratory distress syndrome: relationship with polymorphonuclear neutrophil apoptosis and patient survival. Crit Care Med 28: 3814–3822. [DOI] [PubMed] [Google Scholar]
- 23.Mascellino MT, Delogu G, Pelaia MR, Ponzo R, Parrinello R, Giardina A (2001) Reduced bactericidal activity against Staphylococcus aureus and Pseudomonas aeruginosa of blood neutrophils from patients with early adult respiratory distress syndrome. J Med Microbiol 50: 49–54. [DOI] [PubMed] [Google Scholar]
- 24.Martin TR, Pistorese BP, Hudson LD, Maunder RJ (1991) The function of lung and blood neutrophils in patients with the adult respiratory distress syndrome. Implications for the pathogenesis of lung infections. Am Rev Respir Dis 144: 254–262. [DOI] [PubMed] [Google Scholar]
- 25.Rivkind AI SJ, Littleton M, De Gaetano A, Mamantov T, Laghi F, Stoklosa JC. (1991) Neutrophil oxidative burst activation and the pattern of respiratory physiologic abnormalities in the fulminant post-traumatic adult respiratory distress syndrome. Circ Shock 33: 48–62. [PubMed] [Google Scholar]
- 26.Fialkow L, Fochesatto Filho L, Bozzetti MC, Milani AR, Rodrigues Filho EM, Ladniuk RM, et al. (2006) Neutrophil apoptosis: a marker of disease severity in sepsis and sepsis-induced acute respiratory distress syndrome. Crit Care 10: R155 [DOI] [PMC free article] [PubMed] [Google Scholar]
- 27.McNamee LA, Harmsen AG (2006) Both influenza-induced neutrophil dysfunction and neutrophil-independent mechanisms contribute to increased susceptibility to a secondary Streptococcus pneumoniae infection. Infect Immun 74: 6707–6721. [DOI] [PMC free article] [PubMed] [Google Scholar]
- 28.Brundage JF (2006) Interactions between influenza and bacterial respiratory pathogens: implications for pandemic preparedness. Lancet Infect Dis 6: 303–312. [DOI] [PMC free article] [PubMed] [Google Scholar]
- 29.Brundage JF, Shanks GD (2008) Deaths from bacterial pneumonia during 1918–19 influenza pandemic. Emerg Infect Dis 14: 1193–1199. 10.3201/eid1408.071313 [DOI] [PMC free article] [PubMed] [Google Scholar]
- 30.Metzger DW, Sun K (2013) Immune dysfunction and bacterial coinfections following influenza. J Immunol 191: 2047–2052. 10.4049/jimmunol.1301152 [DOI] [PMC free article] [PubMed] [Google Scholar]
- 31.Sun K, Metzger DW (2008) Inhibition of pulmonary antibacterial defense by interferon-gamma during recovery from influenza infection. Nat Med 14: 558–564. 10.1038/nm1765 [DOI] [PubMed] [Google Scholar]
- 32.Rothberg MB, Haessler SD, Brown RB (2008) Complications of viral influenza. Am J Med 121: 258–264. 10.1016/j.amjmed.2007.10.040 [DOI] [PMC free article] [PubMed] [Google Scholar]
- 33.Sellers TF Jr., Schulman J, Bouvier C, Mc CR, Kilbourne ED (1961) The influence of influenza virus infection on exogenous staphylococcal and endogenous murine bacterial infection of the bronchopulmonary tissues of mice. J Exp Med 114: 237–256. [DOI] [PMC free article] [PubMed] [Google Scholar]
- 34.McCullers JA (2006) Insights into the interaction between influenza virus and pneumococcus. Clin Microbiol Rev 19: 571–582. [DOI] [PMC free article] [PubMed] [Google Scholar]
- 35.Stetson DB, Medzhitov R (2006) Type 1 interferons in host defense. Immunity 25: 373–381. [DOI] [PubMed] [Google Scholar]
- 36.Roers A, Hochkeppel HK, Horisberger MA, Hovanessian A, Haller O (1994) MxA gene expression after live virus vaccination: a sensitive marker for endogenous type I interferon. J Infect Dis 169: 807–813. [DOI] [PubMed] [Google Scholar]
- 37.Halminen M, Ilonen J, Julkunen I, Ruuskanen O, Simell O, Makela MJ (1997) Expression of MxA protein in blood lymphocytes discriminates between viral and bacterial infections in febrile children. Pediatr Res 41: 647–650. [DOI] [PubMed] [Google Scholar]
- 38.Ramilo O, Allman W, Chung W, Mejias A, Ardura M, Glaser C, et al. (2007) Gene expression patterns in blood leukocytes discriminate patients with acute infections. Blood 109: 2066–2077. [DOI] [PMC free article] [PubMed] [Google Scholar]
- 39.Zaas AK, Chen M, Varkey J, Veldman T, Hero AO 3rd, Lucas J, et al. (2009) Gene expression signatures diagnose influenza and other symptomatic respiratory viral infections in humans. Cell Host Microbe 6: 207–217. 10.1016/j.chom.2009.07.006 [DOI] [PMC free article] [PubMed] [Google Scholar]
- 40.Metz P, Reuter A, Bender S, Bartenschlager R (2013) Interferon-stimulated genes and their role in controlling hepatitis C virus. J Hepatol 59: 1331–1341. 10.1016/j.jhep.2013.07.033 [DOI] [PubMed] [Google Scholar]
- 41.Schoggins JW, Wilson SJ, Panis M, Murphy MY, Jones CT, Bieniasz P, et al. (2011) A diverse range of gene products are effectors of the type I interferon antiviral response. Nature 472: 481–485. 10.1038/nature09907 [DOI] [PMC free article] [PubMed] [Google Scholar]
- 42.Pichlmair A, Reis e Sousa C (2007) Innate recognition of viruses. Immunity 27: 370–383. [DOI] [PubMed] [Google Scholar]
- 43.Parker D, Planet PJ, Soong G, Narechania A, Prince A (2014) Induction of type I interferon signaling determines the relative pathogenicity of Staphylococcus aureus strains. PLoS Pathog 10: e1003951 10.1371/journal.ppat.1003951 [DOI] [PMC free article] [PubMed] [Google Scholar]
- 44.Mancuso G, Midiri A, Biondo C, Beninati C, Zummo S, Galbo R, et al. (2007) Type I IFN signaling is crucial for host resistance against different species of pathogenic bacteria. J Immunol 178: 3126–3133. [DOI] [PubMed] [Google Scholar]
- 45.Carrero JA, Calderon B, Unanue ER (2004) Type I interferon sensitizes lymphocytes to apoptosis and reduces resistance to Listeria infection. J Exp Med 200: 535–540. [DOI] [PMC free article] [PubMed] [Google Scholar]
- 46.O'Connell RM, Saha SK, Vaidya SA, Bruhn KW, Miranda GA, Zarnegar B, et al. (2004) Type I interferon production enhances susceptibility to Listeria monocytogenes infection. J Exp Med 200: 437–445. [DOI] [PMC free article] [PubMed] [Google Scholar]
- 47.Kelly-Scumpia KM, Scumpia PO, Delano MJ, Weinstein JS, Cuenca AG, Wynn JL, et al. (2010) Type I interferon signaling in hematopoietic cells is required for survival in mouse polymicrobial sepsis by regulating CXCL10. J Exp Med 207: 319–326. 10.1084/jem.20091959 [DOI] [PMC free article] [PubMed] [Google Scholar]
- 48.Malcolm KC, Kret J, Young RL, Poch KR, Caceres SM, Douglas IS, et al. (2011) Bacteria-Specific Neutrophil Dysfunction Associated with Interferon-Stimulated Gene Expression in the Acute Respiratory Distress Syndrome. PLoS 6: e21958. [DOI] [PMC free article] [PubMed] [Google Scholar]
- 49.Brukman A, Enquist LW (2006) Suppression of the interferon-mediated innate immune response by pseudorabies virus. J Virol 80: 6345–6356. [DOI] [PMC free article] [PubMed] [Google Scholar]
- 50.Eidson KM, Hobbs WE, Manning BJ, Carlson P, DeLuca NA (2002) Expression of herpes simplex virus ICP0 inhibits the induction of interferon-stimulated genes by viral infection. J Virol 76: 2180–2191. [DOI] [PMC free article] [PubMed] [Google Scholar]
- 51.Kotla S, Peng T, Bumgarner RE, Gustin KE (2008) Attenuation of the type I interferon response in cells infected with human rhinovirus. Virology 374: 399–410. 10.1016/j.virol.2008.01.022 [DOI] [PubMed] [Google Scholar]
- 52.Kumthip K, Chusri P, Jilg N, Zhao L, Fusco DN, Zhao H, et al. (2012) Hepatitis C virus NS5A disrupts STAT1 phosphorylation and suppresses type I interferon signaling. J Virol 86: 8581–8591. 10.1128/JVI.00533-12 [DOI] [PMC free article] [PubMed] [Google Scholar]
- 53.Ivashkiv LB, Donlin LT (2014) Regulation of type I interferon responses. Nat Rev Immunol 14: 36–49. 10.1038/nri3581 [DOI] [PMC free article] [PubMed] [Google Scholar]
- 54.Bode JG, Brenndorfer ED, Haussinger D (2007) Subversion of innate host antiviral strategies by the hepatitis C virus. Arch Biochem Biophys 462: 254–265. [DOI] [PubMed] [Google Scholar]
- 55.Silva E, Arcaroli J, He Q, Svetkauskaite D, Coldren C, Nick JA, et al. (2007) HMGB1 and LPS induce distinct patterns of gene expression and activation in neutrophils from patients with sepsis-induced acute lung injury. Intensive Care Med. [DOI] [PubMed] [Google Scholar]
- 56.Golpon HA, Coldren CD, Zamora MR, Cosgrove GP, Moore MD, Tuder RM, et al. (2004) Emphysema lung tissue gene expression profiling. Am J Respir Cell Mol Biol 31: 595–600. [DOI] [PubMed] [Google Scholar]
- 57.Brazma A, Hingamp P, Quackenbush J, Sherlock G, Spellman P, Stoeckert C, et al. (2001) Minimum information about a microarray experiment (MIAME)-toward standards for microarray data. Nat Genet 29: 365–371. [DOI] [PubMed] [Google Scholar]
- 58.(2004) Expression profiling—best practices for data generation and interpretation in clinical trials. Nat Rev Genet 5: 229–237. [DOI] [PubMed] [Google Scholar]
- 59.Saeed AI, Sharov V, White J, Li J, Liang W, Bhagabati N, et al. (2003) TM4: a free, open-source system for microarray data management and analysis. Biotechniques 34: 374–378. [DOI] [PubMed] [Google Scholar]
- 60.Matthay MA, Brower RG, Carson S, Douglas IS, Eisner M, Hite D, et al. (2011) Randomized, placebo-controlled clinical trial of an aerosolized beta(2)-agonist for treatment of acute lung injury. Am J Respir Crit Care Med 184: 561–568. 10.1164/rccm.201012-2090OC [DOI] [PMC free article] [PubMed] [Google Scholar]
- 61.Rice TW, Wheeler AP, Thompson BT, Steingrub J, Hite RD, Moss M, et al. (2012) Initial trophic vs full enteral feeding in patients with acute lung injury: the EDEN randomized trial. Jama 307: 795–803. 10.1001/jama.2012.137 [DOI] [PMC free article] [PubMed] [Google Scholar]
- 62.Rice TW, Wheeler AP, Thompson BT, deBoisblanc BP, Steingrub J, Rock P (2011) Enteral omega-3 fatty acid, gamma-linolenic acid, and antioxidant supplementation in acute lung injury. Jama 306: 1574–1581. 10.1001/jama.2011.1435 [DOI] [PMC free article] [PubMed] [Google Scholar]
- 63.National Heart L, Blood Institute ACTN, Truwit JD, Bernard GR, Steingrub J, Matthay MA, et al. (2014) Rosuvastatin for sepsis-associated acute respiratory distress syndrome. N Engl J Med 370: 2191–2200. 10.1056/NEJMoa1401520 [DOI] [PMC free article] [PubMed] [Google Scholar]
- 64.Levy MM, Fink MP, Marshall JC, Abraham E, Angus D, Cook D, et al. (2003) 2001 SCCM/ESICM/ACCP/ATS/SIS International Sepsis Definitions Conference. Intensive Care Med 29: 530–538. [DOI] [PubMed] [Google Scholar]
- 65.Haslett C, Guthrie LA, Kopaniak M, Johnston RB Jr., Henson PM (1985) Modulation of multiple neutrophil functions by trace amounts of bacterial LPS and by preparative methods. Am J Pathol 119: 101–110. [PMC free article] [PubMed] [Google Scholar]
- 66.Malcolm KC, Arndt PG, Manos EJ, Jones DA, Worthen GS (2003) Microarray analysis of lipopolysaccharide-treated human neutrophils. Am J Physiol Lung Cell Mol Physiol 284: L663–670. [DOI] [PubMed] [Google Scholar]
- 67.Schoenfeld DA, Bernard GR, Network A (2002) Statistical evaluation of ventilator-free days as an efficacy measure in clinical trials of treatments for acute respiratory distress syndrome. Crit Care Med 30: 1772–1777. [DOI] [PubMed] [Google Scholar]
- 68.Fessler MB, Malcolm KC, Duncan MW, Worthen GS (2002) A Genomic and Proteomic Analysis of Activation of the Human Neutrophil by Lipopolysaccharide and Its Mediation by p38 Mitogen-activated Protein Kinase. J Biol Chem 277: 31291–31302. [DOI] [PubMed] [Google Scholar]
- 69.Wright HJ, Matthews JB, Chapple IL, Ling-Mountford N, Cooper PR (2008) Periodontitis associates with a type 1 IFN signature in peripheral blood neutrophils. J Immunol 181: 5775–5784. [DOI] [PubMed] [Google Scholar]
- 70.Landolt-Marticorena C, Bonventi G, Lubovich A, Ferguson C, Unnithan T, Su J, et al. (2009) Lack of association between the interferon-alpha signature and longitudinal changes in disease activity in systemic lupus erythematosus. Ann Rheum Dis 68: 1440–1446. 10.1136/ard.2008.093146 [DOI] [PubMed] [Google Scholar]
- 71.Ramilo O, Mejias A (2009) Shifting the paradigm: host gene signatures for diagnosis of infectious diseases. Cell Host Microbe 6: 199–200. 10.1016/j.chom.2009.08.007 [DOI] [PubMed] [Google Scholar]
- 72.Malcolm KC, Worthen GS (2003) Lipopolysaccharide stimulates p38-dependent induction of antiviral genes in neutrophils independently of paracrine factors. J Biol Chem 278: 15693–15701. [DOI] [PubMed] [Google Scholar]
- 73.Morris AE, Stapleton RD, Rubenfeld GD, Hudson LD, Caldwell E, Steinberg KP (2007) The association between body mass index and clinical outcomes in acute lung injury. Chest 131: 342–348. [DOI] [PubMed] [Google Scholar]
- 74.Sadler AJ, Williams BR (2008) Interferon-inducible antiviral effectors. Nat Rev Immunol 8: 559–568. 10.1038/nri2314 [DOI] [PMC free article] [PubMed] [Google Scholar]
- 75.Bellingan G, Maksimow M, Howell DC, Stotz M, Beale R, Beatty M, et al. (2014) The effect of intravenous interferon-beta-1a (FP-1201) on lung CD73 expression and on acute respiratory distress syndrome mortality: an open-label study. Lancet Respir Med 2: 98–107. 10.1016/S2213-2600(13)70259-5 [DOI] [PubMed] [Google Scholar]
- 76.Limaye AP, Kirby KA, Rubenfeld GD, Leisenring WM, Bulger EM, Neff MJ, et al. (2008) Cytomegalovirus reactivation in critically ill immunocompetent patients. JAMA 300: 413–422. 10.1001/jama.300.4.413 [DOI] [PMC free article] [PubMed] [Google Scholar]
Associated Data
This section collects any data citations, data availability statements, or supplementary materials included in this article.
Supplementary Materials
(TXT)
Data Availability Statement
Data are included as Supporting Information (S1 Dataset) and at www.ncbi.nlm.nih.gov/geo/, accession #GSE3037.