

Abstract
Endoplasmic reticulum (ER) stress has been shown to contribute to various metabolic diseases, including non-alcoholic fatty liver disease and type 2 diabetes. Reduction of ER stress by treatment with chemical chaperones or overexpression of ER chaperone proteins alleviates hepatic steatosis. Nonetheless, X-box binding protein 1s (XBP1s), a key transcription factor that reduces ER stress, has been proposed as a lipogenic transcription factor. In this report, we document that XBP1s leads to suppression of lipogenic gene expression and reduction of hepatic triglyceride and diacylglycerol content in livers of diet-induced obese and genetically obese and insulin-resistant ob/ob mice. Furthermore, we also show that PKCϵ activity, which correlates with fatty liver and which causes insulin resistance, was significantly reduced in diet-induced obese mice. Finally, we have shown that XBP1s reduces the hepatic fatty acid synthesis rate and enhances macrolipophagy, an initiating step in lipolysis. Our results reveal that XBP1s reduces hepatic lipogenic gene expression and improves hepatosteatosis in mouse models of obesity and insulin resistance, which leads us to conclude that XBP1s has anti-lipogenic properties in the liver.
Keywords: endoplasmic reticulum stress (ER stress), insulin resistance, liver, obesity, unfolded protein response (UPR)
Introduction
The increasing worldwide prevalence of obesity is considered one of the most serious public health problems of the 21st century (1, 2). Obesity is a predisposing factor for various metabolic disorders, including type 2 diabetes, cardiovascular disease, and non-alcoholic fatty liver disease (NAFLD)3 (3, 4). A subset of NAFLD patients develops non-alcoholic steatohepatitis, liver cirrhosis, and liver failure and eventually requires a liver transplantation (5–7). Additionally, NAFLD is highly associated with development of insulin resistance, and the vast majority of obese and type 2 diabetic patients are diagnosed with NAFLD (8, 9). Despite extensive efforts in the field, the underlying molecular mechanisms for NAFLD in obesity are poorly understood.
Endoplasmic reticulum (ER) stress, a condition in which ER homeostasis is disturbed by pathologies that include, but are not limited to, accumulation of misfolded proteins and overt nutrient supply, has been identified as an important player in the pathogenesis of metabolic diseases such as obesity, insulin resistance, and type 2 diabetes (10). ER stress leads to activation of the unfolded protein response (UPR), a complex signaling network that aims to resolve ER stress and restore ER homeostasis (11, 12). Inositol-requiring enzyme 1 (IRE1) is one of the three master modulators of UPR signaling. Together with PKR-like endoplasmic reticulum kinase and activating transcription factor 6 (ATF6), IRE1 senses ER luminal status and, accordingly, activates one of the most crucial signaling arms of the UPR. Activated IRE1 cleaves X-box binding protein 1 (XBP1) mRNA, leading to the formation of the spliced form of XBP1 (XBP1s), a highly active transcription factor and central regulator of ER homeostasis.
We have shown previously that nuclear translocation of XBP1s is severely impaired in the liver of obese and insulin-resistant mice (13). Reinstating the hepatic activity of XBP1s reduced ER stress and improved glucose homeostasis through mechanisms that are both dependent (14, 15) and independent of XBP1s transcriptional activity (16). This indicates that XBP1s is indispensable for the maintenance of glucose homeostasis in obesity. Indeed, XBP1 haplodeficiency led to the development of glucose intolerance and insulin resistance in HFD-fed BALB/c mice, a strain that is otherwise resistant to diet-induced insulin resistance (17).
Fatty livers of both obese rodents (17) and humans (18) have increased levels of ER stress. Importantly, alleviation of ER stress by chemical chaperone treatment (19) or overexpression of ER chaperone genes (20) reverses hepatic steatosis. Furthermore, pharmacological activation of ER stress results in hepatic steatosis in mice deficient in ER stress-sensing or ER quality control pathways (21, 22). Liver-specific IRE1α-null mice, which are deficient in XBP1s activity, have enhanced development of fatty liver upon pharmacological induction of ER stress (23). This suggests that XBP1s potentially serves a protective role in the development of hepatic steatosis. In contrast to these reports, which all indicate that increased ER stress promotes hepatic steatosis, it has been suggested that XBP1s, which is known to reduce ER stress and increase ER adaptive capacity, is a lipogenic transcription factor (24). Considering this discrepancy and also taking into account that XBP1s activity is reduced in mouse models of obesity and NAFLD (13), we sought to investigate the role of XBP1s in the development of NAFLD.
Results
XBP1s Reduces Hepatosteatosis in DIO Mice
To investigate the effect of XBP1s on hepatic steatosis, first C57Bl/6J mice were fed an HFD (45% kcal) for 12 weeks to induce obesity, insulin resistance, and NAFLD. Mice were then injected through the tail vein with a replication-incompetent adenovirus expressing XBP1s (adXBP1s) or LacZ (adLacZ) as a control. In line with our previous observations, 6-h fasted blood glucose levels were significantly reduced in adXBP1s-injected DIO mice compared with ad-LacZ injected controls (Fig. 1A). We next preformed a glucose tolerance test (GTT) by intraperitoneal injection of glucose on post-injection day 5. Glucose tolerance was significantly improved in adXBP1s-injected mice compared with the controls (Fig. 1B). Additionally, insulin-mediated reduction in blood glucose levels, as determined by insulin tolerance test (ITT) 7 days post-injection, was significantly improved in XBP1s-injected mice (Fig. 1C). Circulating plasma insulin levels were significantly lower than those of the control group (Fig. 1D), and homeostatic model assessment for insulin resistance was reduced by >60% (Fig. 1E) in adXBP1s-injected mice compared with the controls. Notably, these beneficial changes in glucose homeostasis were established independent of changes in food intake and body weight (Fig. 1, F and G). These results indicate that, in addition to the genetically obese and diabetic ob/ob mice (13–16), reinstatement of XBP1s action in the liver of DIO mice significantly improves glucose homeostasis.
FIGURE 1.

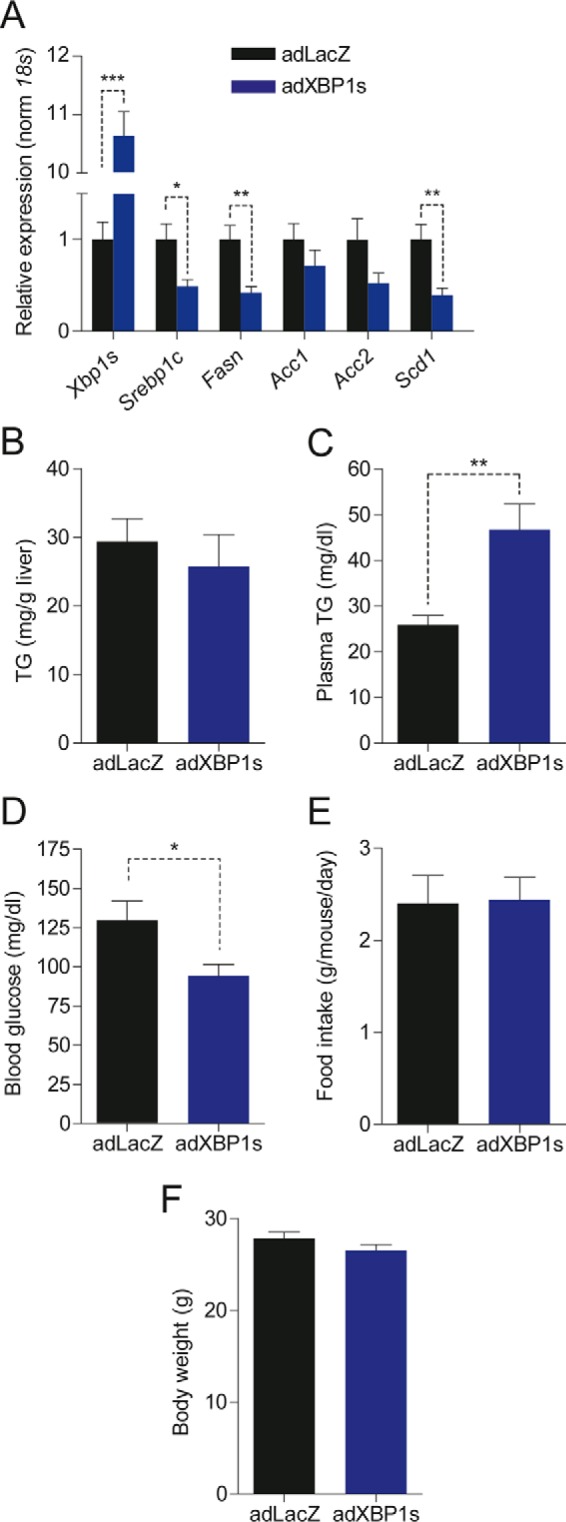
XBP1s reduces hepatic triglyceride content and lipogenic gene expression. C57BL6/J mice (3 weeks old) were fed an HFD (45% kcal) for 12 weeks and injected with adLacZ, adXBP1s, or ΔDBD-XBP1s (8*10E7 pfu/g) through the tail vein. A, blood glucose levels were assessed after 6 h of fasting on post-adenovirus injection day 9. B, a GTT with 1 g/kg glucose (i.p. injection) was performed on day 5 post-adenovirus injection. C, an ITT was performed on day 7 post-adenovirus injection by intraperitoneal insulin (0.75 IU/kg) injection. D, plasma insulin levels after 6-h fasting on day 9 post-adenovirus injection. E, homeostatic model assessment for insulin resistance as calculated from 6 h-fasted glucose levels and corresponding plasma insulin levels on day 9 post-adenovirus injection. F, average daily food intake (g/mouse/day) and G, body weight (g). H, relative hepatic mRNA levels of Xbp1s, Srebp1c, FasN, Acc1, Acc2, and Scd1 in livers of adLacZ and adXBP1s-injected mice. Gene expression was normalized using the 18s gene as a housekeeping gene. I and J, liver triglyceride content (I) and plasma triglyceride levels (J) were determined in 6 h-fasted mice on post-injection day 9. K, immunoblotting of XBP1s and FoxO1 in the nucleus and FasN in total homogenates of livers of LacZ and XBP1s-expressing mice. NUP98 was used as a loading control for nuclear lysates, whereas Tubulin served as a loading control for total liver lysates. Error bars are represented as mean ± S.E., and p values were determined by Student's t test or two-way analysis of variance testing with Bonferroni post-test for multiple comparison analysis (for GTT and ITT). *, p < 0.05; **, p < 0.01; ***, p < 0.001.
We then assessed the parameters of hepatic lipid metabolism in XBP1s-overexpressing mice versus the controls. Surprisingly, expression of key lipogenic genes, including sterol regulatory element-binding protein 1c (Srebp1c), fatty acid synthase (FasN), and stearoyl-CoA desaturase 1 (Scd1), were significantly reduced in the livers of adXBP1s-injected mice compared with the adLacZ-injected controls (Fig. 1H). Quantitative analysis revealed a 30% reduction in TG content in livers of XBP1s-injected mice compared with LacZ-injected controls (Fig. 1I). XBP1s expression, however, led to a significant increase in circulating TG levels (Fig. 1J), probably because of resolution of lipids from the liver to the circulation. Plasma and hepatic cholesterol levels were unaffected by XBP1s expression (Fig. S1, A and B). Protein levels of fatty acid synthase, a central enzyme in de novo lipogenesis, were significantly reduced (Fig. 1K). In line with our previous report in ob/ob mice (16), XBP1s expression led to exclusion of FoxO1 from the nucleus in the DIO model too (Fig. 1K).
XBP1s Reduces Hepatic Diacylglycerol Levels and Inhibits PKCϵ Translocation
TG in the liver are primarily formed through esterification of fatty acids (25). Diacylglycerol (DAG), which consists of a glycerol backbone with two fatty acyl groups, is an intermediate of the TG synthetic pathway and a TG precursor molecule. In addition, DAG is a potent second messenger signaling molecule with the potential to activate PKC family members (26). Although, in obesity and NAFLD, many lipid species accumulate ectopically (e.g. in the liver), there has been specific attention on hepatic DAG accumulation and intracellular DAG localization following reports that DAGs can directly facilitate insulin resistance in NAFLD by activating the novel PKC isoform ϵ (PKCϵ) (27–29). DAG-activated PKCϵ subsequently binds to the insulin receptor, thereby preventing downstream insulin-mediated signaling. Among the PKC isoforms, PKCϵ has been shown to be highly increased in NAFLD and to correlate strongly with hepatic DAG content both in rodents (26, 28) and humans (30). Furthermore, intracellular DAG levels and subsequent activation of PKCϵ have been put forward as reliable predictors of insulin resistance in fatty livers of obese patients (30, 31).
Considering that TG content was significantly reduced in the livers of adXBP1s-injected DIO mice, we investigated whether XBP1s could also reduce hepatic DAG levels. For this purpose, we first analyzed total DAG levels in the livers of adXBP1s- and adLacZ-injected DIO mice. We found that XBP1s expression led to a slight but not significant (p = 0.099) decrease in total hepatic DAG levels (Fig. 2A). However, when the DAG content of hepatic cytosolic and membrane compartments was analyzed, we observed a significant reduction in DAG levels in the cytosolic compartment of the livers of XBP1s-injected mice (Fig. 2A).
FIGURE 2.

XBP1s reduces hepatic diacylglycerol content and PKCϵ activity. C57Bl6/J mice were fed an HFD (45% kcal) for 12 weeks (starting at 3 weeks of age) and injected with adLacZ or adXBP1s (8*10E7 pfu/g) through the tail vein. A, DAG content was determined in in cytosolic (black columns) and membrane (gray columns) compartments in livers of 6 h-fasted mice on post-injection day 9. Total DAG content was calculated from the sum of cytosolic and membrane DAG content. B, relative mRNA levels of Pkrce. Gene expression was normalized using the 18s gene as a housekeeping gene. C, Western blotting analysis of PKCϵ protein in whole liver homogenates. Tubulin was used as a loading control. D, PKCϵ protein levels were determined in the cytosol (top panel) and membrane (bottom panel) compartments of livers of 6 h-fasted mice 9 days post-injection. GAPDH was used as a loading control for cytosolic lysate, whereas NaATPase served as a loading control for the membrane lysates. E, PKCϵ protein expression was quantified using densitometric analysis of the autoradiographical signal of PKCϵ in the membrane and cytosol. The membrane-to-cytosol (M/C) ratio as measure of PKCϵ activity is expressed in the graph. Hepatic DAG species were analyzed in the cytosol (F) and membrane (G) compartments of livers of adLacZ- and adXBP1s-expressing mice. Error bars are represented as mean ± S.E.; p values were determined by Student's t test. *, p < 0.05; **, p < 0.01; ***, p < 0.001; ns, not significant.
Although gene expression levels of Pkrce in livers of adXBP1s-injected mice were reduced compared with controls (Fig. 2B), total PKCϵ protein levels remained unaffected (Fig. 2C). Cellular localization of PKCϵ, which can be analyzed by the ratio of cytosolic to membrane PKCϵ, is an important determinant for PKCϵ activity (32, 33). Thus, we next analyzed PKCϵ levels in cytosolic and membrane compartments of livers of adXBP1s- and adLacZ-injected mice. Although PKCϵ levels were similar in cytosolic compartments of livers of adXBP1s-injected mice and their controls (Fig. 2D), the membrane content was significantly reduced in adXBP1s-injected mice (Fig. 2D). Therefore, the ratio of membrane/cytosolic PKCϵ was significantly reduced in adXBP1s-injected mice (Fig. 2E), indicating a decrease in PKCϵ activity.
Next we analyzed the levels of 13 different DAG species both in the cytosolic and membrane compartments by using LC/MS/MS in adLacZ- and adXBP1s-injected DIO mice. 10 of 13 analyzed DAG species were decreased in the cytosolic fraction of livers of XBP1s-expressing mice (Fig. 2F). 4 of 13 analyzed membrane DAG species were moderately but significantly increased in livers of XBP1s-expressing mice (Fig. 2G). Total ceramide levels remained unaffected; however, we observed differential regulation of various ceramide species in livers of XBP1s-expressing mice (Fig. S2, A and B).
These results establish a novel role for XBP1s in the regulation of hepatic DAG levels and PKCϵ activation. In addition, the results are suggestive of a regulatory role of XBP1s in glucose homeostasis through inhibition of PKCϵ activity as a result of reduced DAG content.
XBP1s Reduces the Hepatic Fatty Acid Synthesis Rate and Increases Macrolipophagy in ob/ob Mice
We next investigated whether the effects of XBP1s on the lipogenic gene expression profile seen in the DIO mouse model could be reproduced in obese and insulin-resistant ob/ob mice, which have severe accumulation of lipids in the liver. For this purpose, we injected adXBP1s or adLacZ into the tail vein of 10-week-old ob/ob mice. On post-injection day 9, we sacrificed the mice and extracted the livers for further investigation. Quantitative PCR analysis revealed significant reductions in the expression of lipogenic genes such as Acc1, Acc2, and FasN (Scd1 levels were reduced but without reaching statistical difference) in XBP1s-expressing ob/ob mice compared with the controls (Fig. 3A).
FIGURE 3.

Enhanced macrolipophagy in XBP1s-injected ob/ob mice. Leptin-deficient obese and diabetic ob/ob mice (10 weeks old) on a C57Bl6/J background were injected with adLacZ or adXBP1s (8*10E7 pfu/g) through the tail vein. A, relative hepatic mRNA levels of the lipogenic genes Acc1, Acc2, FasN, and Scd1 in livers of adLacZ- and adXBP1s-injected mice. Gene expression was normalized using the 18s gene as a housekeeping gene. B, livers were fixed and prepared for H&E staining. Pictures are representative sections of livers of adLacZ- and adXBP1s-injected mice (×4 magnification). C, liver triglyceride content was determined in 6 h-fasted mice on day 9 post-adenovirus injection. D, the hepatic fatty acid synthesis rate was determined by [3H2O] (2 mCi/mouse) injection on day 5 post-injection. Fatty acids were extracted and subsequently analyzed by TLC. The rate of hepatic fatty acids was calculated as the amount of [3H] incorporated into fatty acids per gram of tissue per hour. E, plasma triglyceride levels were determined in 6 h-fasted mice on day 9 post-adenovirus injection. F, livers of 6 h-fasted mice were fixed for electron microscopy analysis on day 9 post-adenovirus injection. Pictures are representative electron microscopic images of lipid droplets in the liver of adXBP1s and adLacZ-injected mice. G, Western blotting analysis of ATG5 protein in whole liver homogenates. Tubulin was used as a loading control (top panel). ATG5 and tubulin protein expression levels were quantified using densitometric analysis and expressed as a ratio ATG5/tubulin in adLacZ and adXBP1s-injected mice (bottom panel). H, Western blotting analysis of LC3IIB and ADRP (as a control) protein levels in isolated lipid droplets from livers of adLacZ and adXBP1s-expressing mice. Note that each lane contains proteins isolated from lipid droplets of one ob/ob mouse liver (top panel). LC3BII and ADRP protein expression levels were quantified using densitometric analysis and expressed as a ratio of LC3BII/ADRP in adLacZ- and adXBP1s-injected mice (bottom panel). Error bars are represented as mean ± S.E.; p values were determined by Student's t test. *, p < 0.05; **, p < 0.01; ***, p < 0.001.
The above findings indicate that XBP1s is able to reduce lipogenic gene expression in a diet-induced and a genetic model of obesity and insulin resistance in mice. Most of the effects of XBP1s on metabolic homeostasis have been attributed to the ability of XBP1s to act as a transcription factor by directly binding to the DNA, thereby regulating gene expression. To assess whether the DNA-binding capacity of XBP1s was a prerequisite to mediate the reduction in lipogenic gene expression, we tested whether a DNA-binding-defective mutant XBP1s (ΔDBD-XBP1s) could recapitulate the effects on lipogenic gene expression. Using an adenovirus-mediated approach, we expressed LacZ, wild-type XBP1s, and ΔDBD-XBP1s, in which the DNA-binding domain was replaced with an artificial nuclear localization signal (16), in the liver of ob/ob mice. As anticipated, expression of wild-type XBP1s led to a significant induction of XBP1s-mediated UPR genes such as Erdj4, Grp58, and Grp78 (Fig. S3). However, as we reported previously, ΔDBD-XBP1s was unable to increase expression of these genes. In contrast to the chaperone expression profile, expression of lipogenic genes was reduced to the same extent in adXBP1s- and ΔDBD-expressing mice. This implies that the XBP1s-mediated reduction in lipogenic gene expression is independent of its DNA-binding capacity. We have shown previously that XBP1s, independent of its DNA-binding capacity, can directly interact with FoxO1 and promote its degradation in the 26S proteasome (16). We therefore postulate that the effect of XBP1s on lipogenic gene expression probably relies on direct interaction of XBP1s with lipogenic gene regulatory protein and its inhibition.
To further investigate the hepatic lipid phenotype in mice expressing adXBP1s, we next performed H&E staining to determine the histopathological changes in the livers. As shown in Fig. 3B, H&E staining documented that XBP1s reduced the number and size of the lipid droplets in the livers of XBP1s-expressing ob/ob mice compared with the controls. Quantitative analysis of hepatic TG content revealed a close to significant reduction in the livers of ob/ob mice expressing XBP1s (Fig. 3C).
Next we performed an in vivo lipogenesis assay to assess the hepatic fatty acid synthesis rate. For this, adXBP1s- and adLacZ-injected mice were injected i.p. with tritiated water (3H2O) as a chaser on post-injection day 5. Livers were excised for analysis of newly synthesized fatty acids 1 h after the injection. The results indicated that the hepatic fatty acid synthesis rate in adXBP1s-injected mice was significantly (40%) lower compared with the controls (Fig. 3D). XBP1s expression also increased plasma TG levels in ob/ob mice (Fig. 3E).
Based on the suggestive reduction in lipid droplet size observed in H&E-stained livers of XBP1s-injected mice, we decided to further investigate the lipid droplet morphology. Using an electron microscopy approach, we observed increased double membrane structures in the lipid droplets that were suggestive of autophagosome formation in adXBP1s-injected ob/ob mice compared with those in the control group (Fig. 3F). Degradation of lipid droplets through autophagy (also termed macrolipophagy) has been suggested as an important process in regulation of hepatic lipid metabolism (34). To investigate whether macrolipophagy was indeed increased in the livers of XBP1s-expressing mice, we first determined hepatic protein levels of autophagy gene 5 (ATG5), a protein with a crucial role in early-stage autophagosome formation and thus in lipid droplet breakdown. ATG5 levels were markedly increased in the livers of ob/ob mice expressing XBP1s compared with LacZ controls, which indicates increased autophagosome formation (Fig. 3G). During autophagy, the cytosolic form of microtubule-associated protein 1A/1B light chain 3 (LC3BI) is conjugated to phosphatidylethanolamine to form LC3BII, which is subsequently recruited to autophagosomal membranes. LC3BII subsequently mediates the degradation of autophagosomal content. To determine the level of LC3BII associated with lipid droplets, we isolated hepatic lipid droplets and analyzed LC3BII levels in this compartment. Lipid droplet-associated LC3BII was significantly increased in the livers of adXBP1s-injected ob/ob mice (Fig. 3H), which indicates enhanced autophagosome formation. These results suggest that XBP1s, in addition to reducing the hepatic lipogenic rate, enhances breakdown of the lipid droplets by promoting autophagy.
XBP1s Reduces Hepatic Lipogenic Gene Expression in Fructose-fed Mice
Our results indicate that XBP1s lowers hepatic lipogenic gene expression in DIO and ob/ob mice and exerts anti-lipogenic effects. These results contradict the conclusions from a previous study (24), which concluded that XBP1s increases lipogenesis in mice fed a highly lipogenic fructose diet. To assess the effect of XBP1s expression in a setting with a high lipogenic rate without the confounding effects of obesity and insulin resistance, we fed mice a 60% fructose diet for 4 weeks. As expected, high-fructose feeding significantly induced expression of lipogenic genes (Fig. S4A). Nevertheless, we did not observe the previously reported increase in Xbp1s gene expression levels in fructose-fed mice compared with chow-fed mice (24). After 4 weeks of fructose feeding, mice were injected with adXBP1s or adLacZ. XBP1s expression significantly reduced expression of the key lipogenic genes Srebp1c, FasN, and Scd1 and led to a non-significant reduction in Acc1 and Acc2 (Fig. 4A). However, in contrast to DIO and ob/ob mouse models, XBP1s overexpression in this setting did not reduce hepatic TG content (Fig. 4B). Notably, we again observed increased plasma TG levels in XBP1s-expressing, fructose-fed mice compared with the controls (Fig. 4C). Additionally, XBP1s-expressing mice had a significant reduction in blood glucose levels in this setting too (Fig. 4D). These alterations were achieved without changes in food intake or body weight (Fig. 4, E and F). Liver and plasma hepatic cholesterol levels were unaffected by XBP1s expression in high fructose-fed mice (Fig. S4, B and C).
FIGURE 4.
XBP1s reduces lipogenic gene expression in livers of fructose-fed mice. C57Bl6/J mice were fed a fructose diet for 4 weeks (starting at 8 weeks of age) and then injected with adLacZ or adXBP1s (8*10E7 pfu/g) through the tail vein. A, relative hepatic mRNA levels of Xbp1s, Srebp1c, FasN, Acc1, Acc2, and Scd1 livers of adLacZ- and adXBP1s-injected mice on day 9 post-adenovirus injection. Gene expression was normalized using the 18s gene as a housekeeping gene. B and C, liver triglyceride content (B) and plasma triglyceride levels (C) were determined in 6 h-fasted mice on day 9 post-adenovirus injection. D, blood glucose levels as determined in 6 h-fasted mice on day 9 post-adenovirus injection. E and F, average daily food intake (E) and body weight (F) in 6 h-fasted mice on day 9 post-adenovirus injection. Error bars are represented as mean ± S.E.; p values were determined by Student's t test. *, p < 0.05; **, p < 0.01; ***, p < 0.001.
Discussion
NAFLD is one of the most serious pathologies of obesity, and it is currently the most common liver disease worldwide (35, 36). There is a strong association between obesity and NAFLD, and around 90% of obese, type 2 diabetic patients are diagnosed with NAFLD (37). NAFLD and type 2 diabetes increase morbidity and mortality rates in the obese population and create a serious economic burden on affected societies (38–40). NAFLD significantly increases the incidence of liver cirrhosis and hepatocellular carcinoma in the obese population (41). Despite continuing efforts in the field, the available treatment regimens can only minimally reduce NAFLD, and better treatment modalities have not been developed because of the fact that the underlying molecular pathologies are poorly understood. Identifying the molecular mechanisms that lead to NAFLD is therefore of great importance.
We (14–16) and others (42, 43) have previously identified XBP1s as a crucial regulator of glucose homeostasis in obesity. XBP1s action is severely impaired in mouse models of obesity (13), and this relative “XBP1s deficiency” contributes to the development of sustained ER stress, pathological activation of UPR signaling (13), and, ultimately, to disturbed glucose homeostasis. Reducing ER stress with chemical chaperones in vivo or by reinstating XBP1s action reduces ER stress and improves glucose intolerance and insulin resistance (14, 15, 19, 20).
Increased ER stress in obesity has also been implicated in the development of hepatosteatosis (21, 22). Despite several previous reports indicating that a homeostatic ER condition is critical for the maintenance of hepatic lipid homeostasis in obesity (19–23) and that reduction of ER stress is an anti-lipogenic modification, XBP1s, which probably has the strongest capacity to reduce ER stress, was suggested as a lipogenic factor (24). These postulates created a serious dilemma in the field and scrutinized the possibility of development of therapeutic approaches to reactivate XBP1s in the liver to treat obesity-associated insulin resistance and type 2 diabetes.
Here we document that, contrary to previous suggestion, XBP1s is an anti-lipogenic protein and that increasing XBP1s activity reduces hepatic TG content in two different and relevant mouse models of obesity and NAFLD. Interestingly, the anti-lipogenic activity of XBP1s is mediated independently of its transcriptional activity. These results indicate that XBP1s creates the anti-lipogenic effect through a protein-protein interaction. It will require further research to unravel the underlying molecular mechanism of the anti-lipogenic activity of XBP1s.
Fatty liver results from increased de novo synthesis and uptake of fatty acids, which are subsequently esterified in TG, and reduced TG catabolism because of reduced lipolysis and export of TG to the circulation (9). XBP1s consistently induced plasma TG levels in all mouse models described in this manuscript. This is in line with previous reports showing that depletion of hepatic XBP1s reduced TG secretion (24, 44). We propose that enhanced breakdown of hepatic lipid droplets and reduction in hepatic TG storage leads to redistribution of lipids from the liver to the periphery, thereby contributing to the rise in plasma TG levels in DIO and ob/ob mice.
Macrolipophagy has been suggested previously as an initiating step in lipolysis (34). Indeed, electron microscopy experiments performed in this study also indicate that macrolipophagy is increased in XBP1s-overexpressing mice and are suggestive of increased breakdown of lipid droplets. Biochemical experiments have strengthened this conclusion. Increased ATG5 levels in liver homogenates and increased LC3BII levels in isolated hepatic lipid droplets further confirm that autophagy of lipid droplets was indeed increased in adXBP1s-injected mice. In response to starvation, LC3BII association with lipid droplets and subsequent initiation of macrolipophagy is increased in healthy, lean mice, and this process is blunted in DIO mice (34). Excess nutrient supply, such as prolonged HFD feeding, has been reported to reduce autophagy efficiency, thereby contributing to the development of ER stress and insulin resistance (45–47). The vicious cycle in which increased cellular lipid content impairs macrolipophagy, which then further reduces autophagic function, eventually leads to more lipid retention. It is important to note that XBP1s activity is severely reduced in the liver of obese mice (13), where there is pronounced NAFLD, compared with lean mice. Our results indicate that increased XBP1s activity interrupts this defective macrolipophagy cycle by reinstating macrolipophagic activity and potentially increasing fatty acid availability for redistribution to the periphery, as shown by increased plasma TG levels in adXBP1s-injected mice. Taken together, the electron microscopy and biochemical results obtained from analysis of ATG5 and LCB3II levels strongly support that XBP1s promotes lipid droplet breakdown in the liver.
In addition to lowering hepatic TG levels, XBP1s reduced hepatic DAG content in DIO mice. DAGs are second messengers that activate members of the novel PKC family of proteins (26). Intracellular compartmentalization of DAGs has been indicated to play a critical role in activation of PKCϵ (27–29, 32, 33). We report that DAGs are specifically reduced in the cytoplasmic compartment of livers of XBP1s-expressing mice. The concomitant reduction in PKCϵ activation suggests that XBP1s-mediated reduction in cytoplasmic DAGs impairs PKCϵ activation. PKCϵ has been reported to be enhanced in fatty livers of insulin-resistant rodents (28) and humans (30). Reduction of PKCϵ activity following reactivation of XBP1s is a further support for the anti-lipogenic actions of this transcription factor.
In humans, increased levels of hepatic DAG and PKCϵ protein levels have been associated with development of insulin resistance (30, 31). PKCϵ directly interacts with and inhibits insulin receptor kinase activity, and depletion of hepatic PKCϵ improves hepatic insulin action in HFD-fed rats (28). Pkrce−/− mice are resistant to HFD-induced insulin resistance (48), which further provides evidence for a link between PKCϵ action and development of insulin resistance. Reducing PKCϵ activation, as indicated by reduced cytoplasm-to-membrane translocation, is a novel mechanism for XBP1s to increase insulin sensitivity and thereby contribute to improved glucose homeostasis.
In fructose-fed mice, however, hepatic TG content remained unaffected by XBP1s expression despite significantly reduced lipogenic gene expression and enhanced plasma TG levels. It is interesting to note that we did not observe any alterations in Xbp1s levels during the high-fructose diet feeding, which indicates that isolated high-fructose diet feeding and development of fatty liver in this setting might not be associated with ER stress and XBP1s. Furthermore, the underlying core mechanism(s) for development of NAFLD under isolated high-fructose diet feeding could be overcoming the anti-lipogenic effects of XBP1s, even if XBP1s is exogenously activated in this setting. Thus, we conclude that lack of ER stress, obesity, and insulin resistance in fructose-fed mice versus DIO and ob/ob mice explains the lack of effect of XBP1s in this model.
Collectively, our results indicate that XBP1s is an anti-lipogenic protein and that hepatic reactivation of XBP1s in obesity does not create fatty liver but, on the contrary, reduces NAFLD in mice. Approaches that aim to reactivate XBP1s in the liver will therefore reveal crucial insights for the development of therapeutic options for XBP1s-mediated regulation of NAFLD.
Experimental Procedures
Reagents
XBP1, PKCϵ, GAPDH, ADRP, and HRP-conjugated goat anti-mouse and goat anti-rabbit antibodies were purchased from Santa Cruz Biotechnology (Santa Cruz, CA). FoxO1, NUP98, FasN, LC3B, NaATPase, and α-tubulin antibodies were from Cell Signaling Technology (Beverley, MA). ATG5 antibody was from Novus Biologicals (Littleton, CO). Free glycerol reagent and the serum triglyceride determination kit were from Sigma-Aldrich (St. Louis, MO). Infinity total cholesterol reagent was from Fisher Scientific (Waltham, MA). The detergent-compatible protein assay kit, SYBR Green Supermix, and cDNA synthesis kit were from Bio-Rad. BM chemiluminescence blotting substrate was from Roche. The ultra-sensitive mouse insulin ELISA kit was from Crystal Chem.
Adenovirus Production and Injection
Adenovirus was generated using the ViraPower adenoviral expression system (Invitrogen) as described previously (13). Crude adenovirus was amplified, CsCl-purified, and titrated by Vector Biolabs (Malvern, PA). Prior to injection, the adenovirus was thawed at room temperature, and injection solutions were prepared in 100 μl of sterile NaCl (8*10E7 pfu/g). Mice were restrained in a restrainer, and adenovirus was injected through the tail vein using a 28-gauge needle. Mild pressure was applied on the site of injection to prevent backflow of the injected solution.
Animals and Diets
Wild-type C57BL6/J and leptin-deficient ob/ob mice (on a C57BL6/J background) were purchased from The Jackson Laboratory (Bar Harbor, ME). Mice were housed in a temperature-controlled, air-conditioned, and specific pathogen-free animal facility at Boston Children's Hospital. Mice were housed in groups (5 mice/cage) and maintained on a 12:12-h light/dark cycle (lights on at 7 a.m.). Diet-induced obesity was established by feeding wild-type mice a high-fat diet (HFD) (45% kcal, Research Diets Inc., New Brunswick, NJ) for 12 weeks prior to starting the experiments. A fructose diet (60% kcal, TD 00202, Teklad, Harlan Laboratories, Madison, WI) was provided for 4 weeks prior to starting the experiments. The HFD and especially the fructose diet are hygroscopic and were therefore fully replaced every week. Ob/ob mice were fed standard laboratory chow. Mice had ad libitum access to food and water. All animal experiments were approved by the Animal Care and Use Committee of Boston Children's Hospital.
Glucose and Insulin Tolerance Test
For glucose tolerance testing, mice were fasted overnight (7p.m. to 8 a.m.). Blood glucose was measured from the tail vein prior to an i.p. injection of 1 g/kg d-glucose in 200 μl of sterile NaCl. Glucose levels were measured from the tip of the tail using a glucometer (Bayer) at indicated time points. For insulin tolerance testing, food was removed for 6 h (8 a.m. tp 2 p.m.). Blood glucose was measured from the tip of the tail prior to an i.p. injection of 0.75 IU/kg insulin (recombinant human insulin, Eli Lilly) in 200 μl of sterile NaCl. Glucose levels were measured from the tip of the tail at indicated time points.
Blood and Tissue Collection
Mice were terminated by cardiac puncture under isoflurane anesthesia after a 6-h fast (8 a.m. to 2 p.m.). Blood was collected in heparin-coated tubes and kept on ice until centrifugation (8000 × g, 4 °C, 20 min). Plasma was aliquoted and used for analysis immediately or stored at −80 °C. Tissues were quickly excised and snap-frozen in liquid nitrogen or fixed for microscopic analysis.
Electron Microscopy
Fresh liver was cut and immediately fixed in 2.5% glutaraldehyde-buffered solution at room temperature for 2 h and then at 4 °C overnight. After washing with PBS three times, tissues were post-fixed in 2% OsO4, dehydrated, and infiltrated. Samples were sectioned and photographed at the Electron Microscopy/Plastic Core at the Joslin Diabetes Center (Boston, MA).
H&E Staining
Fresh liver was cut and immediately fixed in 10% buffered formalin at 4 °C overnight. Tissues were paraffin-embedded, cut, and mounted onto glass slides prior to H&E staining according to the standard protocol of the Rodent Histopathology Core Facility of Harvard Medical School (Boston, MA).
Tissue Lysis and Western Blotting
Liver tissue (∼75 mg) was homogenized in ice-cold lysis buffer (25 mm Tris-HCl (pH 7.4), 100 mm NaF, 50 mm Na4P2O7, 10 mm Na3VO4, 10 mm EGTA, 10 mm EDTA, 1% Nonidet P-40, 2 mm PMSF, and protease inhibitor mixture) using a TissueLyserII (Qiagen). Homogenates were incubated on ice for 20 min and centrifuged at 16,100 × g at 4 °C for 1 h. The lipid layer was carefully removed, and supernatants were centrifuged for another hour (16,100 × g, 4 °C). Samples were denatured in 1× Laemmli buffer by boiling at 100 °C for 5 min. Nuclear proteins were extracted from 100 mg of liver tissue using a commercially available kit (NE-PER nuclear and cytoplasmic extraction kit, Fisher Scientific) according to the protocol of the manufacturer. Equivalent amounts of proteins from each sample were resolved by SDS-PAGE and then electrotransferred onto PVDF membranes. The membranes were blocked in 10% blocking reagent provided with BM chemiluminescence blotting substrate (peroxidase) in TBS (pH 7.4) for 1 h at room temperature. The membranes were subsequently incubated with primary antibody in 5% blocking reagent (in TBS Tween (pH 7.4)) overnight at 4 °C. Membranes were washed three times for 20 min in TBST and incubated with secondary antibody in 5% blocking reagent (in TBS Tween (pH 7.4)) for 1 h at room temperature. After extensive washing, the blots were developed using a chemiluminescence assay system (Roche) and exposed to Kodak films. The membranes were stripped in stripping buffer (62.5 mm Tris-HCl (pH 6.7), 2% SDS, and 100 mm 2-mercaptomethanol) at 50 °C for 20 min under vigorous shaking. Densitometry using ImageJ software (National Institutes of Health) was conducted for protein quantification on the immunoblots.
Plasma and Liver Lipid Analysis
Plasma triglycerides and cholesterol were measured using commercially available colorimetric reagents (Wako, Richmond, VA). Neutral lipids were isolated from liver homogenates (75 mg of tissue in 1 ml of 50 mm NaCl) using chloroform/methanol (2:1 v/v).The interphase was washed with 50 mm NaCl once, and aliquots of the organic phase were supplemented with 10% Triton X-100 (Sigma) and dried. Triglyceride and cholesterol content was measured on the dried pellet directly using commercially available colorimetric reagents (Wako). DAG and ceramide were isolated from 100 mg of liver and prepared for LC/MS/MS analysis as described previously (49). Total DAG and ceramides were calculated from the sum of individual species.
In Vivo Fatty Acid Synthesis Assay
The fatty acid synthesis rate was determined using a protocol described previously with minor modifications (50, 51). Randomly fed mice were weighed and intraperitoneally injected with 2 mCi [3H2O] as a chaser. 1 h after chaser injection, the liver was harvested, briefly dried, weighed, and snap-frozen in liquid nitrogen. Liver tissues were incubated in 2.5 m KOH at 75 °C for 2 h. After cooling down to room temperature, 2 volumes of 80% ethanol and 4 volumes of hexane were added to the samples and mixed completely. The mixture was separated by centrifugation, and the aqueous phase was saved. After acidification with 3 m H2SO4, fatty acids were extracted from the aqueous phase using hexane and washed with 50 mm H2SO4 twice. Fatty acids were nitrogen-dried and solubilized in 500 μl of chloroform. Samples were loaded onto TLC plates with hexane:diethyl ether:glacial acetic acid (70:20:10 v/v/v) as liquid phase. Fatty acid spots on the TLC plates were visualized in iodine vapor and cut out for liquid scintillation measurements. The rate of hepatic fatty acids was calculated as the amount of [3H] incorporated into fatty acids per gram of tissue per hour.
Protein Isolation from Liver Lipid Droplets
One entire ob/ob mouse liver was used to extract lipid droplet proteins for each sample using an adapted protocol (34). Livers were homogenized in 0.25 m sucrose supplemented with protease inhibitors on ice. Liver lysates were centrifuged at 6800 × g at 4 °C for 10 min, and supernatants were centrifuged again at 17,000 × g at 4 °C for 10 min. Supernatants and fatty layer were collected and adjusted to 20% sucrose in a hypotonic lysis buffer (20 mm Tris-HCl (pH 7.4) and 1 mm EDTA) and subjected to gradient centrifugation at 28,000 × g at 4 °C for 30 min. Fatty layers containing lipid droplets were collected and delipidated with organic solvents. Briefly, lipid droplets were mixed with 10 volumes of acetone prechilled at −80 °C and incubated at −20 °C overnight. Following centrifugation at 4300 × g at 4 °C for 1 h, pellets were washed with 10 volumes of acetone, 10 volumes of 1:1 acetone/ether, and 10 volumes of ether sequentially. Dried pellets were thoroughly resuspended in sample buffer (130 mm Tris-HCl (pH 6.8), 4% SDS, and 4% 2-mercaptoethanol) and incubated at 60 °C for 5 h in a sonicating water bath. Dissolved samples were centrifuged at 18,500 × g at room temperature for 10 min, and supernatants were analyzed by Western blotting.
Reverse Transcription and Quantitative Real-time PCR
Total RNA was extracted using QIAzol reagent (Qiagen, Valencia, CA). 1 μg of RNA was reverse-transcribed to cDNA using a cDNA synthesis kit (Bio-Rad) under the following conditions: 25 °C for 5 min, 42 °C for 30 min, and 85 °C for 5 min. Transcripts were diluted 20 times, and QPCR analysis was performed using 4 μl of cDNA. Gene expression was analyzed using SYBR Green Supermix (Bio-Rad) on an iQ5 multicolor real-time PCR detection system (Bio-Rad) using the following primers: 18s rRNA forward, 5′-AGT CCC TGC CCT TTG TAC ACA-3′; 18s rRNA reverse, 5′-CGA TCC GAG GGC CTC ACT A-3′; Xbp1s forward, 5′-GGT CTG CTG AGT CCG CAG CAG G-3′; Xbp1s reverse, 5′-AGG CTT GGT GTA TAC ATG G-3′; Pkrce forward, 5′-GAG GAC TGG ATT GAC CTG GA-3′; Pkrce reverse, 5′-ATC TCT GCA GTG GGA GCA GT-3′; Srebp1c forward, 5′-GCG GTT GGC ACA GAG CTT-3′; Srebp1c reverse, 5′-GGA CTT GCT CCT GCC ATC AG-3′; Acc1 forward, 5′-ATT GGG CAC CCC AGA GCT A-3′; Acc1 reverse: 5′-CCC GCT CCT TCA ACT TGC T-3′; Acc2 forward, 5′-GGG CTC CCT GGA TGA CAA C-3′; Acc2 reverse, 5′-TTC CGG GAG GAG TTC TGG A-3′; FasN forward, 5′-GGA GGT GGT GAT AGC CGG TAT-3′; FasN reverse, 5′-TGG GTA ATC CAT AGA GCC CAG-3′; Scd1 forward, 5′-AGA TCT CCA GTT CTT ACA CGA CCA C-3′; Scd1 reverse, 5′-GAC GGA TGT CTT CTT CCA GGT G-3′; Dgat2 forward, 5′-TTC CTG GCA TAA GGC CCT ATT-3′; Dgat2 reverse, 5′-AGT CTA TGG TGT CTC GGT TGA C-3′; Erdj4 forward, 5′-GCA ATG GGA GTC CTT TTG AA-3′; Erdj4 reverse, 5′-CCT GGA AGT GAT GCC TTT GT-3′; Grp58 forward, 5′-TAT GAT GGG CCTA GGA CTG C-3′; Grp58 reverse, 5′-TGC TGG CTG CTT TTA GGA AT-3′; Grp78 forward, 5′-AGT GGT GGC CAC TAA TGG AG-3′; and Grp78 reverse, 5′-CAA TCC TTG CTT GAT GCT GA-3′.
Statistical Analysis
Data are presented as mean ± S.E. Statistical significance was calculated using two-tailed Student's t test or two-way analysis of variance testing with Bonferroni post-test for multiple-comparison analysis (for GTT and ITT) and was accepted at *, p < 0.05; **, p < 0.01; and ***, p < 0.001.
Author Contributions
Conceptualization, H. H. and U. O.; Methodology, H. H., Y. Z., G. I. S., and U. O.; Investigation, H. H., Y. Z., D. Z., J. L., and M. A. S. H.; Writing—Original Draft, H. H. and U. O.; Writing—Review & Editing, H. H., G. I. S., and U. O.; Supervision, H. H. and U.O.; Funding Acquisition, U. O.
Supplementary Material
Acknowledgments
We thank Drs. Jonathon N. Winnay and C. Ronald Kahn (Joslin Diabetes Center, Harvard Medical School) for assistance with the in vivo fatty acid synthesis assay.
This work was supported by funds from the Department of Medicine, Boston Children's Hospital (to U. O.); National Institutes of Health Grants R01DK081009 and R01DK098496 (to U. O.), R01 DK-40936, and U24 DK-059635; and by American Diabetes Association Career Development Grant 7-09-CD-10. U. O. is a scientific founder, shareholder, and member of the scientific advisory board and board of directors of ERX Pharmaceuticals, Inc. The content is solely the responsibility of the authors and does not necessarily represent the official views of the National Institutes of Health.

This article contains supplemental Figures S1–S4.
- NAFLD
- non-alcoholic fatty liver disease
- ER
- endoplasmic reticulum
- UPR
- unfolded protein response
- HFD
- high-fat diet
- DIO
- diet-induced obese
- GTT
- glucose tolerance test
- ITT
- insulin tolerance test
- TG
- triglyceride(s)
- DAG
- diacylglycerol
- ADRP
- adipose differentiation-related protein.
References
- 1. Flegal K. M., Carroll M. D., Kit B. K., and Ogden C. L. (2012) Prevalence of obesity and trends in the distribution of body mass index among US adults, 1999–2010. JAMA 307, 491–497 [DOI] [PubMed] [Google Scholar]
- 2. Lazo M., Hernaez R., Eberhardt M. S., Bonekamp S., Kamel I., Guallar E., Koteish A., Brancati F. L., and Clark J. M. (2013) Prevalence of nonalcoholic fatty liver disease in the United States: the Third National Health and Nutrition Examination Survey, 1988–1994. Am. J. Epidemiol. 178, 38–45 [DOI] [PMC free article] [PubMed] [Google Scholar]
- 3. Cecchini M., Sassi F., Lauer J. A., Lee Y. Y., Guajardo-Barron V., and Chisholm D. (2010) Tackling of unhealthy diets, physical inactivity, and obesity: health effects and cost-effectiveness. Lancet 376, 1775–1784 [DOI] [PubMed] [Google Scholar]
- 4. Smits M. M., Ioannou G. N., Boyko E. J., and Utzschneider K. M. (2013) Non-alcoholic fatty liver disease as an independent manifestation of the metabolic syndrome: results of a US national survey in three ethnic groups. J. Gastroenterol. Hepatol. 28, 664–670 [DOI] [PubMed] [Google Scholar]
- 5. Charlton M. R., Burns J. M., Pedersen R. A., Watt K. D., Heimbach J. K., and Dierkhising R. A. (2011) Frequency and outcomes of liver transplantation for nonalcoholic steatohepatitis in the United States. Gastroenterology 141, 1249–1253 [DOI] [PubMed] [Google Scholar]
- 6. Ratziu V., Goodman Z., and Sanyal A. (2015) Current efforts and trends in the treatment of NASH. J. Hepatol. 62, S65–S75 [DOI] [PubMed] [Google Scholar]
- 7. Zoppini G., Fedeli U., Gennaro N., Saugo M., Targher G., and Bonora E. (2014) Mortality from chronic liver diseases in diabetes. Am. J. Gastroenterol. 109, 1020–1025 [DOI] [PubMed] [Google Scholar]
- 8. Cohen J. C., Horton J. D., and Hobbs H. H. (2011) Human fatty liver disease: old questions and new insights. Science 332, 1519–1523 [DOI] [PMC free article] [PubMed] [Google Scholar]
- 9. Perry R. J., Samuel V. T., Petersen K. F., and Shulman G. I. (2014) The role of hepatic lipids in hepatic insulin resistance and type 2 diabetes. Nature 510, 84–91 [DOI] [PMC free article] [PubMed] [Google Scholar]
- 10. Lee J., and Ozcan U. (2014) Unfolded protein response signaling and metabolic diseases. J. Biol. Chem. 289, 1203–1211 [DOI] [PMC free article] [PubMed] [Google Scholar]
- 11. Gardner B. M., Pincus D., Gotthardt K., Gallagher C. M., and Walter P. (2013) Endoplasmic reticulum stress sensing in the unfolded protein response. Cold Spring Harb. Perspect. Biol. 5, a013169. [DOI] [PMC free article] [PubMed] [Google Scholar]
- 12. Walter P., and Ron D. (2011) The unfolded protein response: from stress pathway to homeostatic regulation. Science 334, 1081–1086 [DOI] [PubMed] [Google Scholar]
- 13. Park S. W., Zhou Y., Lee J., Lu A., Sun C., Chung J., Ueki K., and Ozcan U. (2010) The regulatory subunits of PI3K, p85α and p85β, interact with XBP-1 and increase its nuclear translocation. Nat. Med. 16, 429–437 [DOI] [PMC free article] [PubMed] [Google Scholar]
- 14. Lee J., Sun C., Zhou Y., Lee J., Gokalp D., Herrema H., Park S. W., Davis R. J., and Ozcan U. (2011) p38 MAPK-mediated regulation of Xbp1s is crucial for glucose homeostasis. Nat. Med. 17, 1251–1260 [DOI] [PMC free article] [PubMed] [Google Scholar]
- 15. Park S. W., Herrema H., Salazar M., Cakir I., Cabi S., Basibuyuk Sahin F., Chiu Y. H., Cantley L. C., and Ozcan U. (2014) BRD7 regulates XBP1s' activity and glucose homeostasis through its interaction with the regulatory subunits of PI3K. Cell Metab. 20, 73–84 [DOI] [PMC free article] [PubMed] [Google Scholar]
- 16. Zhou Y., Lee J., Reno C. M., Sun C., Park S. W., Chung J., Lee J., Fisher S. J., White M. F., Biddinger S. B., and Ozcan U. (2011) Regulation of glucose homeostasis through a XBP-1-FoxO1 interaction. Nat. Med. 17, 356–365 [DOI] [PMC free article] [PubMed] [Google Scholar]
- 17. Ozcan U., Cao Q., Yilmaz E., Lee A. H., Iwakoshi N. N., Ozdelen E., Tuncman G., Görgün C., Glimcher L. H., and Hotamisligil G. S. (2004) Endoplasmic reticulum stress links obesity, insulin action, and type 2 diabetes. Science 306, 457–461 [DOI] [PubMed] [Google Scholar]
- 18. Gregor M. F., Yang L., Fabbrini E., Mohammed B. S., Eagon J. C., Hotamisligil G. S., and Klein S. (2009) Endoplasmic reticulum stress is reduced in tissues of obese subjects after weight loss. Diabetes 58, 693–700 [DOI] [PMC free article] [PubMed] [Google Scholar]
- 19. Ozcan U., Yilmaz E., Ozcan L., Furuhashi M., Vaillancourt E., Smith R. O., Görgün C. Z., and Hotamisligil G. S. (2006) Chemical chaperones reduce ER stress and restore glucose homeostasis in a mouse model of type 2 diabetes. Science 313, 1137–1140 [DOI] [PMC free article] [PubMed] [Google Scholar]
- 20. Kammoun H. L., Chabanon H., Hainault I., Luquet S., Magnan C., Koike T., Ferré P., and Foufelle F. (2009) GRP78 expression inhibits insulin and ER stress-induced SREBP-1c activation and reduces hepatic steatosis in mice. J. Clin. Invest. 119, 1201–1215 [DOI] [PMC free article] [PubMed] [Google Scholar]
- 21. Rutkowski D. T., Wu J., Back S. H., Callaghan M. U., Ferris S. P., Iqbal J., Clark R., Miao H., Hassler J. R., Fornek J., Katze M. G., Hussain M. M., Song B., Swathirajan J., Wang J., et al. (2008) UPR pathways combine to prevent hepatic steatosis caused by ER stress-mediated suppression of transcriptional master regulators. Dev. Cell 15, 829–840 [DOI] [PMC free article] [PubMed] [Google Scholar]
- 22. Yamamoto K., Takahara K., Oyadomari S., Okada T., Sato T., Harada A., and Mori K. (2010) Induction of liver steatosis and lipid droplet formation in ATF6α-knockout mice burdened with pharmacological endoplasmic reticulum stress. Mol. Biol. Cell 21, 2975–2986 [DOI] [PMC free article] [PubMed] [Google Scholar]
- 23. Zhang K., Wang S., Malhotra J., Hassler J. R., Back S. H., Wang G., Chang L., Xu W., Miao H., Leonardi R., Chen Y. E., Jackowski S., and Kaufman R. J. (2011) The unfolded protein response transducer IRE1α prevents ER stress-induced hepatic steatosis. EMBO J. 30, 1357–1375 [DOI] [PMC free article] [PubMed] [Google Scholar]
- 24. Lee A. H., Scapa E. F., Cohen D. E., and Glimcher L. H. (2008) Regulation of hepatic lipogenesis by the transcription factor XBP1. Science 320, 1492–1496 [DOI] [PMC free article] [PubMed] [Google Scholar]
- 25. Diraison F., Moulin P., and Beylot M. (2003) Contribution of hepatic de novo lipogenesis and reesterification of plasma non esterified fatty acids to plasma triglyceride synthesis during non-alcoholic fatty liver disease. Diabetes Metab. 29, 478–485 [DOI] [PubMed] [Google Scholar]
- 26. Dries D. R., Gallegos L. L., and Newton A. C. (2007) A single residue in the C1 domain sensitizes novel protein kinase C isoforms to cellular diacylglycerol production. J. Biol. Chem. 282, 826–830 [DOI] [PubMed] [Google Scholar]
- 27. Samuel V. T., Liu Z. X., Qu X., Elder B. D., Bilz S., Befroy D., Romanelli A. J., and Shulman G. I. (2004) Mechanism of hepatic insulin resistance in non-alcoholic fatty liver disease. J. Biol. Chem. 279, 32345–32353 [DOI] [PubMed] [Google Scholar]
- 28. Samuel V. T., Liu Z. X., Wang A., Beddow S. A., Geisler J. G., Kahn M., Zhang X. M., Monia B. P., Bhanot S., and Shulman G. I. (2007) Inhibition of protein kinase Cϵ prevents hepatic insulin resistance in nonalcoholic fatty liver disease. J. Clin. Invest. 117, 739–745 [DOI] [PMC free article] [PubMed] [Google Scholar]
- 29. Shulman G. I. (2014) Ectopic fat in insulin resistance, dyslipidemia, and cardiometabolic disease. N. Engl. J. Med. 371, 1131–1141 [DOI] [PubMed] [Google Scholar]
- 30. Kumashiro N., Erion D. M., Zhang D., Kahn M., Beddow S. A., Chu X., Still C. D., Gerhard G. S., Han X., Dziura J., Petersen K. F., Samuel V. T., and Shulman G. I. (2011) Cellular mechanism of insulin resistance in nonalcoholic fatty liver disease. Proc. Natl. Acad. Sci. U.S.A. 108, 16381–16385 [DOI] [PMC free article] [PubMed] [Google Scholar]
- 31. Magkos F., Su X., Bradley D., Fabbrini E., Conte C., Eagon J. C., Varela J. E., Brunt E. M., Patterson B. W., and Klein S. (2012) Intrahepatic diacylglycerol content is associated with hepatic insulin resistance in obese subjects. Gastroenterology 142, 1444–1446.e2 [DOI] [PMC free article] [PubMed] [Google Scholar]
- 32. Cantley J. L., Yoshimura T., Camporez J. P., Zhang D., Jornayvaz F. R., Kumashiro N., Guebre-Egziabher F., Jurczak M. J., Kahn M., Guigni B. A., Serr J., Hankin J., Murphy R. C., Cline G. W., Bhanot S., et al. (2013) CGI-58 knockdown sequesters diacylglycerols in lipid droplets/ER-preventing diacylglycerol-mediated hepatic insulin resistance. Proc. Natl. Acad. Sci. U.S.A. 110, 1869–1874 [DOI] [PMC free article] [PubMed] [Google Scholar]
- 33. Jornayvaz F. R., Birkenfeld A. L., Jurczak M. J., Kanda S., Guigni B. A., Jiang D. C., Zhang D., Lee H. Y., Samuel V. T., and Shulman G. I. (2011) Hepatic insulin resistance in mice with hepatic overexpression of diacylglycerol acyltransferase 2. Proc. Natl. Acad. Sci. U.S.A. 108, 5748–5752 [DOI] [PMC free article] [PubMed] [Google Scholar]
- 34. Singh R., Kaushik S., Wang Y., Xiang Y., Novak I., Komatsu M., Tanaka K., Cuervo A. M., and Czaja M. J. (2009) Autophagy regulates lipid metabolism. Nature 458, 1131–1135 [DOI] [PMC free article] [PubMed] [Google Scholar]
- 35. Chalasani N., Younossi Z., Lavine J. E., Diehl A. M., Brunt E. M., Cusi K., Charlton M., Sanyal A. J., American Gastroenterological Association, American Association for the Study of Liver Diseases, and American College of Gastroenterology (2012) The diagnosis and management of non-alcoholic fatty liver disease: practice guideline by the American Gastroenterological Association, American Association for the Study of Liver Diseases, and American College of Gastroenterology. Gastroenterology 142, 1592–1609 [DOI] [PubMed] [Google Scholar]
- 36. Williams C. D., Stengel J., Asike M. I., Torres D. M., Shaw J., Contreras M., Landt C. L., and Harrison S. A. (2011) Prevalence of nonalcoholic fatty liver disease and nonalcoholic steatohepatitis among a largely middle-aged population utilizing ultrasound and liver biopsy: a prospective study. Gastroenterology 140, 124–131 [DOI] [PubMed] [Google Scholar]
- 37. Tolman K. G., Fonseca V., Dalpiaz A., and Tan M. H. (2007) Spectrum of liver disease in type 2 diabetes and management of patients with diabetes and liver disease. Diabetes Care 30, 734–743 [DOI] [PubMed] [Google Scholar]
- 38. Boyle J. P., Thompson T. J., Gregg E. W., Barker L. E., and Williamson D. F. (2010) Projection of the year 2050 burden of diabetes in the US adult population: dynamic modeling of incidence, mortality, and prediabetes prevalence. Popul. Health Metr. 8, 29. [DOI] [PMC free article] [PubMed] [Google Scholar]
- 39. Gregg E. W., Williams D. E., and Geiss L. (2014) Changes in diabetes-related complications in the United States. N. Engl. J. Med. 371, 286–287 [DOI] [PubMed] [Google Scholar]
- 40. Neeland I. J., Turer A. T., Ayers C. R., Powell-Wiley T. M., Vega G. L., Farzaneh-Far R., Grundy S. M., Khera A., McGuire D. K., and de Lemos J. A. (2012) Dysfunctional adiposity and the risk of prediabetes and type 2 diabetes in obese adults. JAMA 308, 1150–1159 [DOI] [PMC free article] [PubMed] [Google Scholar]
- 41. Rinella M. E. (2015) Nonalcoholic fatty liver disease: a systematic review. JAMA 313, 2263–2273 [DOI] [PubMed] [Google Scholar]
- 42. Deng Y., Wang Z. V., Tao C., Gao N., Holland W. L., Ferdous A., Repa J. J., Liang G., Ye J., Lehrman M. A., Hill J. A., Horton J. D., and Scherer P. E. (2013) The Xbp1s/GalE axis links ER stress to postprandial hepatic metabolism. J. Clin. Invest. 123, 455–468 [DOI] [PMC free article] [PubMed] [Google Scholar]
- 43. Shao M., Shan B., Liu Y., Deng Y., Yan C., Wu Y., Mao T., Qiu Y., Zhou Y., Jiang S., Jia W., Li J., Li J., Rui L., Yang L., and Liu Y. (2014) Hepatic IRE1α regulates fasting-induced metabolic adaptive programs through the XBP1s-PPARα axis signalling. Nat. Commun. 5, 3528. [DOI] [PubMed] [Google Scholar]
- 44. Jurczak M. J., Lee A. H., Jornayvaz F. R., Lee H. Y., Birkenfeld A. L., Guigni B. A., Kahn M., Samuel V. T., Glimcher L. H., and Shulman G. I. (2012) Dissociation of inositol-requiring enzyme (IRE1α)-mediated c-Jun N-terminal kinase activation from hepatic insulin resistance in conditional X-box-binding protein-1 (XBP1) knock-out mice. J. Biol. Chem. 287, 2558–2567 [DOI] [PMC free article] [PubMed] [Google Scholar]
- 45. Papáčková Z., Daňková H., Páleníčková E., Kazdová L., and Cahová M. (2012) Effect of short- and long-term high-fat feeding on autophagy flux and lysosomal activity in rat liver. Physiol. Res. 61, S67–S76 [DOI] [PubMed] [Google Scholar]
- 46. Sharma S., Mells J. E., Fu P. P., Saxena N. K., and Anania F. A. (2011) GLP-1 analogs reduce hepatocyte steatosis and improve survival by enhancing the unfolded protein response and promoting macroautophagy. PLoS ONE 6, e25269. [DOI] [PMC free article] [PubMed] [Google Scholar]
- 47. Yang L., Li P., Fu S., Calay E. S., and Hotamisligil G. S. (2010) Defective hepatic autophagy in obesity promotes ER stress and causes insulin resistance. Cell Metab. 11, 467–478 [DOI] [PMC free article] [PubMed] [Google Scholar]
- 48. Raddatz K., Turner N., Frangioudakis G., Liao B. M., Pedersen D. J., Cantley J., Wilks D., Preston E., Hegarty B. D., Leitges M., Raftery M. J., Biden T. J., and Schmitz-Peiffer C. (2011) Time-dependent effects of Prkce deletion on glucose homeostasis and hepatic lipid metabolism on dietary lipid oversupply in mice. Diabetologia 54, 1447–1456 [DOI] [PubMed] [Google Scholar]
- 49. Yu C., Chen Y., Cline G. W., Zhang D., Zong H., Wang Y., Bergeron R., Kim J. K., Cushman S. W., Cooney G. J., Atcheson B., White M. F., Kraegen E. W., and Shulman G. I. (2002) Mechanism by which fatty acids inhibit insulin activation of insulin receptor substrate-1 (IRS-1)-associated phosphatidylinositol 3-kinase activity in muscle. J. Biol. Chem. 277, 50230–50236 [DOI] [PubMed] [Google Scholar]
- 50. Harwood H. J. Jr., Chandler C. E., Pellarin L. D., Bangerter F. W., Wilkins R. W., Long C. A., Cosgrove P. G., Malinow M. R., Marzetta C. A., and Pettini J. L. (1993) Pharmacologic consequences of cholesterol absorption inhibition: alteration in cholesterol metabolism and reduction in plasma cholesterol concentration induced by the synthetic saponin β-tigogenin cellobioside (CP-88818; tiqueside). J. Lipid Res. 34, 377–395 [PubMed] [Google Scholar]
- 51. Shimano H., Horton J. D., Hammer R. E., Shimomura I., Brown M. S., and Goldstein J. L. (1996) Overproduction of cholesterol and fatty acids causes massive liver enlargement in transgenic mice expressing truncated SREBP-1a. J. Clin. Invest. 98, 1575–1584 [DOI] [PMC free article] [PubMed] [Google Scholar]
Associated Data
This section collects any data citations, data availability statements, or supplementary materials included in this article.