Abstract
Long noncoding RNAs (lncRNA) have been associated with the development of cancer. However, the interplay between lncRNAs and androgen receptor (AR) signaling in prostate cancer is still unclear. Here, we identified lncRNAs induced by androgen in AR-positive prostate cancer cells, where induction was abolished by AR knockdown as well as an anti-androgen, bicalutamide. By combining these data, we identified an androgen-regulated lncRNA, suppressor of cytokine signaling 2-antisense transcript 1 (SOCS2-AS1), the expression of which was higher in castration-resistant prostate cancer model cells, i.e. long-term androgen-deprived (LTAD) cells, than in parental androgen-dependent LNCaP cells. SOCS2-AS1 promoted castration-resistant and androgen-dependent cell growth. We found that SOCS2-AS1 knockdown up-regulated genes related to the apoptosis pathway, including tumor necrosis factor superfamily 10 (TNFSF10), and sensitized prostate cancer cells to docetaxel treatment. Moreover, we also demonstrated that SOCS2-AS1 promotes androgen signaling by modulating the epigenetic control for AR target genes including TNFSF10. These findings suggest that SOCS2-AS1 plays an important role in the development of castration-resistant prostate cancer by repressing apoptosis.
Keywords: androgen, androgen receptor, apoptosis, long noncoding RNA (lncRNA), prostate cancer
Introduction
Recent advances in sequencing technologies have greatly enhanced our understanding of the human transcriptome, revealing that more than 90% of the human genome is actively transcribed, although only a minority of it is translated into proteins (1, 2). Most of the noncoding transcripts of more than 200 nt are known as long noncoding RNAs (lncRNAs)3 (3). Although the number of known human lncRNAs is still evolving, some of them have been functionally characterized and experimentally validated.
Androgen receptor (AR) and its downstream signaling have a crucial role in the development and progression of both localized and advanced metastatic prostate cancer (4–6). High-risk localized prostate cancer is treated with androgen deprivation therapies in addition to surgery and radiotherapy (7–9). However, many prostate cancers inevitably escape from androgen dependence leading to castration-resistant prostate cancer (CRPC) (10). Past studies have revealed that elevated AR expression (4), activation of AR transcription (11), and development of AR variants (12) are observed in the progression to CRPC, suggesting the importance of identifying AR downstream signals and new molecular mechanisms for AR activation to improve the treatment of CRPC.
Some lncRNAs studied in prostate cancer, act in a highly prostate-specific manner (13–18). In prostate cancer, the first prominent lncRNA, PCA3, was initially described as a novel biomarker of disease (19) and subsequently defined as a promising urine test for this disease (20). Similarly, the lncRNA PCGEM1 has been implicated in prostate cancer as a regulator of apoptosis (21). PCAT-1 was characterized as a novel prostate-specific lncRNA, regulator of cell proliferation, and target of the polycomb repressive complex 2 (PRC2) (15). HOTAIR RNA binds to AR protein to block the interaction with the E3 ubiquitin ligase MDM2, thereby preventing protein degradation and AR activation (22).
In a previous study, we analyzed global AR transcriptional network by mapping genome-wide transcriptional start sites regulated by androgen and AR binding sites (ARBS). This integrative genomic study revealed comprehensive AR-regulated transcripts from intergenic or AS regions of genes in prostate cancer cells (23). In addition, we investigated the functional roles of these novel androgen-responsive long noncoding RNAs, such as a lncRNA located at the AS region of the C-terminal-binding protein 1 (CTBP1) gene, CTBP1-AS, revealing an oncogenic role of androgen-regulated lncRNAs in prostate cancer progression (24).
In the present study, to explore more androgen-dependent lncRNAs that have roles in prostate cancer progression, we performed high-throughput sequencing analysis in androgen-treated prostate cancer cell lines. Among the androgen-induced lncRNAs in LNCaP and VCaP cells, we focused on suppressor of cytokine signaling 2-antisense transcript 1 (SOCS2-AS1), the expression of which was higher in long-term androgen-deprived (LTAD) and VCaP-LTAD cells, which are castration-resistant prostate cancer cells derived from LNCaP and VCaP cells (GenBankTM accession number NR_038263). SOCS2-AS1 promoted cell growth and migration and repressed several genes related to the apoptosis pathway, including TNFSF10, suggesting that androgen-induced SOCS2-AS1 would play an important role in the progression of prostate cancer.
Results
Identification of Androgen-induced lncRNAs by Directional RNA Sequencing
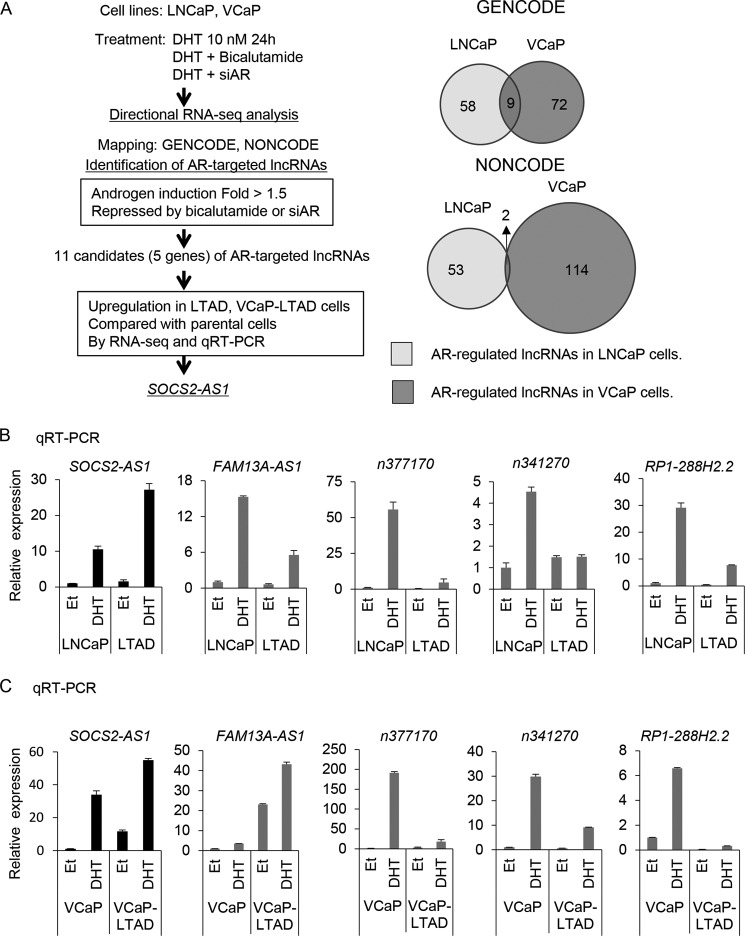
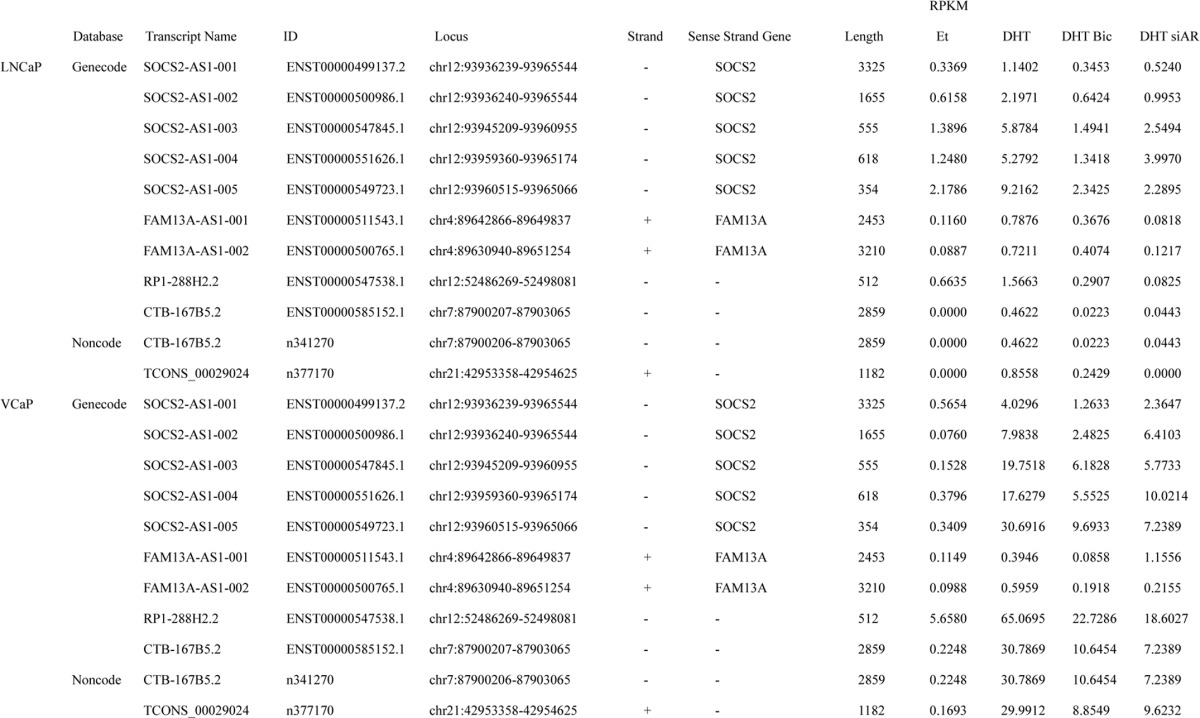
To investigate hormone-regulated lncRNAs in prostate cancer, we performed directional RNA sequencing (RNA-seq) and identified lncRNAs induced by androgen in prostate cancer cell lines. For lncRNA analysis, we used two databases, GENCODE V19 (25) and NONCODE v4. AR-positive prostate cancer cell lines, LNCaP and VCaP, and their corresponding castration-resistant cell lines, LTAD and VCaP-LTAD (24), were treated with vehicle (ethanol) or 10 nm 5α-dihydrotestosterone (DHT). In addition, LNCaP and VCaP cells were also treated with DHT plus bicalutamide or with 10 nm siRNA-targeting AR (siAR). After 24 h, total RNAs were extracted, and then RNA-seq analysis was performed. Bioinformatic analysis identified lncRNAs that were up-regulated more than 1.5-fold by DHT treatment and repressed to less than 0.75-fold by bicalutamide and siAR treatment in both LNCaP and VCaP cell lines. Nine transcripts were common in both cell lines using the GENCODE annotation and two in the NONCODE annotation (Fig. 1A). We examined these 11 transcripts and found that they corresponded to lncRNAs transcribed from five different genes (Table 1).
FIGURE 1.
Analysis of androgen-induced lncRNAs in prostate cancer and identification of SOCS2-AS1 as a lncRNA highly expressed in castration-resistant prostate cancer. A, flow diagram for the identification of SOCS2-AS1 as an AR-targeted lncRNA up-regulated in LTAD cells. Venn diagram representing overlap of lncRNAs induced by androgen (10 nm DHT) and repressed by 1 mm bicalutamide and 10 nm siAR treatment for 24 h in LNCaP and VCaP cell lines. B, qRT-PCR analysis of androgen-induced lncRNAs by qRT-PCR in LNCaP cells. C, qRT-PCR analysis of androgen-induced lncRNAs by qRT-PCR in VCaP cells. Cells were treated with 100 nm DHT or ethanol (Et) for 24 h. The expression level of each lncRNA was determined by qRT-PCR. n = 3. Expression levels are presented relative to the value of GAPDH as the reference gene. Values represent mean ± S.D.
TABLE 1.
List of androgen-induced lncRNAs
lncRNAs induced by more than 1.5-fold with 10 nm DHT compared with ethanol (Et) treatment and repressed to less than 0.75-fold by bicalutamide (Bic) and siAR in LNCaP and VCaP cell lines are listed. RPKM, reads per kilobase per million mapped reads.
SOCS2-AS1 Is an Androgen-induced lncRNA Highly Expressed in Castration-resistant Prostate Cancer Cells
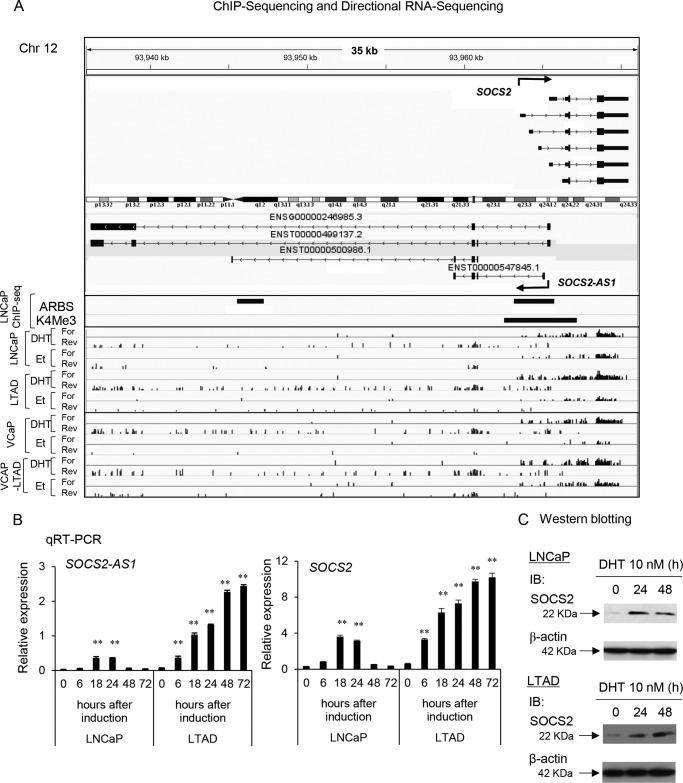
Next, we performed qRT-PCR to analyze the expression of five lncRNAs in both LNCaP and VCaP and their LTAD cells. We validated their androgen induction as observed in RNA-seq data (Fig. 1, B and C). Among these five lncRNAs, we found that SOCS2-AS1 was highly expressed in LTAD and VCaP-LTAD compared with the parental cell lines by RNA-seq and qRT-PCR analysis (Figs. 1, A–C, and Fig. 2A). Therefore, we chose this lncRNA for further study. Our ChIP-seq data (26, 27) revealed ARBS in the promoter region (Chr12: 93,963,629–93,965,465 (hg19), +1.5 kbp–291 bp from the transcriptional start site (TSS) of NR_038263). Interestingly, although its expression was repressed after 48 h of androgen treatment in LNCaP cells, it was further induced even after 72 h of androgen stimulation in LTAD cells (Fig. 2B). Its sense gene, SOCS2, showed a similar pattern of induction (Fig. 2, B and C). These data indicate a distinct pattern of induction in castration-resistant prostate cancer cells compared with hormone-naive prostate cancer.
FIGURE 2.
SOCS2-AS1 is induced by androgen in LNCAP cells and is highly expressed in castration-resistant prostate cancer model LTAD cells. A, RNA-seq and ChIP-seq analysis of SOCS2-AS1 and SOCS2 in LNCaP and VCaP cell lines treated with 10 nm DHT or ethanol (Et) for 24 h. B, time course analysis of SOCS2-AS1 and SOCS2 mRNA after DHT treatment in LNCaP and LTAD cell lines determined by qRT-PCR. C, Western blotting analysis of SOCS2 after 10 nm DHT treatment at indicated time points. β-Actin was used as an internal control. IB, immunoblot. Values represent mean ± S.D.; **, p < 0.01.
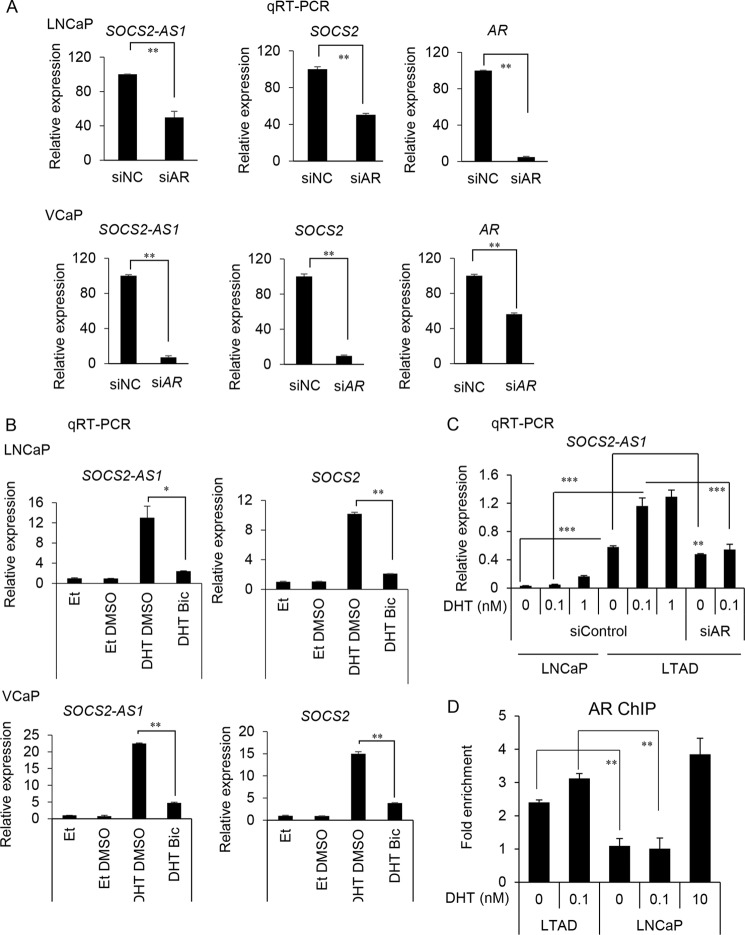
SOCS2-AS1 is an antisense lncRNA transcribed from the opposite strand of the protein coding the SOCS2 gene. SOCS2 is one of the eight members of the SOCS family that are induced by cytokine stimulation through the Janus kinase (JAK/STAT) signaling. SOCS genes contribute to cytokine inhibition by reducing JAK or STAT phosphorylation, inhibiting the same cascade that initiated their production through a negative feedback mechanism (28–30). We identified ARBSs at a common promoter region of both SOCS2-AS1 and SOCS2, as well as in the intronic region of SOCS2-AS1, suggesting that their expressions are directly regulated by AR (Fig. 2A). Consistently, AR knockdown by siRNA and pretreatment with the anti-androgen bicalutamide repressed SOCS2-AS1 and SOCS2 mRNA induction by androgen in both LNCaP and VCaP cells (Fig. 3, A and B). We reported previously the enhancement of AR expression and sensitivity in LTAD cells compared with parental cells (31). We analyzed whether high sensitivity of AR to a low concentration of DHT is involved in the induction of SOCS2-AS1 in these cell lines. We observed that low concentration of DHT increased the SOCS2-AS1 expression level in LTAD cells (Fig. 3C). In addition, AR binding to the promoter was observed in the absence of DHT and increased by low concentration of DHT (Fig. 3D). These results indicate one possibility that enhanced AR sensitivity in LTAD cells induce the overexpression of SOCS2-AS1.
FIGURE 3.
AR knockdown and bicalutamide treatment represses SOCS2-AS1 expression. A, qRT-PCR analysis of SOCS2-AS1, SOCS2 mRNA, and AR mRNA levels following 10 nm siAR treatment and subsequent androgen treatment (10 nm DHT for 18 h) in LNCaP and VCaP cell lines (n = 3). B, SOCS2-AS1 and SOCS2 mRNA levels following 1 μm bicalutamide or DMSO and 10 nm DHT or ethanol treatment for 24 h in LNCaP and VCaP cell lines by qRT-PCR (n = 3). RNA expression levels are presented relative to the value of GAPDH as the reference gene. C, qRT-PCR analysis of SOCS2-AS1 mRNA level after low dose androgen treatment (0, 0.1, and 1 nm DHT for 18 h) in LNCaP and LTAD cell lines (n = 3). D, ChIP analysis of AR recruitments to the ARBS in the SOCS2-AS1 promoter region by low level of androgen. LNCaP and LTAD cells were treated with ethanol or 0.1 nm DHT for 24 h. 10 nm DHT was used as a positive control. -Fold enrichment over control region (GAPDH) was measured by qPCR. Values represent mean ± S.D.; *, p < 0.05; **, p < 0.01; ***, p < 0.001.
SOCS2-AS1 Induces Prostate Cancer Cell Growth
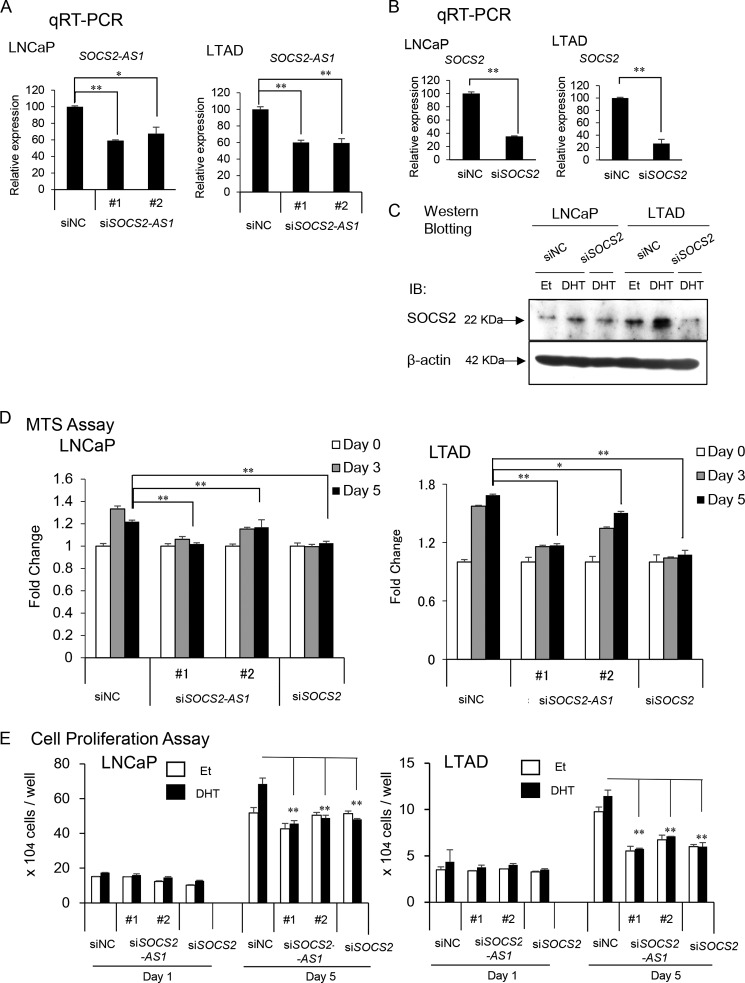
To investigate the role of SOCS2-AS1 in prostate cancer cells, we designed two siRNAs to reduce androgen-induced SOCS2-AS1 expression levels in LNCaP and LTAD prostate cancer cell lines, as well as one siRNA targeting SOCS2 (Fig. 4, A–C). We found that both SOCS2-AS1 and SOCS2 knockdown decreased cell proliferation in LNCaP and LTAD cells (Fig. 4D). In addition, we transfected siSOCS2-AS1 or siSOCS2 to LNCaP and LTAD cells and counted cell numbers over time after androgen treatment. In line with the results of the MTS assays, cell proliferation of siSOCS2-AS1- or siSOCS2-transfected cells was repressed compared with control siRNA-transfected cells, supporting the idea that SOCS2-AS1 and SOCS2 increase cell proliferation rate (Fig. 4E).
FIGURE 4.
SOCS2-AS1 knockdown inhibits LNCaP and LTAD cell growth. A, knockdown efficiency of SOCS2-AS1 by siRNA. LNCaP and LTAD cells were transfected with siNC (control) siRNA or siSOCS2-AS1 #1 and #2 for 48 h and then treated with 10 nm DHT or ethanol for 18 h. The expression level of SOCS2-AS1 was analyzed by qRT-PCR (n = 3). B, knockdown efficiency of SOCS2 by siRNA analyzed by qRT-PCR (n = 3) in LNCaP and LTAD cells treated with 10 nm DHT for 18 h. C, knockdown efficiency of SOCS2 by siRNA analyzed by Western blotting in LNCaP and LTAD cells, treated with 10 nm DHT or ethanol (Et) for 18 h. IB, immunoblot. D, MTS assay in LNCaP and LTAD cell lines transfected with 20 nm siNC, siSOCS2-AS1, or siSOCS2 for 24 h following androgen treatment. E, cell proliferation assay in LNCaP and LTAD cell lines transfected with 20 nm siNC, siSOCS2-AS1, or siSOCS2 for 24 h following androgen (10 nm DHT) treatment. Values represent mean ± S.D.; *, p < 0.05; **, p < 0.01.
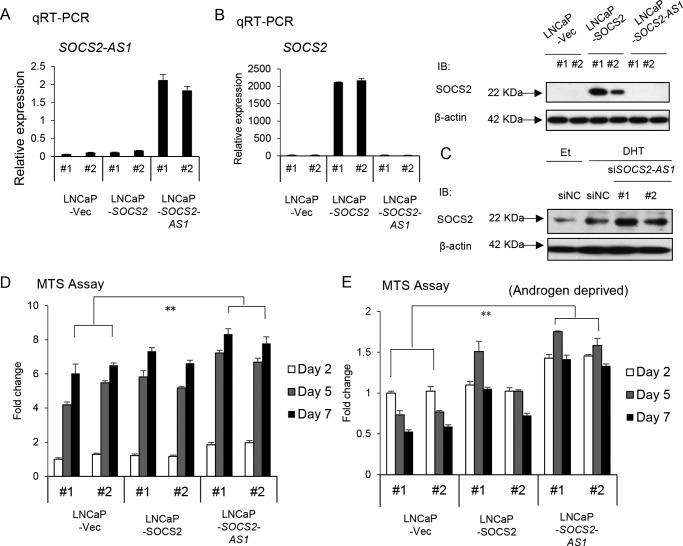
In addition, we established LNCaP cells stably overexpressing SOCS2-AS1 or SOCS2 (Fig. 5, A and B). SOCS2-AS1 is located on chromosome 12 (93,959,404–93,965,174 (hg19) reverse strand, NR_038263) overlapping the promoter region of SOCS2 (Fig. 2A). Given this close proximity, we hypothesized that SOCS2-AS1 may regulate SOCS2. However, SOCS2 mRNA and protein levels were not altered with SOCS2-AS1 overexpression (Fig. 5B), and the negative regulation of SOCS2 protein expression by antisense transcript was marginally detected but not evident (Fig. 5C).
FIGURE 5.
SOCS2-AS1 overexpression enhances cell growth. A, SOCS2-AS1 expression in stable cells analyzed by qRT-PCR (n = 3). B, qRT-PCR (n = 3) and Western blotting analysis of SOCS2 expression in stable cell lines. IB, immunoblot; Et, ethanol. C, SOCS2 protein expression analyzed by Western blotting in LNCaP cells transfected with 20 nm siSOCS2-AS1 or siNC for 24 h following androgen (10 nm DHT) or ethanol treatment for 18 h. IB, immunoblot. D and E, MTS assays of stable cells cultured with normal medium (D) or phenol-free RPMI supplemented with 10% charcoal stripped FBS (E). Values represent mean ± S.D.; *, p < 0.05; **, p < 0.01.
We performed cell proliferation assays using normal culture medium and androgen-deprived medium. We found that the increase in the cell proliferation rate of SOCS2-AS1 stable cells was higher than that of SOCS2 stable cells, not only in the normal medium (Fig. 5D) but also in androgen-deprived medium (Fig. 5E). These results suggest that SOCS2-AS1 plays a central role in promoting both hormone-dependent and castration-resistant prostate cancer cell growth.
SOCS2-AS1 Induces Prostate Cancer Cell Migration
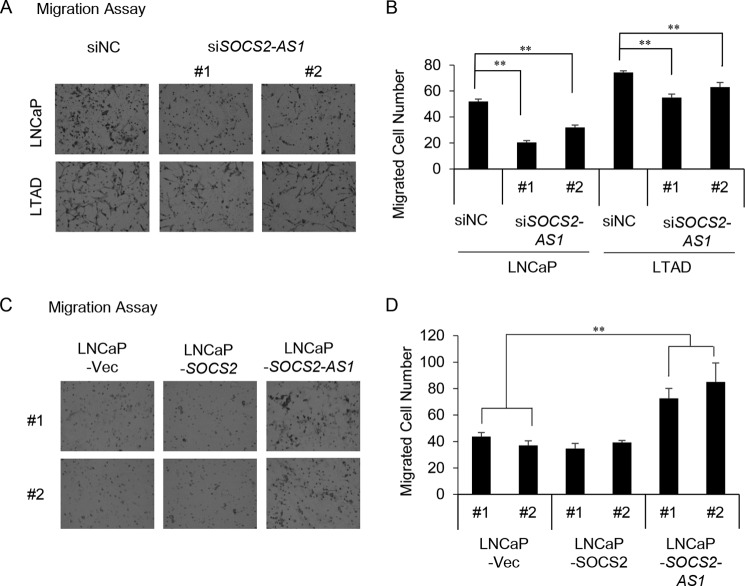
Next, we performed migration assay in LNCaP and LTAD cells transfected with siSOCS2-AS1 or negative control siRNA. Both cell lines were cultivated for 2 days in androgen-deprived medium, transfected with siRNA for 24 h, transferred into 8-μm pore seize inserts. The number of cells migrated among SOCS2-AS1 knockdown cells was lower compared with control cells (Fig. 6, A and B). We also performed migration assay using LNCaP cells stably expressing SOCS2-AS1, SOCS2 and control cells. The number of cells migrated among SOCS2-AS1-overexpressing cells was higher than in SOCS2-overexpressing cells or control cells (Fig. 6, C and D). These data suggest that SOCS2-AS1 may enhance the metastatic potential of prostate cancer cells.
FIGURE 6.
SOCS2-AS1 overexpression enhances cell migration. A, migration assay of siSOCS2-AS1 (#1 and #2) and control siRNA-transfected cells in 10 nm DHT medium. B, quantification of migrated cells. Five random fields were counted using a microscope, and the average number of cells per field was calculated. C, migration assay of SOCS2 (#1 and #2), SOCS2-AS1 (#1 and #2) and control (#1 and #2) stable cells. D, quantification of migrated cells. Four random fields were counted using a microscope, and the average number of cells per field was calculated. Data represent the average of four different views. Vec, vector. Values represent mean ± S.D. **, p < 0.01.
SOCS2-AS1 Regulates the Expression of Apoptosis-associated Genes Such as TNFSF10
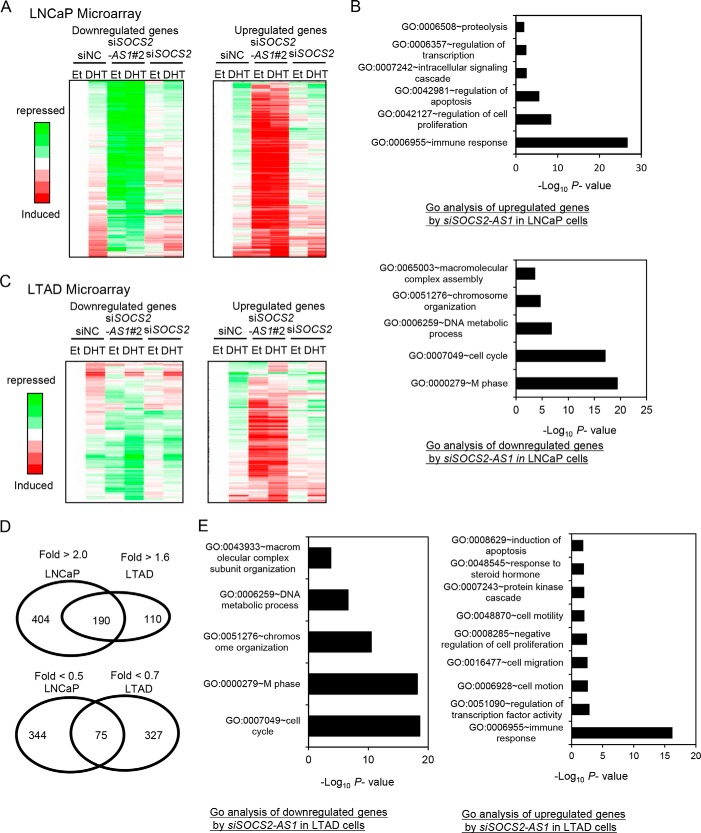
We performed microarray analysis to investigate the trans-regulatory effects of SOCS2-AS1 in LNCaP cells by comparing the gene expression profiles in cells treated with siSOCS2-AS1 or siSOCS2 or with negative control siRNA (siNC) (Fig. 7A). We then found that SOCS2-AS1 and SOCS2 have distinct downstream signals, suggesting the different biological responses by both genes were induced by such different gene regulations. Genes differentially expressed with siSOCS2-AS1 transfection in DHT-treated cells were analyzed using the DAVID bioinformatics platform (32, 33). Gene ontology (GO) term analysis showed an enrichment of genes involved in apoptosis (p = 4.4E-09) for 594 genes up-regulated by siSOCS2-AS1 transfection compared with control siRNA in LNCaP cells (Fig. 7B). Interestingly, Tumor necrosis factor superfamily 10 (TNFSF10), which is involved in apoptosis signaling, was the most up-regulated gene by siSOCS2-AS1 transfection. Moreover, we also found that genes related to cell proliferation or cell cycling are major sources of SOCS2-AS1 downstream signaling.
FIGURE 7.
SOCS2-AS1 inhibits the apoptosis pathway. A, microarray analysis of LNCaP cells transfected with 20 nm siSOCS2-AS1 (#2) or siNC for 24 h. Cells were treated with ethanol (Et) or DHT for 18 h. Genes repressed or induced more than 2-fold by siSOCS2-AS1 transfection in the presence of androgen were selected as SOCS2-AS1 downstream signals. Expression values displayed in a gradient of red or green are the ratio between log2-transformed gene expression values in siSOCS2-AS1, siSOCS2, and siNC-transfected cells. B, GO term analysis of up-regulated or down-regulated SOCS2-AS1 signals. The most significantly enriched functions were presented. C, microarray analysis of LTAD cells transfected with 20 nm siSOCS2-AS1 (#2) or siNC for 24 h. Cells were treated with ethanol or DHT for 18 h. Genes repressed less than 0.7-fold or induced more than 1.6-fold by siSOCS2-AS1 transfection in the presence of androgen were selected as SOCS2-AS1 downstream signals. D, Venn diagram showing the overlap of SOCS2-AS1 target genes in LNCaP and LTAD cells. E, GO term analysis of up-regulated or down-regulated SOCS2-AS1 signals in LTAD cells. The most significantly enriched functions were presented.
We further performed microarray analysis using siSOCS2-AS1-transfected LTAD cells (Fig. 7C). We identified genes regulated by SOCS2-AS1 in LTAD cells (We obtained 301 up-regulated genes and 413 down-regulated by SOCS2-AS1 knockdown in the presence of DHT). Interestingly, 37% of up-regulated and 81% of down-regulated genes were found to be LTAD-specific SOCS2-AS1 targets (Fig. 7D). GO analysis of these genes indicated that SOCS2-AS1 regulates a greater variety of signals, such as cell migration and transcriptional regulation in addition to apoptosis, cell cycle, and cell proliferation (Fig. 7E). We also found LTAD-specific target genes associated with apoptosis such as apoptosis-inducing factor 2 (AIF2) and checkpoint kinase 2 (CHEK2), suggesting the role of other signaling for apoptosis in LTAD cells.
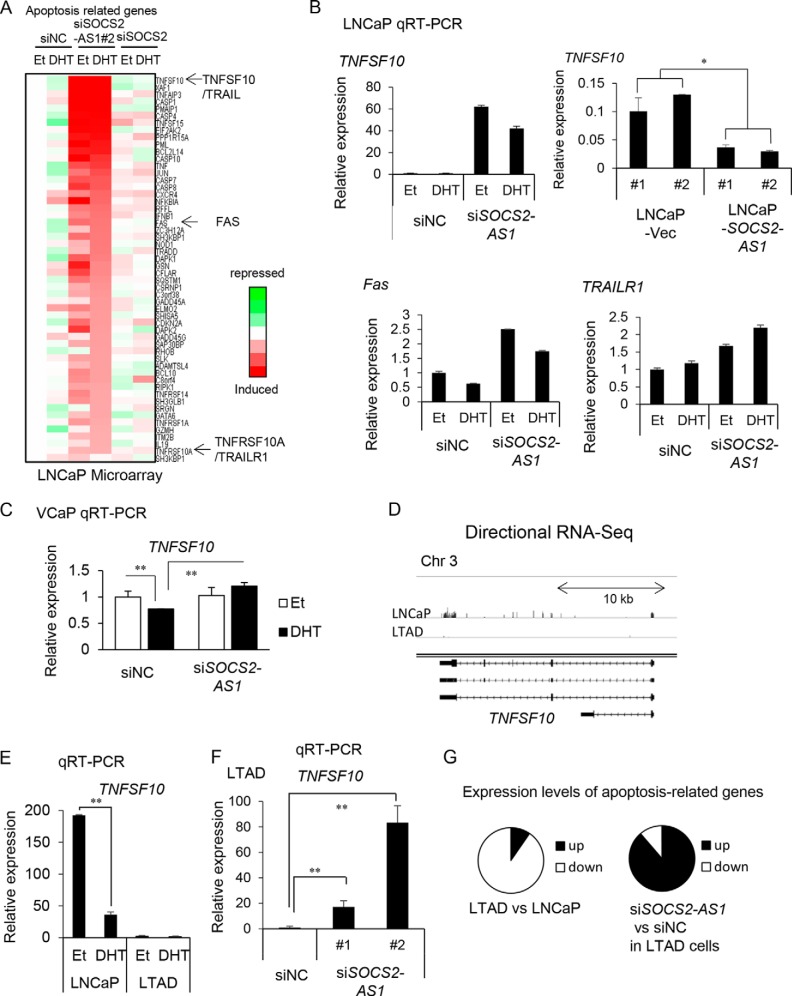
TNFSF10 belongs to a small subset of pro-apoptotic protein ligands in the TNF superfamily. The TNF superfamily consists of proteins involved in proliferation, differentiation, and apoptosis, including TNF and Fas ligand (FasL) (34, 35). We also found that TRAIL receptor 1 (DR4 or TNFRSF10A), as well as the cell death surface receptor Fas, was up-regulated by siSOCS2-AS1 (Fig. 8A), indicating that SOCS2-AS1 may repress the apoptotic pathways. We confirmed that TNFSF10 expression in LNCaP cells stably overexpressing SOCS2-AS1 was lower than in control cells (Fig. 8B). In contrast, TNFSF10 expression was higher in LNCaP cells treated with siSOCS2-AS1 knockdown cells (Fig. 8B). We confirmed by qRT-PCR that TRAIL receptor 1 and Fas were up-regulated, supporting the idea that SOCS2-AS1 may repress the apoptotic pathway by modulating the expression of these genes (Fig. 8B). We also observed that siSOCS2-AS1 treatment up-regulated TNFSF10 expression in the presence of DHT in VCaP cells (Fig. 8C).
FIGURE 8.
SOCS2-AS1 modulates TNFSF10 expression. A, expression levels of apoptosis-related genes included in SOCS2-AS1-regulated genes in LNCaP microarray data. Representative genes TNFSF10, FAS, and TRAILR1 are shown by arrows. B, TNFSF10 mRNA expression in SOCS2-AS1 stable cells analyzed by qRT-PCR; and TNFSF10, Fas, and TRAILR1 mRNA expression in 20 nm siSOCS2-AS1 (siSOCS2-AS1#2) or siNC-transfected cells for 24 h in LNCaP cells. C, TNFSF10 mRNA expression in 20 nm siSOCS2-AS1 (siSOCS2-AS1#2) or siNC-transfected cells for 24 h in VCaP cells. D, TNFSF10 mRNA expression in LNCaP and LTAD cell lines analyzed by directional RNA-seq using Integrative Genomics Viewer (IGV browser). E, TNFSF10 mRNA expression in LNCaP and LTAD cell lines analyzed by qRT-PCR. F, TNFSF10 mRNA expression in siSOCS2-AS1-transfected LTAD cells. Values represent mean ± S.D.; *, p < 0.05; **, p < 0.01. G, left, expression levels of apoptosis related genes (Fig. 8A) in LTAD cells were compared with LNCaP cells using microarray data. Right, we compared expression levels of these genes in LTAD cells treated with siSOCS2-AS1 with those in siNC.
Interestingly, TNFSF10 expression was totally repressed in LTAD cells (Fig. 8, D and E) and it was induced with SOCS2-AS1 knockdown (Fig. 8F), suggesting the role of SOCS2-AS1 in repressing TNFSF10 in CRPC. Most of the other apoptosis-related genes in LNCaP cells (Fig. 8A) were also repressed in LTAD compared with LNCaP cells and up-regulated by siSOCS2-AS1 in LTAD cells (Fig. 8G), suggesting the role of SOCS2-AS1 up-regulation in the anti-apoptotic ability in CRPC cells.
SOCS2-AS1 Inhibits Apoptosis
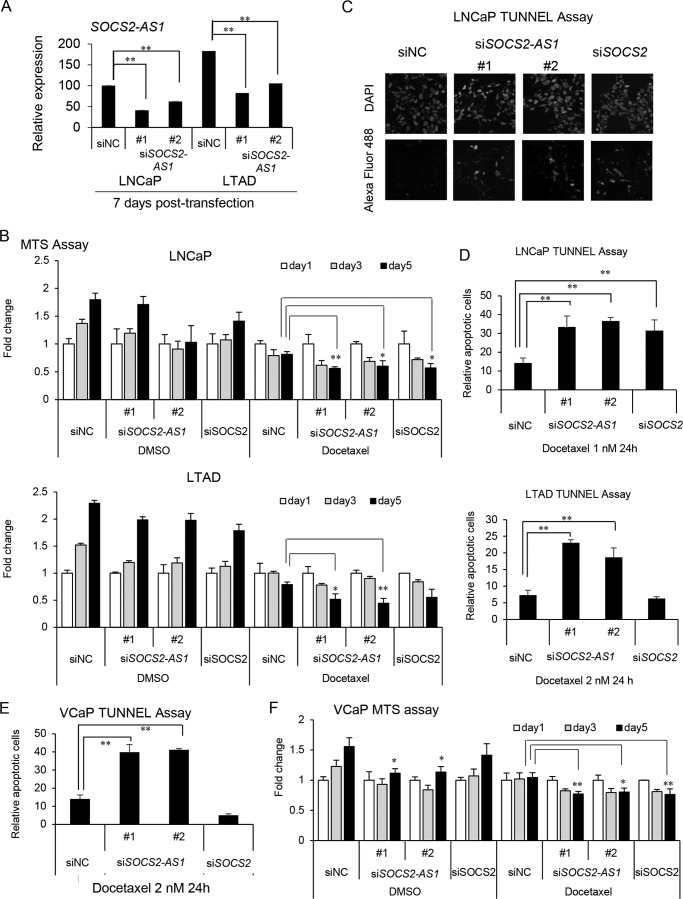
To examine whether SOCS2-AS1 is involved in apoptosis, we performed a cell proliferation assay in LNCaP and LTAD cells treated with docetaxel or dimethyl sulfoxide (DMSO) transfected previously with siSOCS2-AS1 or siSOCS2. LNCaP cells were treated with 1 nm docetaxel and LTAD cells with 2 nm docetaxel for 24 h. In addition, we showed further repression of SOCS2-AS1 levels after 7 days of siRNA transfection (Fig. 9A). Cell viability was suppressed in the presence of docetaxel in SOCS2-AS1 or SOCS2 knockdown LNCaP cells and SOCS2-AS1 knockdown LTAD cells (Fig. 9B). Next, we performed a TUNEL assay with LNCaP and LTAD cells transfected with siSOCS2-AS1, siSOCS2, or siNC. Green fluorescence-stained cells, representing cells undergoing apoptosis, were observed in both siSOCS2-AS1- and siSOCS2-transfected LNCaP cells and in siSOCS2-AS1-transfected LTAD cells, whereas apoptotic cells were not significantly observed in control cells (Fig. 9, C and D). We further examined the role of SOCS2-AS1 in apoptosis using VCaP cells treated with DMSO or 2 nm docetaxel and obtained similar results (Fig. 9, E and F).
FIGURE 9.
SOCS2-AS1 knockdown sensitizes cells to docetaxel treatment and increases apoptosis. A, knockdown efficiency of SOCS2-AS1 by siRNA as analyzed by qRT-PCR (n = 3) in LNCaP and LTAD cells treated with docetaxel for 7 days. B, MTS assay of LNCaP and LTAD cells transfected with 20 nm siSOCS2-AS1, siSOCS2, or siNC for 24 h following 1 nm docetaxel or DMSO treatment for the indicated times. C and D, TUNEL assay in LNCaP and LTAD cells transfected with 20 nm siSOCS2-AS1, siSOCS2, or siNC for 24 h following 1 or 2 nm docetaxel treatment for 24 h. C, representation of DAPI (upper panels) and Alexa Fluor 488 (lower panels) signals detected in LNCaP cells treated with docetaxel. D, graph representing the quantification of apoptotic cells in LNCaP and LTAD cells. E, TUNEL assay in VCaP cells. VCaP cells transfected with 20 nm siSOCS2-AS1, siSOCS2, or siNC for 24 h following 2 nm docetaxel treatment for 24 h. F, MTS assay of VCaP cells transfected with 20 nm siSOCS2-AS1, siSOCS2, or siNC for 24 h following 2 nm docetaxel or DMSO treatment for the indicated times. Data represent the average of three different views (n = 3). Values represent mean ± S.D. *, p < 0.05; **, p < 0.01 (versus siNC).
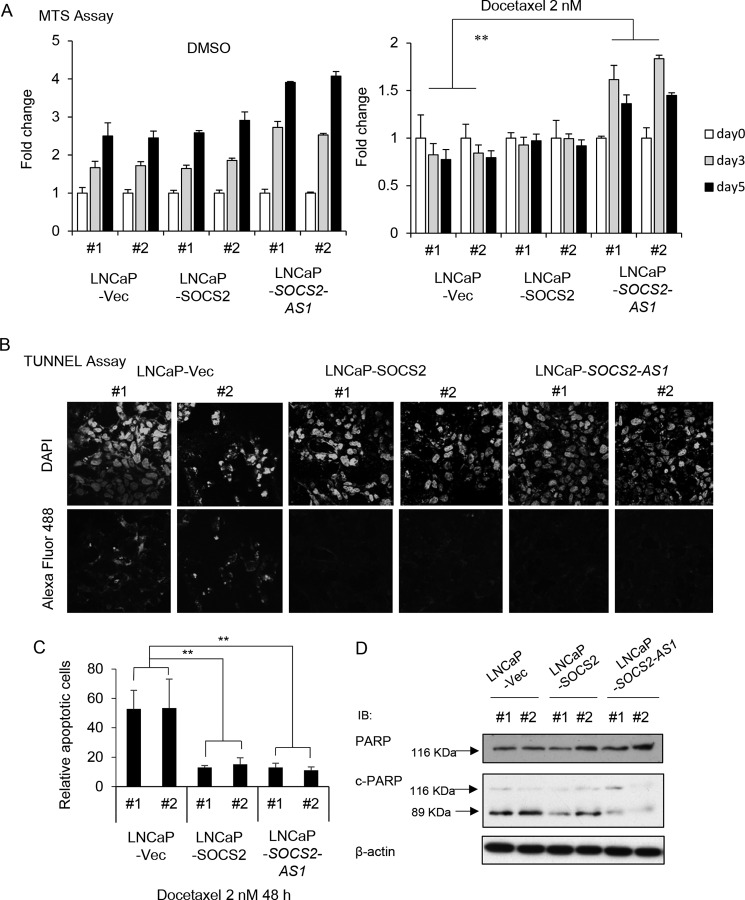
Conversely, SOCS2-AS1-overexpressing cells showed resistance to docetaxel-induced inhibition of cell proliferation compared with control cells (Fig. 10A). In addition, the TUNEL assay using SOCS2-AS1 and SOCS2-overexpressing cells treated with 2 nm docetaxel for 48 h showed that cells overexpressing SOCS2-AS1 and SOCS2 were more resistant to apoptosis (Fig. 10, B and C). Furthermore, Western blotting analysis showed that the expression of cleaved-form PARP was significantly reduced in SOCS2-AS1 stably expressing cells compared with control cells when treated with 1 nm docetaxel for 48 h (Fig. 10D). Thus, these data suggest that SOCS2-AS1, as well as SOCS2, inhibits apoptosis and promotes prostate cancer cell survival.
FIGURE 10.
SOCS2-AS1-overexpressing cells are more resistant to docetaxel treatment and apoptosis. A, MTS assay of LNCaP stable cells treated with 2 nm docetaxel or DMSO for the indicated times. B, TUNEL assay in LNCaP stable cells treated with 2 nm docetaxel for 48 h. Shown are DAPI (upper panels)- and Alexa Fluor 488 (lower panels)-stained docetaxel-treated stable cells. C, quantification of apoptotic cells of TUNEL assay. Data represent the average of three different views (n = 3). Vec, vector. Values represent mean ± S.D. **, p < 0.01. D, docetaxel-induced apoptosis is inhibited in SOCS2-AS1 stably expressing cells. PARP cleavage was analyzed by Western blotting in LNCaP cells stably expressing SOCS2-AS1 or SOCS2 and control cells treated with 1 nm docetaxel for 48 h. PARP and cleaved PARP antibodies were used. PARP proenzyme (116 kDa) and the cleaved subunit, c-PARP (89 kDa), are indicated on the left by arrows. β-Actin was used as a loading control. IB, immunoblot.
SOCS2-AS1 Regulates Androgen-mediated Gene Expression
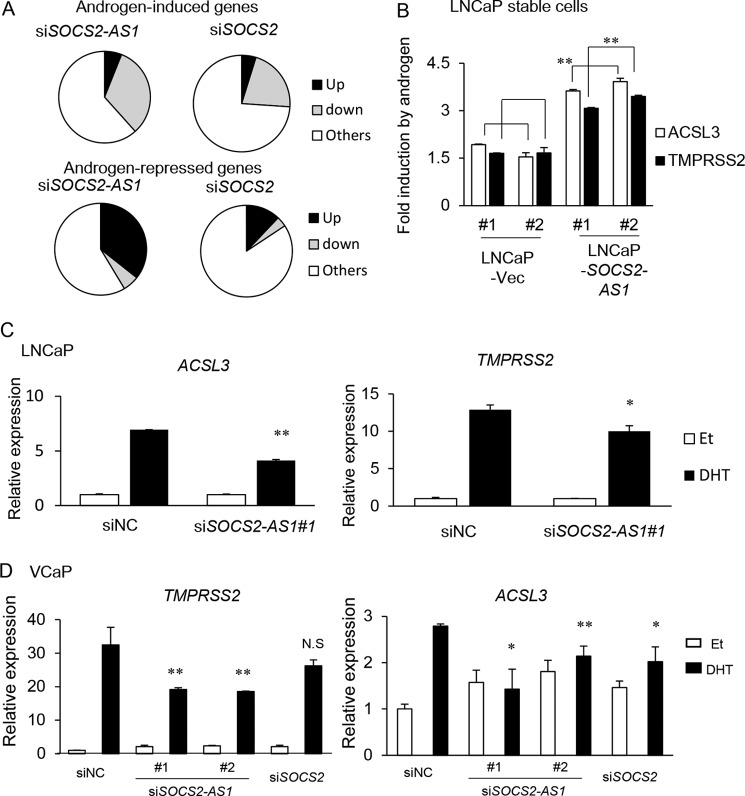
We further analyzed whether SOCS2-AS1 regulates AR activity, because we found more than half of the up-regulated genes by siSOCS2-AS1 in LNCaP cells were repressed by androgen treatment, and TNFSF10 was also repressed by androgen (Fig. 7A). We selected 559 androgen-induced (>1.5-fold) genes. Among them, 267 (48%) genes were repressed (<0.8-fold) by siSOCS2-AS1 in the presence of DHT (Fig. 11A). In addition, among 521 androgen-repressed genes (<0.7-fold), 186 (35%) genes were induced (>1.4-fold). This repression of androgen signaling was not evident in SOCS2 knockdown samples. By qPCR analysis, we observed that androgen-dependent induction of ACSL3 and TMPRSS2 (both are representative androgen-regulated genes) was enhanced in LNCaP cells overexpressing SOCS2-AS1 (Fig. 11B). In addition, we also confirmed that SOCS2-AS1 knockdown inhibits these androgen-mediated gene inductions in both LNCaP and VCaP cells (Fig. 11, C and D).
FIGURE 11.
SOCS2-AS1 promotes androgen-mediated gene regulation. A, global effect of SOCS2-AS1 knockdown on androgen-mediated gene induction and repression. Microarray data from LNCaP cells transfected with 20 nm siSOCS2-AS1 (#2) or siNC for 24 h was analyzed. Among DHT-induced genes (>1.5-fold), those repressed (<0.8-fold) with siSOCS2-AS1 (#2) or siSOCS2 transfection are showed as the gray fraction (upper panel). Similarly, among DHT-repressed genes (<0.7-fold), those induced (>1.4-fold) with siSOCS2-AS1 (#2) or siSOCS2 transfection are showed as the black fraction (lower panel). B, LNCaP cells overexpressing SOCS2-AS1 or vector control cells were treated with ethanol or 10 nm DHT for 24 h. Expression levels of ACSL3 and TMPRSS2 were measured by qPCR. -Fold inductions over vehicle (Et, ethanol) control are shown. C, LNCaP cells were treated with siNC or siSOCS2-AS1#1 for 24 h and then treated with ethanol or 10 nm DHT for 24 h. Expression levels of ACSL3 and TMPRSS2 were measured by qPCR. D, VCaP cells were treated with siNC, siSOCS2-AS1, or siSOCS2 for 48 h and then treated with ethanol or 10 nm DHT for 24 h. Expression levels of ACSL3 and TMPRSS2 were measured by qPCR. Values represent mean ± S.D. *, p < 0.05; **, p < 0.01.
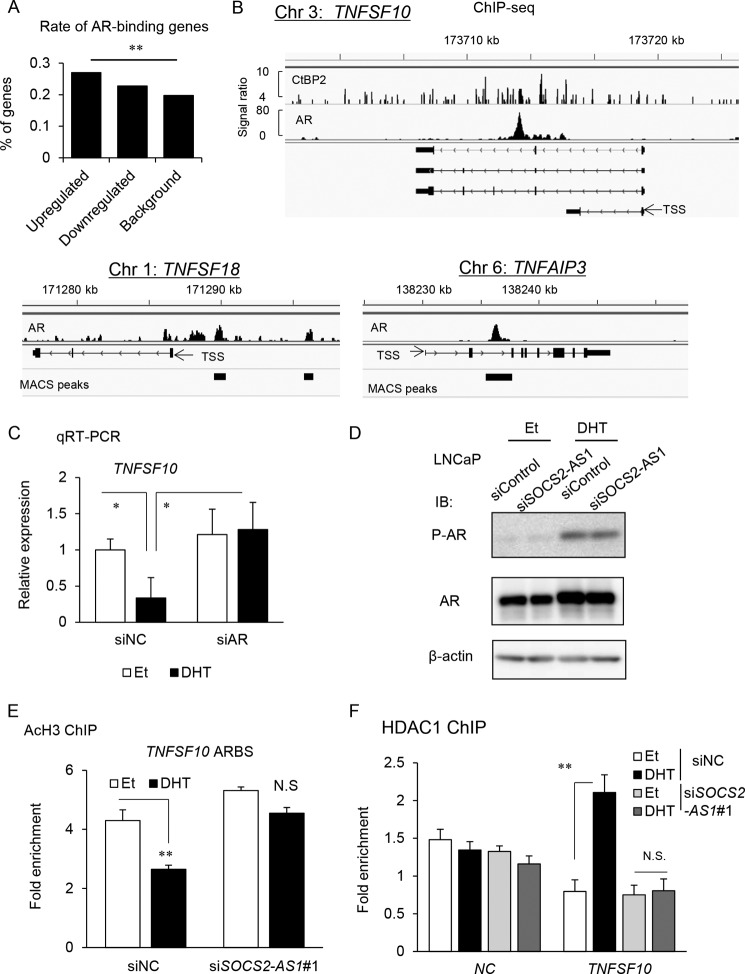
Next, we further investigated whether AR function is regulated by SOCS2-AS1. Among genes up-regulated by SOCS2-AS1 knockdown, we found AR-binding genes were significantly enriched compared with background by analyzing ChIP-seq data (Fig. 12A). Then we explored the regulatory mechanism of AR signaling by SOCS2-AS1. We found that 8 of 14 representative genes associated with apoptosis, including TNFSF10, have ARBSs in their vicinity. In the intron region of TNFSF10, we found a strong AR binding region and recruitment of CtBP2, a cofactor important in prostate cancer progression (28), to the ARBS (Fig 12B). In addition, androgen-dependent repression of TNFSF10 was reversed by AR knockdown, indicating the regulation of TNFSF10 by AR (Fig. 12C). However, by Western blot analysis, we found that the protein levels of AR or phosphorylated AR (Ser-81), an important modification for AR binding to genome (36), were not affected by siSOCS2-AS1 (Fig. 12D). In this ARBS, we observed histone deacetylation, and recruitment of histone deacetylase to this region was inhibited by SOCS2-AS1 knockdown (Fig. 12, E and F), suggesting that SOCS2-AS1 is involved in AR activity by modulating the epigenetic function.
FIGURE 12.
Androgen-dependent epigenetic control at TNFSF10 ARBS is modified by SOCS2-AS1. A, AR-binding genes were significantly enriched in SOCS2-AS1 downstream signals identified by microarray analysis (Fig. 7A). AR-binding genes were determined based on our AR ChIP-seq data in LNCaP cells (28). Among genes up-regulated or down-regulated by siSOCS2-AS1 treatment in LNCaP cells, the number of AR binding genes was counted. A Chi-square test was performed to determine the p value. B, identification of ARBSs in the vicinity of apoptosis-related genes. The results of AR ChIP-seq are shown in the genomic loci of the representative genes, TNFSF10, TNFSF18, and TNFAIP3. In TNFSF10, the result of CtBP2 ChIP-seq data (31) is also shown. C, qRT-PCR analysis of TNFSF10 mRNA following 10 nm siAR treatment and subsequent androgen treatment (10 nm DHT for 18 h) in LNCaP cell lines (n = 3). D, LNCaP cells were transfected with siSOCS2-AS1 #1 or siNC for 48 h and then treated with ethanol (Et) or DHT for 24 h. Protein levels of phosphorylated AR (Ser-81) and total AR were analyzed by Western blotting. IB, immunoblot. β-Actin was used as a loading control. E, ChIP analysis of histone acetylation (AcH3) was performed in LNCaP cells. Cells were transfected with siNC or siSOCS2-AS1 #1 for 48 h and treated with ethanol or DHT for 18 h. -Fold enrichments over GAPDH exon locus were calculated by qPCR (n = 3). F, ChIP analysis of histone deacetylase 1 (HDAC1) was also performed. NC, negative control (myoglobin locus). (n = 3). Values represent mean ± S.D. *, p < 0.05; **, p < 0.01; N.S., not significant.
The Involvement of SOCS2-AS1 in AR-mediated Cofactor Recruitments
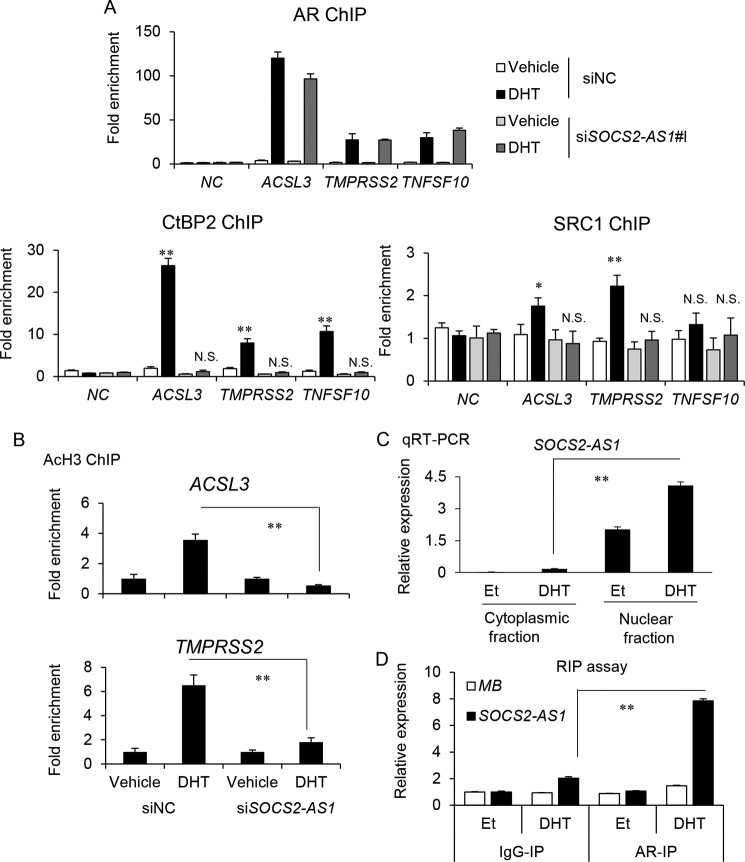
Therefore, we investigated how SOCS2-AS1 regulates AR epigenetic function by chromatin immunoprecipitation (ChIP) assay in three ARBSs (TNFSF10, ACSL3, and TMPRSS2). Interestingly, androgen-mediated recruitment of CtBP2 was repressed by SOCS2-AS1 knockdown, although AR bindings were not influenced (Fig. 13A). SRC1 is associated with gene induction by enhancing histone acetylation (37). We observed recruitment of SRC1 only to ARBSs of androgen-induced genes, and it was repressed by siSOCS2-AS1 treatment. Androgen-dependent histone acetylation was also inhibited by siSOCS2-AS1 (Fig. 13B), suggesting that SOCS2-AS1-mediated epigenetic control in AR signaling could affect both AR-mediated gene induction and repression. Moreover, we analyzed whether SOCS2-AS1 is involved in AR activity by interacting with AR. By qRT-PCR analysis, we showed that SOCS2-AS1 is enriched in the nucleus of LNCaP cells (Fig. 13C). By RNA immunoprecipitation (RIP) assay using nuclear lysates, we observed that AR associates with SOCS2-AS1 in the presence of androgen (Fig. 13D). These results suggest that SOCS2-AS1 interacts with AR in the nucleus and modulates AR activity by regulating cofactor recruitment for epigenetic controls. As an AR target gene, TNFSF10 is repressed by androgen, the expression of which may be modulated by the action of SOCS2-AS1 on AR.
FIGURE 13.
SOCS2-AS1 interacts with AR and controls the association of AR cofactors for histone modification. A, ChIP analysis of AR, CtBP2, and SRC1 was performed in LNCaP cells. Cells were transfected with siNC or siSOCS2-AS1 #1 for 48 h and treated with ethanol or DHT for 18 h. -Fold enrichments over the GAPDH exon locus were calculated by qPCR. NC, negative control (myoglobin locus). (n = 3). B, ChIP analysis of histone H3 acetylation (AcH3) was performed in LNCaP cells. Cells were transfected with siNC or siSOCS2-AS1 #1 for 48 h and treated with ethanol or DHT for 18 h. -Fold enrichments over ethanol control (Et) were calculated by qPCR (n = 3). C, LNCaP cells were treated with ethanol or DHT for 18 h. Total RNA was extracted from nuclear and cytosolic fractions. Expression level of SOCS2-AS1 was determined by qRT-PCR (n = 3). D, RIP analysis of AR was performed in LNCaP cells. Cells were treated with ethanol or DHT for 18 h. Nuclear lysates were obtained, and then immunoprecipitation using AR antibody (AR-IP) was performed (n = 3). Associated RNA was isolated, and then the RNA level of SOCS2-AS1 was determined by qRT-PCR. MB, myoglobin. Values represent mean ± S.D. *, p < 0.05; **, p < 0.01; N.S., not significant.
To evaluate the importance of SOCS2-AS1 in the clinical setting, we investigated the expression of SOCS2-AS1 as well as its potential target, TNFSF10, in clinical samples (38). SOCS2-AS1 was up-regulated in some metastatic prostate cancers compared with clinically localized primary prostate cancer, whereas TNFSF10 inversely correlated with SOCS2-AS1 expression, supporting the oncogenic role of SOCS2-AS1 (Fig. 14, A and B). Taken together, our findings provide a link between an androgen-induced lncRNA, SOCS2-AS1, and the apoptosis pathway, which may be mediated by TNFSF10 (Fig. 14C).
FIGURE 14.
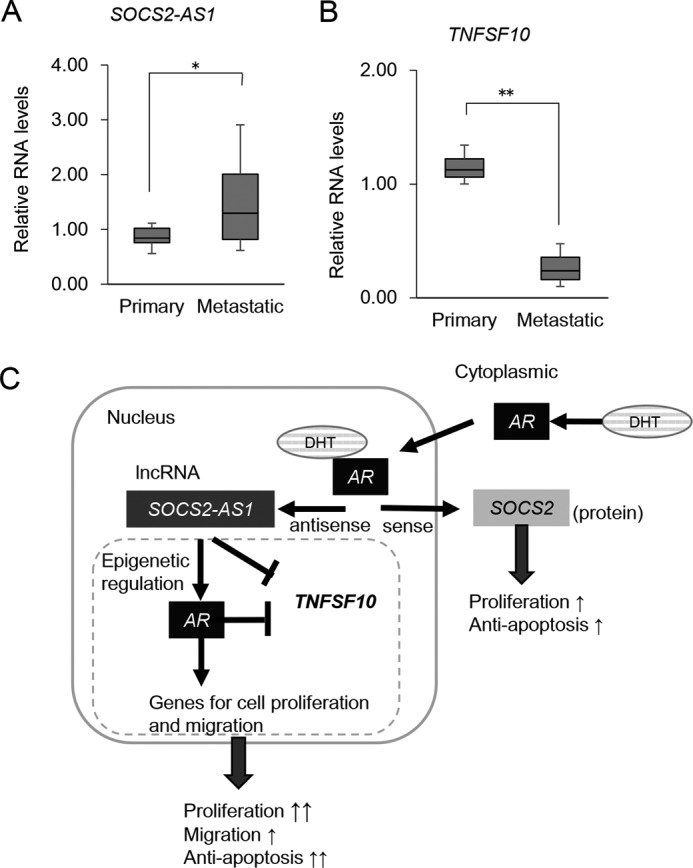
SOCS2-AS1 and TNFSF10 expression in clinical samples. A and B, SOCS2-AS1 and TNFSF10 expression in publicly available data sets (GEO accession No. GSE3325). SOCS2-AS1 (A) and TNFSF10 (B) microarray data were comparatively plotted in clinically localized primary prostate cancer and metastatic prostate cancer. Box plots are shown with the lower and upper bounds of the boxes representing the 25th and 75th quartiles, respectively. Values represent normalized RNA expression levels relative to the value of GAPDH as the reference gene. *, p < 0.05; **, p < 0.01. C, schematic model of SOCS2-AS1 androgen induction and cancer progression in prostate cancer.
Discussion
Previous studies have reported that several lncRNAs are certainly vital for the molecular chain of events that leads to prostate cancer development and progression. Therefore, RNA-based therapy could be a potential strategy for CRPC. In the present study, we investigated lncRNAs induced by androgen in two AR-positive prostate cancer cells using directional RNA-seq method. Among these lncRNAs, we found that the expression level of SOCS2-AS1 was higher in CRPC model LTAD cells than in parental androgen-dependent LNCaP cells. Socs2 knock-out mice, as well as transgenic mice, have been reported to display gigantism (39, 40), suggesting a dual role for SOCS2 in growth regulation. In this study we demonstrated that SOCS2-AS1 overexpression promoted castration-resistant and androgen-dependent cell growth and migration. On the other hand, SOCS2-AS1 knockdown inhibited cell growth of CRPC model cells as well as parental prostate cancer cells. Thus, our results indicate that SOCS2-AS1 may be a useful target for treating CRPC.
Several studies have addressed the regulation of bidirectional transcription (41–46). The expression of two genes from a bidirectional promoter suggests a shared upstream transcriptional regulator-mediated control of both genes, and implies that their functions might contribute independently to the same cellular response. Here we identified SOCS2-AS1 and SOCS2 as a pair of transcripts for which expression may be regulated by the same promoter/enhancer, in the opposite direction. Although our Western blot analysis of SOCS2 in LNCaP cells transfected with siSOCS2-AS1 suggests the putative negative sense/antisense regulation, further experiments with the stability of the transcript, for instance, are necessary to show the relationship. Importantly, SOCS2-AS1 induction by androgen was concordant with its sense strand gene, SOCS2, and both transcripts were repressed by the anti-androgen bicalutamide and siAR treatment.
In contrast to SOCS2-AS1, SOCS2 overexpression did not enhance cell proliferation and migration (Figs. 5, 6, and 10A), and the effect of knockdown is relatively small for inducing apoptosis in the LTAD or VCaP TUNEL assay (Fig. 9, D and E). Although SOCS2-AS1 and SOCS2 are induced by androgen and knockdown of both decreased the cell proliferation rate, they affect different genes and pathways, as suggested in the present study (Fig. 7A). These results support the idea that both SOCS2-AS1 and SOCS2 confer specific biological response to cell growth and apoptosis by modulating different downstream signaling.
SOCS2-AS1 works as a regulator at the transcriptional level to affect the gene expression profiles in several pathways linked to cancer progression such as apoptosis. TNFSF10, which mediates apoptosis in cancer cells and leaves normal cells intact (47, 48), was found as a candidate SOCS2-AS1 target. TNFSF10 expression was repressed in CRPC cells, and repression of SOCS2-AS1-sensitized prostate cancer cells to docetaxel-induced apoptosis. These findings suggest that SOCS2-AS1 plays a key role in the development of CRPC by repressing TNFSF10 and apoptosis. Furthermore, siSOCS2-AS1 down-regulated several known oncogenic genes known such as Forkhead box protein M1 (FOXM1) and its target gene, centromere protein F (CENPF), which are highly expressed in prostate cancer (49). FOXM1 encodes a Forkhead domain transcription factor involved in the regulation of cell growth, DNA damage, genomic stability, drug resistance, and metastasis. In addition, coexpression of FOXM1 and CENPF activates PI3K and MAPK signal pathways (50, 51). Together, these data support a role for SOCS2-AS1 in prostate cancer progression and provide a link for this lncRNA to cancer-specific genes.
The role of SOCS2 in cancer has been controversial (52–55). In prostate cancer, it was reported that SOCS2 protein levels are reduced in CRPC and that SOCS2 inhibits the oncogenic events caused by growth hormone, such as cell proliferation and invasion (56). In contrast, another report revealed that SOCS2 protein expression was increased in prostate tumor tissues compared with benign tissues and that SOCS2 has a growth-promoting role in vitro and in vivo (57). Our present study is in line with the latter report, supporting the oncogenic role of SOCS2 in prostate cancer progression, in concert with SOCS2-AS1. SOCS2 knockdown also repressed or induced genes related to the apoptosis (data not shown), suggesting that both transcripts may cooperate to inhibit apoptosis and promote prostate cancer cell survival.
Moreover, our microarray data suggest that SOCS2-AS1 confers oncogenic signaling by transcriptional regulation of genes associated with apoptosis, cell cycle, proliferation, and migration. We found that genes related to apoptosis and up-regulated by siSOCS2-AS1 transfection in DHT-treated LNCaP cells have ARBSs in the vicinity by ChIP-seq analysis, suggesting that AR may modulate the expression of these genes (Fig. 12C). TNFSF10 was the representative gene, with a marked ARBS in the intronic region. We further determined the effects of SOCS2-AS1 on the AR pathway by analyzing the effects of SOCS2-AS1 knockdown on the expression of androgen-regulated genes. Microarray data indicate that SOCS2-AS1 depletion inhibited the androgen-mediated gene regulations (Fig. 11A). We further analyzed the role of SOCS2-AS1 in AR binding and epigenetic regulation by ChIP assay. We demonstrated SOCS2-AS1 modulate the cofactor recruitments and histone modifications in TNFSF10 ARBS. Interestingly, we also observed that SOCS2-AS1 associated with AR by RIP assay in the nucleus. Thus, the transcriptional regulations by SOCS2-AS1 may be caused by modulating AR epigenetic action. These results suggest that high AR signaling in castration-resistant prostate cancer induces strong SOCS2-AS1 expression, which can activate high levels of anti-apoptosis signals and cell growth and lead to metastasis by enhancing AR signaling. Further studies will be necessary to address the mechanisms of SOCS2-AS1 for transcriptional regulation.
Recent studies have identified several metastases-associated lncRNAs; their overexpression may signify the propensity of a tumor to metastasize. In this study, SOCS2-AS1 enhanced the migration potential of prostate cancer cells. A possible mechanism for such migration and the cell growth-promoting ability of SOCS2-AS1 may be the modulation of AR signaling by SOCS2-AS1. As in several lncRNAs such as HOTAIR (22) and PCGEM1 (58), Our ChIP analysis indicated that SOCS2-AS1 may be involved in the modification of AR for recruiting epigenetic modifiers without changing the AR protein level or binding to genome. However, TNFSF10 is up-regulated even in the absence of DHT by SOCS2-AS1 knockdown (Fig. 8A), suggesting other possible mechanisms of functions for SOCS2-AS1 such as the recruitment of other transcriptional factors to the chromatin site, like CTBP1-AS (24), or the coactivation of cancer-related genes such as c-myc, like PCGEM1 (59). The investigation of associated transcription factors or epigenetic factors will be required to clarify how SOCS2-AS1 interferes with AR and modulates AR signaling in prostate cancer. To show more of the molecular mechanisms of SOCS2-AS1, investigating the interaction partners by mass spectrometry would be interesting. Additionally, by comparing the results of the microarray, we identified LTAD-specific target genes of SOCS2-AS1. A previous study (6) has demonstrated different AR binding sites in CRPC model cells from hormone-naive cells. Therefore, changes in AR or other transcription factor binding sites in CRPC cells may influence the action of SOCS2-AS1, which interacts with AR for transcriptional regulation.
In summary, we show that an androgen-induced lncRNA, SOCS2-AS1, which is more highly expressed in CRPC model LTAD cells than in parental androgen-dependent LNCaP cells, promotes castration-resistant and androgen-dependent cell growth and cell migration. SOCS2-AS1 modulates genes related to the apoptosis pathway, including TNFSF10, suggesting that it may play a key role in the development of CRPC by repressing apoptosis.
Experimental Procedures
Cell Culture and Reagents
LNCaP cells were grown in RPMI medium supplemented with 10% FBS. VCaP cells were grown in DMEM supplemented with 10% FBS. LTAD cells were grown in phenol red-free RPMI medium supplemented with 10% charcoal-dextran-stripped FBS. For androgen deprivation, cells were cultured for 3 days in phenol red-free RPMI medium (Nacalai Tesque, Kyoto, Japan) with 2.5% charcoal-dextran-stripped FBS. All cells were maintained at 37 °C in 10% O2 and 5% CO2. LNCaP and VCaP cells were purchased from American Type Culture Collection. DHT and bicalutamide (Casodex) were purchased from Sigma.
RNA-seq
RNA library preparation was performed according to the manufacturer's protocol for the OP-Illumina-Directional_RNA_seq-single_end-v1.0 (Illumina, San Diego). Sequencing libraries was constructed starting from 2 μg of total RNA. Sample DNA for cluster generation was prepared according to the manufacturer's protocol for the OP-HiSeq2000-sequencing-cBot-v3.0. The RNA-seq readings were analyzed using whole transcriptome software tools from Illumina. Matching locations were subsequently used to generate counts for annotated features, exons, transcripts, or genes using RefSeq genes to determine the exons genomic locations of known transcripts or coverage files (wiggle format). Finally, genes expression was determined as the number of reads per kilobase of exon model per million mapped reads (RPKM). RNA-seq data were uploaded to the GEO database (GSE82225). The Integrative Genomics Viewer, version 2.2 (IGV browser) was used for visualization.
qRT-PCR
Total RNA was isolated using the RNeasy kit (Qiagen). First-strand cDNA was generated using a PrimeScript RT reagent kit (Takara, Kyoto, Japan). Expression levels were quantified by qPCR using KAPA SYBR FAST ABI Prism 2× qPCR master mix and ABI StepOne system (Life Technologies). Relative mRNA levels were determined by normalization to glyceraldehyde-3-phosphate dehydrogenase (GAPDH) mRNA level. Primer sequences are listed in Table 2.
TABLE 2.
List of siRNAs and PCR primers used for RNA knockdown, qRT-PCR, ChIP-qPCR analysis, and SOCS2-AS1 expression vector construction
| siRNAs | |
| siSOCS2-AS1 #1 | UUAUCACUCAUCAUUUCAGAA (forward) |
| CUGAAAUGAUGAGUGAUAAUG (reverse) | |
| siSOCS2-AS1 #2 | GACCUGUAUGGUCAUUAUCACUC (forward) |
| GUGAUAAUGACCAUACAGGUCAA (reverse) | |
| siSOCS2 | UAUAUUCUUCCAAGUAAUCUU (forward) |
| GAUUACUUGGAAGAAUAUAAA (reverse) | |
| PCR primers | |
| SOCS2-AS1 | CCATACAGGTCAACTTTTCCACCAC (forward) |
| CCAACCTCAGCTCTGCTCTCTT (reverse) | |
| SOCS2 | AACCGCTCTACACGTCAGCA (forward) |
| TGGTAAAGGCAGTCCCCAGA (reverse) | |
| TNFSF10 | AGACCTGCGTGCTGATCGTG (forward) |
| CAAGCAATGCCACTTTTGGA (reverse) | |
| GAPDH | GGTGGTCTCCTCTGACTTCAACA (forward) |
| GTGGTCGTTGAGGGCAATC (reverse) | |
| PCR primers for cloning of SOCS2-AS1 | |
| SOCS2-AS1 | CTCAAGCTTAATTTGGGAACGAGATGCCCGGGGA (forward) |
| SOCS2-AS1 | CCCTCTAGATAGAAAGCTCCAGGTGTGTTTTATTTTA (reverse) |
| ChIP qPCR primers | |
| SOCS2-AS1 ARBS | TGGGACCGACGTTTAACTCT (forward) |
| GGGGTATCCTGAGGCTGTG (reverse) | |
| TNFSF10 ARBS | TCCGTACAGCTTGTGTGGAG (forward) |
| TTGGTGGTTAGGGATCAAGC (reverse) | |
ChIP Assay
ChIP was performed as described previously (23, 24). The fold enrichment relative to the GAPDH locus was quantified by qPCR using SYBR Green PCR master mix and the ABI StepOne system (Life Technologies). We used the myoglobin locus as a negative control. Antibodies for ChIP have been described previously. The primer sequences for ChIP qPCR have been described previously (23, 24) or are listed in Table 2.
RIP Assay
Confluent LNCaP cells in 15-cm dishes were harvested, and nuclear fractions were lysed in RIP buffer as described previously (24). Specific antibody was added to the supernatant, and the mixture was incubated overnight with rotation at 4 °C. Thirty microliters of protein G beads was added followed by incubation at 4 °C for 2 h with gentle rotation. The beads were washed three times with lysis buffer and resuspended in 1 ml of Isogen (Nippon Gene). Co-precipitated RNA was isolated and used for qRT-PCR analysis.
siRNA Transfection
siRNAs were designed using siDirect version 2.0 and purchased from Sigma Genosys. Cells were transfected with siRNAs using Lipofectamine RNAiMax transfection reagent (Thermo Fisher Scientific) at a final concentration of 20 nm according to the manufacturer's protocol. siRNA sequences are listed in Table 2.
MTS Assay
Cells were plated at 2 × 10³ cells/well in 96-well plates. For RNA interference experiments, cells were transfected with 20 nm siRNA 24 h after plating. Cell viability was assessed at different time points using a CellTiter 96 AQueous One Solution cell proliferation assay kit (Promega, Madison, WI). Plates were incubated at 37 °C for 50 min, and optical density was measured at 490 nm using a microplate-spectrophotometer (Benchmark Plus, Bio-Rad). Relative cell survival (mean ± S.D. of triplicate determinations) was calculated by standardizing the nontreated cell survival to 100%.
Cell Proliferation Assay
Cells were plated at 5 × 10⁴ cells/well in 24-well plates. The following day, cells were transfected with 20 nm siRNA, and the cell number was counted at different time points as described (24).
Western Blotting
Whole cell lysates were prepared using Nonidet P-40 lysis buffer. Protein concentration was measured by BCA assay (Pierce). Cell lysates were fractionated on 8 or 12% SDS-PAGE and transferred onto Immobilon-P transfer membrane (Millipore, Billerica, MA). Membranes were incubated with primary antibodies at 4 °C overnight and with secondary antibodies at room temperature for 1 h, using Blocking One buffer (Nacalai). Antibody-antigen complexes were detected with the ECL Plus detection system (GE Healthcare). Antibodies used in this study are SOCS2 rabbit antibody (2779S, Cell Signaling, Danvers, MA), PARP rabbit antibody 46D11 (9532S, Cell Signaling), cleaved PARP rabbit antibody D214 (9541S, Cell Signaling), and β-actin (A5316, Sigma).
Migration Assay
Cell migration assays were performed using a 24-well plate with Matrigel-coated invasion chambers (BD Biosciences). Briefly, 5 × 10⁴ cells were suspended in serum-free RPMI medium and transferred into suspended 8-μm pore inserts. RPMI medium supplemented with 10% FBS was placed at the bottom of the wells. After 24 h of culturing, cells that migrated to the opposite side of the membrane were fixed with methanol and stained with Giemsa. Five random fields were counted using an Olympus CKX41 microscope (×10 objective), and the average number of cells per field was calculated.
Microarray Analysis
For expression microarrays, a GeneChip Human Exon 1.0 ST array (Affymetrix, Santa Clara, CA) was used according to the manufacturer's protocol (24). Data analysis was performed using Affymetrix Microarray Suite software. To compare arrays, normalization was performed on data from all probe sets. GO term and Pathway analysis was performed using DAVID (25, 26). Microarray data were uploaded to the GEO database (GSE82225).
Plasmid Construction
To overexpress SOCS2-AS1, we performed PCR with specific primers, listed in Table 2. cDNA synthesized using total RNA extracted from androgen-treated LTAD was used as template. We chose the most abundant PCR product, which corresponded to the length of SOCS2-AS1 variant 2 (ENST00000499137.2) and cloned it into pcDNA3 expression vector.
A SOCS2-expressing vector was constructed by transferring its protein coding sequence from pDNR-LIB-SOCS2 vector (cDNA clone MGC:13697 IMAGE:4277425) to FLAG-tagged pcDNA3. Constructs were sequenced using the ABI PRISM 310 genetic analyzer (Life Technologies).
Establishment of SOCS2- and SOCS2-AS1-overexpressing Cells
SOCS2-AS1, SOCS2-expressing vectors, and empty vector were transfected into LNCaP cells using FuGENE HD (Promega) according to the manufacturer's protocol. Transfected cells were treated with 500 μg/ml G418 (Geneticin disulfate solution, Life Technologies) for selection of stably transfected cells. The surviving colonies were picked up and grown as stably transfected cells.
TUNEL Assay
For RNA interference experiments, 5 × 10⁴ LNCaP, LTAD, or VCaP cells were reverse-transfected with 20 nm siSOCS2-AS1 (#1 and (#2), siSOCS2, or siNC (negative control) and suspended on poly-l-lysine-coated slides placed in each well of a 24-well plate. For SOCS2-AS1 and SOCS2 stably expressing cells, 5 × 10⁴ cells were suspended on poly-l-lysine-coated slides placed in each well of a 24-well plate. At 24 h after plating, cells were treated with 1 or 2 nm docetaxel and cultured for another 24 h. A TUNEL assay was performed using the DeadEndTM fluorometric TUNEL system (Promega). Briefly, slides were fixed with 4% paraformaldehyde, permeabilized with 0.2% Triton X-100, equilibrated with buffer, and stained with the reaction mixture. The reaction was stopped with 2× SSC, and cells were stained with 1 mg/ml DAPI (Nacalai Tesque). Cover glasses were mounted onto glass slides, and positively stained cells were counted using an Olympus FluoView (FV10i) microscope (×60 objective). Images were obtained through FluoView software (version 2.0).
Statistical Analysis
For the cell proliferation assay, we analyzed four wells. For the growth assay using stable cell lines, we performed two-way analysis of variance at each time point. For other cell line experiments, the statistical differences (p values) among groups were obtained using a two-sided Student's t test. All experiments were performed at least twice, and similar results were obtained. A Chi-square test was performed to analyze the ratios of AR binding, and p values less than 0.05 were considered statistically significant. Statistical procedures were performed using GraphPad Prism 5 software (GraphPad Software, San Diego) or MS Excel.
Author Contributions
K. T. designed the study and performed RNA-seq. A. M. and K. T. performed experiments and analyzed the data. S. I. supervised the study. A. M., K. T., T. U., and S. I. wrote the manuscript.
Acknowledgments
We thank RIKEN for sequencing of samples. We are grateful to N. Sasaki and T. Oishi for technical assistance with microarray and bioinformatics analyses. We also thank Dr. K. Ikeda (Saitama Medical University) for technical advice on siRNA design.
This work was supported by grants from the Cell innovation Program and the P-DIRECT from the Ministry of Education, Culture, Sports, Science, and Technology, Japan (to S. I.); Grants 15K15581 (to K. T.) and 15K15353 (to S. I.) from the Japan Society for the Promotion of Science, Japan; a grant from the Program for Promotion of Fundamental Studies in Health Sciences, National Institute of Biomedical Information (NIBIO), Japan (to S. I.); grants-in-aid from the Ministry of Health, Labor, and Welfare (MHLW), Japan (to S. I.); grants from the Takeda Science Foundation (to S. I. and K. T.); and grants from the Mochida Memorial Research Foundation Japan, the Yasuda Memorial Foundation, and the Princess Takamatsu Cancer Research Fund (all to K. T.). The authors declare that they have no conflicts of interest with the contents of this article.
- lncRNA
- long noncoding RNA
- AR
- androgen receptor
- CRPC
- castration-resistant prostate cancer
- ARBS
- AR binding site
- RIP
- RNA immunoprecipitation
- RNA-seq
- RNA sequencing
- LTAD
- long-term androgen-deprived
- DHT
- 5α-dihydrotestosterone
- siAR
- siRNA-targeting androgen receptor
- siNC
- negative control siRNA
- GO
- gene ontology
- DMSO
- dimethyl sulfoxide
- PARP
- poly(ADP-ribose) polymerase
- qPCR
- quantitative PCR
- qRT-PCR
- quantitative RT-PCR
- MTS
- methanethiosulfonate.
References
- 1. ENCODE Project Consortium, Birney E., Stamatoyannopoulos J. A., Dutta A., Guigó R., Gingeras T. R., Margulies E. H., Weng Z., Snyder M., Dermitzakis E. T., Thurman R. E., Kuehn M. S., Taylor C. M., Neph S., Koch C. M., Asthana S., et al. (2007) Identification and analysis of functional elements in 1% of the human genome by the ENCODE pilot project. Nature 447,799–816 [DOI] [PMC free article] [PubMed] [Google Scholar]
- 2. Djebali S., Davis C. A., Merkel A., Dobin A., Lassmann T., Mortazavi A., Tanzer A., Lagarde J., Lin W., Schlesinger F., Xue C., Marinov G. K., Khatun J., Williams B. A., Zaleski C., et al. (2012) Landscape of transcription in human cells. Nature 489, 101–108 [DOI] [PMC free article] [PubMed] [Google Scholar]
- 3. Guttman M., Amit I., Garber M., French C., Lin M. F., Feldser D., Huarte M., Zuk O., Carey B. W., Cassady J. P., Cabili M. N., Jaenisch R., Mikkelsen T. S., Jacks T., Hacohen N., et al. (2009) Chromatin signature reveals over a thousand highly conserved large non-coding RNAs in mammals. Nature 458, 223–227 [DOI] [PMC free article] [PubMed] [Google Scholar]
- 4. Chen C. D., Welsbie D. S., Tran C., Baek S. H., Chen R., Vessella R., Rosenfeld M. G., and Sawyers C. L. (2004) Molecular determinants of resistance to antiandrogen therapy. Nat. Med. 10, 33–39 [DOI] [PubMed] [Google Scholar]
- 5. Scher H. I., and Sawyers C. L. (2005) Biology of progressive, castration-resistant prostate cancer: directed therapies targeting the androgen-receptor signaling axis. J. Clin. Oncol. 23, 8253–8261 [DOI] [PubMed] [Google Scholar]
- 6. Wang Q., Li W., Zhang Y., Yuan X., Xu K., Yu J., Chen Z., Beroukhim R., Wang H., Lupien M., Wu T., Regan M. M., Meyer C. A., Carroll J. S., Manrai A. K., et al. (2009) Androgen receptor regulates a distinct transcription program in androgen-independent prostate cancer. Cell 138, 245–256 [DOI] [PMC free article] [PubMed] [Google Scholar]
- 7. Tran C., Ouk S., Clegg N. J., Chen Y., Watson P. A., Arora V., Wongvipat J., Smith-Jones P. M., Yoo D., Kwon A., Wasielewska T., Welsbie D., Chen C. D., Higano C. S., Beer, et al. (2009) Development of a second-generation antiandrogen for treatment of advanced prostate cancer. Science 324, 787–790 [DOI] [PMC free article] [PubMed] [Google Scholar]
- 8. de Bono J. S., Logothetis C. J., Molina A., Fizazi K., North S., Chu L., Chi K. N., Jones R. J., Goodman O. B. Jr., Saad F., Staffurth J. N., Mainwaring P., Harland S., Flaig T. W., Hutson T. E., Cheng T., et al. (2011) Abiraterone and increased survival in metastatic prostate cancer. N. Engl. J. Med. 364, 1995–2005 [DOI] [PMC free article] [PubMed] [Google Scholar]
- 9. Scher H. I., Fizazi K., Saad F., Taplin M. E., Sternberg C. N., Miller K., de Wit R., Mulders P., Chi K. N., Shore N. D., Armstrong A. J., Flaig T. W., Fléchon A., Mainwaring P., Fleming M., et al. (2012) Increased survival with enzalutamide in prostate cancer after chemotherapy. N. Engl. J. Med. 367, 1187–1197 [DOI] [PubMed] [Google Scholar]
- 10. Smith M. R., Cook R., Lee K. A., and Nelson J. B. (2011) Disease and host characteristics as predictors of time to first bone metastasis and death in men with progressive castration-resistant nonmetastatic prostate cancer. Cancer 117, 2077–2085 [DOI] [PMC free article] [PubMed] [Google Scholar]
- 11. Waltering K. K., Helenius M. A., Sahu B., Manni V., Linja M. J., Jänne O. A., and Visakorpi T. (2009) Increased expression of androgen receptor sensitizes prostate cancer cells to low levels of androgens. Cancer Res. 69, 8141–8149 [DOI] [PubMed] [Google Scholar]
- 12. Sun S., Sprenger C. C., Vessella R. L., Haugk K., Soriano K., Mostaghel E. A., Page S. T., Coleman I. M., Nguyen H. M., Sun H., Nelson P. S., and Plymate S. R. (2010) Castration resistance in human prostate cancer is conferred by a frequently occurring androgen receptor splice variant. J. Clin. Invest. 120, 2715–2730 [DOI] [PMC free article] [PubMed] [Google Scholar]
- 13. Pomerantz M. M., Beckwith C. A., Regan M. M., Wyman S. K., Petrovics G., Chen Y., Hawksworth D. J., Schumacher F. R., Mucci L., Penney K. L., Stampfer M. J., Chan J. A., Ardlie K. G., Fritz B. R., Parkin R. K., et al. (2009) Evaluation of the 8q24 prostate cancer risk locus and MYC expression. Cancer Res. 69, 5568–5574 [DOI] [PMC free article] [PubMed] [Google Scholar]
- 14. Beckedorff F. C., Ayupe A. C., Crocci-Souza R., Amaral M. S., Nakaya H. I., Soltys D. T., Menck C. F., Reis E. M., and Verjovski-Almeida S. (2013) The intronic long noncoding RNA ANRASSF1 recruits PRC2 to the RASSF1A promoter, reducing the expression of RASSF1A and increasing cell proliferation. PLoS Genet. 9, e1003705. [DOI] [PMC free article] [PubMed] [Google Scholar]
- 15. Prensner J. R., Iyer M. K., Balbin O. A., Dhanasekaran S. M., Cao Q., Brenner J. C., Laxman B., Asangani I. A., Grasso C. S., Kominsky H. D., Cao X., Jing X., Wang X., Siddiqui J., Wei J. T., et al. (2011) Transcriptome sequencing across a prostate cancer cohort identifies PCAT-1, an unannotated lincRNA implicated in disease progression. Nat. Biotechnol. 29, 742–749 [DOI] [PMC free article] [PubMed] [Google Scholar]
- 16. Prensner J. R., Iyer M. K., Sahu A., Asangani I. A., Cao Q., Patel L., Vergara I. A., Davicioni E., Erho N., Ghadessi M., Jenkins R. B., Triche T. J., Malik R., Bedenis R., McGregor N., et al. (2013) The long noncoding RNA SChLAP1 promotes aggressive prostate cancer and antagonizes the SWI/SNF complex. Nat. Genet. 45, 1392–1398 [DOI] [PMC free article] [PubMed] [Google Scholar]
- 17. Lee R. S., and Roberts C. W. (2013) Linking the SWI/SNF complex to prostate cancer. Nat. Genet. 45, 1268–1269 [DOI] [PubMed] [Google Scholar]
- 18. Kan Z., Jaiswal B. S., Stinson J., Janakiraman V., Bhatt D., Stern H. M., Yue P., Haverty P. M., Bourgon R., Zheng J., Moorhead M., Chaudhuri S., Tomsho L. P., Peters B. A., Pujara K., et al. (2010) Diverse somatic mutation patterns and pathway alterations in human cancers. Nature 466, 869–873 [DOI] [PubMed] [Google Scholar]
- 19. de Kok J. B., Verhaegh G. W., Roelofs R. W., Hessels D., Kiemeney L. A., Aalders T. W., Swinkels D. W., and Schalken J. A. (2002) DD3(PCA3), a very sensitive and specific marker to detect prostate tumors. Cancer Res. 62, 2695–2698 [PubMed] [Google Scholar]
- 20. Tomlins S. A., Aubin S. M., Siddiqui J., Lonigro R. J., Sefton-Miller L., Miick S., Williamsen S., Hodge P., Meinke J., Blase A., Penabella Y., Day J. R., Varambally R., Han B., Wood D., et al. (2011) Urine TMPRSS2:ERG fusion transcript stratifies prostate cancer risk in men with elevated serum PSA. Sci. Transl. Med. 3, 94ra72. [DOI] [PMC free article] [PubMed] [Google Scholar]
- 21. Srikantan V., Zou Z., Petrovics G., Xu L., Augustus M., Davis L., Livezey J. R., Connell T., Sesterhenn I. A., Yoshino K., Buzard G. S., Mostofi F. K., McLeod D. G., Moul J. W., and Srivastava S. (2000) PCGEM1, a prostate-specific gene, is overexpressed in prostate cancer. Proc. Natl. Acad. Sci. U.S.A. 97, 12216–12221 [DOI] [PMC free article] [PubMed] [Google Scholar]
- 22. Zhang A., Zhao J. C., Kim J., Fong K. W., Yang Y. A., Chakravarti D., Mo Y. Y., and Yu J. (2015) LncRNA HOTAIR enhances the androgen-receptor-mediated transcriptional program and drives castration-resistant prostate cancer. Cell Rep. 13, 209–221 [DOI] [PMC free article] [PubMed] [Google Scholar]
- 23. Takayama K., Tsutsumi S., Katayama S., Okayama T., Horie-Inoue K., Ikeda K., Urano T., Kawazu C., Hasegawa A., Ikeo K., Gojyobori T., Ouchi Y., Hayashizaki Y., Aburatani H., and Inoue S. (2011) Integration of cap analysis of gene expression and chromatin immunoprecipitation analysis on array reveals genome-wide androgen receptor signaling in prostate cancer cells. Oncogene 30, 619–630 [DOI] [PubMed] [Google Scholar]
- 24. Takayama K., Horie-Inoue K., Katayama S., Suzuki T., Tsutsumi S., Ikeda K., Urano T., Fujimura T., Takagi K., Takahashi S., Homma Y., Ouchi Y., Aburatani H., Hayashizaki Y., and Inoue S. (2013) Androgen-responsive long noncoding RNA CTBP1-AS promotes prostate cancer. EMBO J. 32, 1665–1680 [DOI] [PMC free article] [PubMed] [Google Scholar]
- 25. Harrow J., Frankish A., Gonzalez J. M., Tapanari E., Diekhans M., Kokocinski F., Aken B. L., Barrell D., Zadissa A., Searle S., Barnes I., Bignell A., Boychenko V., Hunt T., Kay M., et al. (2012) GENCODE: the reference human genome annotation for the ENCODE Project. Genome Res. 22, 1760–1774 [DOI] [PMC free article] [PubMed] [Google Scholar]
- 26. Takayama K., Suzuki T., Fujimura T., Urano T., Takahashi S., Homma Y., and Inoue S. (2014) CtBP2 modulates the androgen receptor to promote prostate cancer progression. Cancer Res. 74, 6542–6553 [DOI] [PubMed] [Google Scholar]
- 27. Takayama K., Misawa A., Suzuki T., Takagi K., Hayashizaki Y., Fujimura T., Homma Y., Takahashi S., Urano T., and Inoue S. (2015) TET2 repression by androgen hormone regulates global hydroxymethylation status and prostate cancer progression. Nat. Commun. 6, 8219. [DOI] [PubMed] [Google Scholar]
- 28. Endo T. A., Masuhara M., Yokouchi M., Suzuki R., Sakamoto H., Mitsui K., Matsumoto A., Tanimura S., Ohtsubo M., Misawa H., Miyazaki T., Leonor N., Taniguchi T., Fujita T., Kanakura Y., et al. (1997) A new protein containing an SH2 domain that inhibits JAK kinases. Nature 387, 921–924 [DOI] [PubMed] [Google Scholar]
- 29. Naka T., Narazaki M., Hirata M., Matsumoto T., Minamoto S., Aono A., Nishimoto N., Kajita T., Taga T., Yoshizaki K., Akira S., and Kishimoto T. (1997) Structure and function of a new STAT-induced STAT inhibitor. Nature 387, 924–929 [DOI] [PubMed] [Google Scholar]
- 30. Starr R., Willson T. A., Viney E. M., Murray L. J., Rayner J. R., Jenkins B. J., Gonda T. J., Alexander W. S., Metcalf D., Nicola N. A., and Hilton D. J. (1997) A family of cytokine-inducible inhibitors of signalling. Nature 387, 917–921 [DOI] [PubMed] [Google Scholar]
- 31. Takayama K., Horie-Inoue K., Suzuki T., Urano T., Ikeda K., Fujimura T., Takahashi S., Homma Y., Ouchi Y., and Inoue S. (2012) TACC2 is an androgen-responsive cell cycle regulator promoting androgen-mediated and castration-resistant growth of prostate cancer. Mol. Endocrinol. 26, 748–761 [DOI] [PMC free article] [PubMed] [Google Scholar]
- 32. Huang da W., Sherman B. T., and Lempicki R. A. (2009) Bioinformatics enrichment tools: paths toward the comprehensive functional analysis of large gene lists. Nucleic Acids Res. 37, 1–13 [DOI] [PMC free article] [PubMed] [Google Scholar]
- 33. Huang da W., Sherman B. T., Lempicki R. A. (2009) Systematic and integrative analysis of large gene lists using DAVID bioinformatics resources. Nat. Protoc. 4, 44–57 [DOI] [PubMed] [Google Scholar]
- 34. Farooqi A. A., Bhatti S., and Ismail M. (2012) TRAIL and vitamins: opting for keys to castle of cancer proteome instead of open sesame. Cancer Cell Int. 12, 22. [DOI] [PMC free article] [PubMed] [Google Scholar]
- 35. Farooqi A. A., Rana A., Riaz A. M., Khan A., Ali M., Javed S., Mukhtar S., Minhaj S., Rao J. R., Rajpoot J., Amber R., Javed F. A., Waqar-Un-Nisa, Khanum R., and Bhatti S. (2012) NutriTRAILomics in prostate cancer: time to have two strings to one's bow. Mol. Biol. Rep. 39, 4909–4914 [DOI] [PubMed] [Google Scholar]
- 36. Chen S., Gulla S., Cai C., and Balk S. P. (2012) Androgen receptor serine 81 phosphorylation mediates chromatin binding and transcriptional activation. J. Biol. Chem. 287, 8571–8583 [DOI] [PMC free article] [PubMed] [Google Scholar]
- 37. Bevan CL, Hoare S, Claessens F, Heery DM, Parker MG (1999) The AF1 and AF2 domains of the androgen receptor interact with distinct regions of SRC1. Mol. Cell. Biol. 19, 8383–8392 [DOI] [PMC free article] [PubMed] [Google Scholar]
- 38. Varambally S., Yu J., Laxman B., Rhodes D. R., Mehra R., Tomlins S. A., Shah R. B., Chandran U., Monzon F. A., Becich M. J., Wei J. T., Pienta K. J., Ghosh D., Rubin M. A., Chinnaiyan A. M. (2005) Integrative genomic and proteomic analysis of prostate cancer reveals signatures of metastatic progression. Cancer Cell. 8, 393–406 [DOI] [PubMed] [Google Scholar]
- 39. Metcalf D., Greenhalgh C. J., Viney E., Willson T. A., Starr R., Nicola N. A., Hilton D. J., Alexander W. S. (2000) Gigantism in mice lacking suppressor of cytokine signalling-2. Nature 405, 1069–1073 [DOI] [PubMed] [Google Scholar]
- 40. Greenhalgh C. J., Metcalf D., Thaus A. L., Corbin J. E., Uren R., Morgan P. O., Fabri L. J., Zhang J. G., Martin H. M., Willson T. A., Billestrup N., Nicola N. A., Baca M., Alexander W. S., Hilton D. J. (2002) Biological evidence that SOCS-2 can act either as an enhancer or suppressor of growth hormone signaling. J. Biol. Chem. 277, 40181–40184 [DOI] [PubMed] [Google Scholar]
- 41. Neil H., Malabat C., d'Aubenton-Carafa Y., Xu Z., Steinmetz L. M., Jacquier A. (2009) Widespread bidirectional promoters are the major source of cryptic transcripts in yeast. Nature 457, 1038–1042 [DOI] [PubMed] [Google Scholar]
- 42. Sigova A. A., Mullen A. C., Molinie B., Gupta S., Orlando D. A., Guenther M. G., Almada A. E., Lin C., Sharp P. A., Giallourakis C. C., Young R. A. (2013) Divergent transcription of long noncoding RNA/mRNA gene pairs in embryonic stem cells. Proc. Natl. Acad. Sci. U.S.A. 110, 2876–2881 [DOI] [PMC free article] [PubMed] [Google Scholar]
- 43. Almada A. E., Wu X., Kriz A. J., Burge C. B., and Sharp P. A. (2013) Promoter directionality is controlled by U1 snRNP and polyadenylation signals. Nature 499, 360–363 [DOI] [PMC free article] [PubMed] [Google Scholar]
- 44. Ntini E., Järvelin A. I., Bornholdt J., Chen Y., Boyd M., Jørgensen M., Andersson R., Hoof I., Schein A., Andersen P. R., Andersen P. K., Preker P., Valen E., Zhao X., Pelechano V., et al. (2013) Polyadenylation site-induced decay of upstream transcripts enforces promoter directionality. Nat. Struct. Mol. Biol. 20, 923–928 [DOI] [PubMed] [Google Scholar]
- 45. Rhee H. S., and Pugh B. F. (2012) Genome-wide structure and organization of eukaryotic pre-initiation complexes. Nature 483, 295–301 [DOI] [PMC free article] [PubMed] [Google Scholar]
- 46. Marquardt S., Escalante-Chong R., Pho N., Wang J., Churchman L. S., Springer M., and Buratowski S. (2014) A chromatin-based mechanism for limiting divergent noncoding transcription. Cell 157, 1712–1723 [DOI] [PMC free article] [PubMed] [Google Scholar]
- 47. Pan G., Ni J., Wei Y. F., Yu G., Gentz R., and Dixit V. M. (1997) An antagonist decoy receptor and a death domain-containing receptor for TRAIL. Science 277, 815–818 [DOI] [PubMed] [Google Scholar]
- 48. Pan G., O'Rourke K., Chinnaiyan A. M., Gentz R., Ebner R., Ni J., and Dixit V. M. (1997) The receptor for the cytotoxic ligand TRAIL. Science 276, 111–113 [DOI] [PubMed] [Google Scholar]
- 49. Aytes A., Mitrofanova A., Lefebvre C., Alvarez M. J., Castillo-Martin M., Zheng T., Eastham J. A., Gopalan A., Pienta K. J., Shen M. M., Califano A., and Abate-Shen C. (2014) Cross-species regulatory network analysis identifies a synergistic interaction between FOXM1 and CENPF that drives prostate cancer malignancy. Cancer Cell 25, 638–651 [DOI] [PMC free article] [PubMed] [Google Scholar]
- 50. Lefebvre C., Rajbhandari P., Alvarez M. J., Bandaru P., Lim W. K., Sato M., Wang K., Sumazin P., Kustagi M., Bisikirska B. C., Basso K., Beltrao P., Krogan N., Gautier J., Dalla-Favera R., and Califano A. (2010) A human B-cell interactome identifies MYB and FOXM1 as master regulators of proliferation in germinal centers. Mol. Syst. Biol. 6, 377. [DOI] [PMC free article] [PubMed] [Google Scholar]
- 51. Zhang N., Wei P., Gong A., Chiu W. T., Lee H. T., Colman H., Huang H., Xue J., Liu M., Wang Y., Sawaya R., Xie K., Yung W. K., Medema R. H., He X., and Huang S. (2011) FoxM1 promotes β-catenin nuclear localization and controls Wnt target-gene expression and glioma tumorigenesis. Cancer Cell 20, 427–442 [DOI] [PMC free article] [PubMed] [Google Scholar]
- 52. Arany I., Muldrow M., and Tyring S. K. (2001) Correlation between mRNA levels of IL-6 and TNFα and progression rate in anal squamous epithelial lesions from HIV-positive men. Anticancer Res. 21, 425–428 [PubMed] [Google Scholar]
- 53. Schultheis B., Carapeti-Marootian M., Hochhaus A., Weisser A., Goldman J. M., and Melo J. V. (2002) Overexpression of SOCS-2 in advanced stages of chronic myeloid leukemia: possible inadequacy of a negative feedback mechanism. Blood 99, 1766–1775 [DOI] [PubMed] [Google Scholar]
- 54. Wikman A., Olsson I., Shanwellt A., and Lundahl J. (2001) Detection by flow cytometry of antibodies against surface and intracellular granulocyte antigens. Scand. J. Clin. Lab. Invest. 61, 307–316 [DOI] [PubMed] [Google Scholar]
- 55. Sutherland K. D., Lindeman G. J., Choong D. Y., Wittlin S., Brentzell L., Phillips W., Campbell I. G., and , J. E. (2004) Differential hypermethylation of SOCS genes in ovarian and breast carcinomas. Oncogene 23, 7726–7733 [DOI] [PubMed] [Google Scholar]
- 56. Iglesias-Gato D., Chuan Y. C., Wikström P., Augsten S., Jiang N., Niu Y., Seipel A., Danneman D., Vermeij M., Fernandez-Perez L., Jenster G., Egevad L., Norstedt G., and Flores-Morales A. (2014) SOCS2 mediates the cross-talk between androgen and growth hormone signaling in prostate cancer. Carcinogenesis 35, 24–33 [DOI] [PubMed] [Google Scholar]
- 57. Hoefer J., Kern J., Ofer P., Eder I. E., Schäfer G., Dietrich D., Kristiansen G., Geley S., Rainer J., Gunsilius E., Klocker H., Culig Z., and Puhr M. (2014) SOCS2 correlates with malignancy and exerts growth-promoting effects in prostate cancer. Endocr. Relat. Cancer 21, 175–187 [DOI] [PMC free article] [PubMed] [Google Scholar]
- 58. Yang L., Lin C., Jin C., Yang J. C., Tanasa B., Li W., Merkurjev D., Ohgi K. A., Meng D., Zhang J., Evans C. P., and Rosenfeld M. G. (2013) lncRNA-dependent mechanisms of androgen-receptor-regulated gene activation programs. Nature 500, 598–602 [DOI] [PMC free article] [PubMed] [Google Scholar]
- 59. Hung C. L., Wang L. Y., Yu Y. L., Chen H. W., Srivastava S., Petrovics G., and Kung H. J. (2014) A long noncoding RNA connects c-Myc to tumor metabolism. Proc. Natl. Acad. Sci. U.S.A. 111, 18697–18702 [DOI] [PMC free article] [PubMed] [Google Scholar]


