

Abstract
Although the importance of the C terminus of the α subunit of the heterotrimeric G protein in G protein-coupled receptor (GPCR)-G protein pairing is well established, the structural basis of selective interactions remains unknown. Here, we combine live cell FRET-based measurements and molecular dynamics simulations of the interaction between the GPCR and a peptide derived from the C terminus of the Gα subunit (Gα peptide) to dissect the molecular mechanisms of G protein selectivity. We observe a direct link between Gα peptide binding and stabilization of the GPCR conformational ensemble. We find that cognate and non-cognate Gα peptides show deep and shallow binding, respectively, and in distinct orientations within the GPCR. Binding of the cognate Gα peptide stabilizes the agonist-bound GPCR conformational ensemble resulting in favorable binding energy and lower flexibility of the agonist-GPCR pair. We identify three hot spot residues (Gαs/Gαq-Gln-384/Leu-349, Gln-390/Glu-355, and Glu-392/Asn-357) that contribute to selective interactions between the β2-adrenergic receptor (β2-AR)-Gαs and V1A receptor (V1AR)-Gαq. The Gαs and Gαq peptides adopt different orientations in β2-AR and V1AR, respectively. The β2-AR/Gαs peptide interface is dominated by electrostatic interactions, whereas the V1AR/Gαq peptide interactions are predominantly hydrophobic. Interestingly, our study reveals a role for both favorable and unfavorable interactions in G protein selection. Residue Glu-355 in Gαq prevents this peptide from interacting strongly with β2-AR. Mutagenesis to the Gαs counterpart (E355Q) imparts a cognate-like interaction. Overall, our study highlights the synergy in molecular dynamics and FRET-based approaches to dissect the structural basis of selective G protein interactions.
Keywords: cell signaling, fluorescence resonance energy transfer (FRET), G protein, G protein-coupled receptor (GPCR), molecular dynamics, Receptor Conformation
Introduction
In recent years, there has been significant progress in structural and spectroscopic studies of Class A G protein-coupled receptors (GPCR),3 which are energizing structure-based drug discovery efforts (1–8). Although these studies clearly demonstrate ligand-dependent structural changes in the GPCR, there remains a paucity of information on how GPCR conformation translates to selective G protein activation (9). Without structural information to compare and contrast multiple GPCR/G protein interfaces, the underlying mechanisms of selection remain incompletely understood. Currently, there is only one crystal structure of the complete GPCR/G protein interface (β2-AR·Gs complex) that provides a single essential snapshot of a highly dynamic interaction (10). Hence, alternative approaches are essential to dissect the structural elements within both the GPCR and its effectors that confer signaling specificity within the cellular environment. In this study, we combine FRET-based measurements of the GPCR/G protein interface in live cells, combined with computational modeling to build a rational scalable approach to identify structural hot spots that drive effector selection.
One critical and well characterized component of the GPCR/G protein interface is the C terminus of the Gα subunit (11–28). The Gα C terminus alone constitutes 76% of the atoms making contact in the GPCR/G protein interface in the β2-AR·Gs crystal structure (10). Previous studies have shown that the Gα C terminus is essential for G protein activation by the GPCR (15, 18, 22, 28, 29), and the last three residues of the Gα C terminus are important for selective G protein activation (13). We recently developed a FRET-based sensor to probe the interaction between the GPCR and the Gα C terminus in live cells (30). The sensor is based on a technique termed SPASM (systematic protein affinity strength modulation) that involves tethering two proteins/protein domains by an ER/K linker flanked by a FRET pair (mCerulean, FRET donor, and mCitrine, FRET acceptor) (31). Sensor FRET correlates linearly with the fraction of the sensors in the bound state (31). The ER/K linker also controls the effective concentration of the protein interaction. We combine the SPASM sensor-based measurements with molecular dynamics (MD) simulations in an iterative fashion to delineate the structural basis of selective interactions between the GPCR and the Gα C terminus.
Using a combination of FRET sensors and MD simulations, we first demonstrate that the GPCR/Gα C-terminal interaction sufficiently captures the selectivity for the dominant signaling pathway for six different Class A GPCRs in live cells. The interaction energy calculated from MD simulation for the agonist-GPCR pair with the cognate Gα C-terminal peptide is favorable compared with the non-cognate peptide. Additionally, the intracellular region of the agonist-GPCR conformation ensemble shows reduced flexibility when bound to the cognate Gα C-terminal peptide. A combination of MD and sequence analysis reveals three “hot spot” residues in the Gα C terminus that contribute significantly to the interaction energy necessary for cognate Gα selection. Importantly, the distinct residues in Gαs and Gαq are conserved across species, suggesting these residues constitute a conserved structural mechanism for GPCRs to differentiate between G protein subtypes. Point mutations of hot spot residues within the Gα C terminus result in increased interaction of non-cognate GPCR/Gα C-terminal peptides and affect downstream signaling profiles, validating our structural observations in the cellular milieu.
Results
We previously reported a FRET sensor that probes the interaction between the GPCR and the C terminus of the Gα subunit and characterized it in live HEK-293T cells (30). The sensor contains, as a single polypeptide, the following: a full-length GPCR, mCitrine, a 10-nm ER/K linker, mCerulean, and the C-terminal peptides of Gαs, Gαi, or Gαq, all of which are separated by (GSG)4 linkers (Fig. 1a). Our previous report showed an agonist-dependent selective interaction for the Gαs C terminus with β2-AR (30). Here, we investigate whether other Gs-, Gi-, and Gq-coupled GPCRs show similar agonist-dependent selectivity for their cognate Gα C-terminal “peptides.”
FIGURE 1.

Gα C terminus minimally sufficient to detect cognate pathway for six Class A GPCRs. a, schematic of GPCR FRET sensor expressed at plasma membrane in dissociated, low FRET and associated, high FRET state. b–d, Gs-coupled GPCRs (β3-adrenergic receptor; dopamine receptor D1), Gi-coupled GPCRs (α2-adrenergic receptor; cannabinoid receptor type 1 (CB1)), and Gq-coupled GPCR FRET sensors (α1-adrenergic receptor; vasopressin 1A receptor) tethered to no-peptide (N), s, i, or q peptide and test for change in FRET upon agonist stimulation. e, GPCR selects for G protein via Gα C terminus. Results are expressed as mean ± S.E. of three independent experiments performed in triplicate (n ≥ 3). Asterisks represent significant differences between the indicated peptide compared with no-peptide using Tukey's multiple comparison test. Full statistical results are in supplemental Tables 1 and 2. *, p ≤ 0.05; ***, p ≤ 0.001; ****, p ≤ 0.0001.
Gα C Terminus Is Minimally Sufficient for Detecting Cognate Signaling Pathway
Fig. 1b shows that changes in FRET intensity exemplify the selectivity of canonical Gs-coupled receptors, β3-adrenergic receptor (β3-AR), and dopamine receptor D1 (D1R) to the s peptide. β3-AR was chosen as an additional s-coupled receptor as we have previously tested β2-AR (30). Receptors tethered to the s, i, q, or no-peptide control are activated using full agonists (100 μm isoproterenol and 100 μm dopamine, respectively). For β3-AR, the s peptide shows the most significant change in FRET (ΔFRET = 0.0267) compared with no-peptide control (ΔFRET = 0.0020, p ≤ 0.0001). The s peptide also has a significant FRET change compared with the i peptide (ΔFRET = 0.0120, p ≤ 0.001). Analysis of variance (ANOVA) values are provided in supplemental Table 1 for comparison of all four receptor-peptide pairings. Tukey's multiple comparison test values are in supplemental Table 2 analyzing pairwise significance for all receptor-peptide pairings. This selection for the s peptide is also observed for D1R, where the s peptide change in FRET is most significant at ΔFRET = 0.0192 (p ≤ 0.0001). Unmarked bars are n.s. compared with no peptide. For these Gs-coupled receptors, the sensor detects a significant s peptide selection bias in the presence of full agonists. We further tested whether the Gα C terminus is sufficient for Gi- and Gq-coupled receptors to select for their cognate pathways using this tethered FRET system. Sensors were designed for Gi-coupled receptors, α2-adrenergic receptor (α2-AR), and cannabinoid receptor type 1 (CB1), and the same peptide constructs were tested with receptor-specific full agonists (100 μm epinephrine and 100 μm 2-AG) (Fig. 1c). Both α2-AR and CB1 show a significant change in FRET for i peptide compared with no-peptide control, s, or q peptide (p ≤ 0.0001). CB1 also has significant changes in FRET for s peptides (p ≤ 0.05) and q peptides (p ≤ 0.001) compared with no peptide. These changes may be a result of receptor promiscuity as well as a result of interactions with the receptor and endogenous G protein in the cells. The trend also holds for Gq-coupled receptors, α1-adrenergic receptor (α1-AR), and vasopressin 1A receptor (V1AR) (Fig. 1d). α1-AR significantly selects q peptide compared with no peptide (p ≤ 0.0001) upon stimulation with 100 μm phenylephrine as does V1AR (p ≤ 0.0001) with 100 μm AVP. V1AR also selects q peptide significantly compared with s or i peptides (p ≤ 0.0001). Although the Gα C terminus has repeatedly been shown as an important component for G protein selection (13, 16), our measurements here show it is minimally sufficient for selection across many GPCRs (Fig. 1e).
Computational techniques were used to better understand the molecular basis of GPCR selectivity for the Gα C-terminal peptide, observed in the FRET sensor measurements. Gs- and Gq-coupled receptors were chosen for modeling because their signaling profiles involve different secondary messengers. Although this approach can also be applied to Gi-coupled receptors, the dual influence of Gs and Gi on adenylyl cyclase, and consequently cAMP levels, complicates interpretation of second messenger profiles. Nonetheless, future studies will address the selection between Gs, Gi, and Gq pathways. We modeled an ensemble of conformations for the isoproterenol·β2-AR·s peptide complex and the AVP·V1AR·q peptide complex as detailed under “Experimental Procedures.” β2-AR was chosen due to the availability of the Gαs-bound fully active state crystal structure (10). This structure provides an accurate starting model for computational studies. Additionally, previous FRET sensor measurements also show the selective interaction of β2-AR and Gαs peptide (30). A Gq-coupled receptor was used to discern the differences in s and q peptide binding. For this receptor, we generated a homology model for the Gq-coupled receptor, V1AR, derived from the nanobody-bound active state structure of the μ-opioid receptor (32).
GPCR Binding to Cognate Peptide Is Energetically Favorable and Reduces the Conformational Flexibility of the GPCR
Fig. 2a shows the transmembrane (panels i and iv) and intracellular views (panels ii and v) of the ensemble of conformations and different orientations the Gα C-terminal peptides extracted from the MD simulations as follows: s peptide in β2-AR (left) and q peptide in V1AR (right). The s peptide inserts into β2-AR in a region encompassing transmembrane helix 3 (TM3)/ICL2/TM5 and extends toward TM7/H8; however, in V1AR, the q peptide inserts between TM3/TM5 and extends toward TM2. Fig. 2a (panels iii and vi) show the distinct conformations from the ensemble of β2-AR and V1AR bound to their cognate peptides. The overall root mean square fluctuation (RMSF) of β2-AR and V1AR does not show significant differences between cognate and non-cognate peptide-bound complexes throughout the simulations (supplemental Fig. 1). We further assessed conformational flexibility in the GPCR·peptide complexes by focusing on fluctuations in the intracellular regions of the receptor. For this, we measured the distance between the intracellular regions of TM3 and TM6 and plotted the distribution of this distance from each simulation (Fig. 2b). The outward movement of the intracellular portion of TM6 away from the intracellular portion of TM3 reflects a critical conformational change required for GPCR activation and binding to G protein (33). As depicted, the range of TM3–TM6 distances is ∼3.9 Å for β2-AR with s peptide and 5.7 Å for both i and q peptides. Similarly, we observed a range of 3.7 Å for V1AR with q peptide but 5.0 and 4.2 Å for s and i peptides, respectively. Measures of central tendency for each distribution are included in supplemental Table 3. We assessed the similarity between the distributions of TM3–TM6 distances for each receptor-peptide pair using a two-sample Kolmogorov-Smirnov test (supplemental Table 4), which indicates that all the distributions are significantly different. For both receptors, binding to cognate Gα peptides reduces the receptor's intracellular flexibility and results in a narrower range of distances sampled between TM3–TM6, leading to tighter binding by the GPCR to the cognate Gα peptide. The variance in TM3–TM6 distance is wider for the non-cognate Gα peptides leading to weaker binding. This is highlighted in Fig. 2a, (panels iii and iv) in which conformations with the maximum (‡) and minimum (*) deviations in the positions of TM6 have been marked. To test the accuracy of our dynamic ensembles in capturing cognate binding, we calculated the non-bonded Coulombic and van der Waals components of the GPCR/peptide interaction energies and compared this to previously published experimental FRET measurements (30) and those reported here (Fig. 1d). Fig. 2c shows a strong correlation between the strength of GPCR·peptide binding energy and ΔFRET. Favorable non-bonded interactions that stabilize the cognate GPCR·peptide also reduce TM3–TM6 flexibility in the Gα peptide-bound conformation (Fig. 2b).
FIGURE 2.

GPCR binds tighter to cognate peptide and is more energetically favored. a, transmembrane (panels i and iv) views of β2-AR·s peptide complex (left) and V1AR·q peptide complex (right) with peptide movements during simulation; intracellular view of peptide movements during simulation (panels ii and v); intracellular view of receptor movement during simulation (panels iii and vi), with maximum (‡) and minimum (*) positions of TM 6 throughout simulation. b, distances measured (in Å) between TM3 and TM6 for β2-AR·peptide complexes (left) and V1AR·peptide complexes (right) with s peptide (red), i peptide (blue), and q peptide (green). Population density expressed as a fraction of whole. c, binding energies (−kcal/mol) of β2-AR·peptide and V1AR·peptide complexes with s, i, and q peptides compared with ΔFRET (30). Binding energy results are expressed as mean ± S.E. of five independent replicates of 100-ns simulations. ΔFRET results are expressed as mean ± S.E. of three independent experiments of at least three repeats per experiments. Table lists the binding energy and ΔFRET values presented in the graph with calculated S.D.
Gαs and Gαq Peptides Interact with Different Receptor Binding Surfaces
To further explore which structural components of the GPCR/G protein interface contribute to peptide selection, we analyzed the nature of the residues located in the surface of the peptide binding grooves in the GPCR after optimization of peptide binding using MD. Fig. 3a shows the nature of different residues within the binding groove of β2-AR and V1AR when bound to their cognate peptides, s peptide in red and q peptide in blue. The nature of the residues in the binding surface of the receptor is represented by the colored surface as follows: yellow (non-charged polar residues); red (anionic residues); blue (cationic residues); and white (hydrophobic residues). Most notably, the characteristics and the location of the residues in the binding groove of β2-AR and V1AR with which the cognate peptide interacts vary significantly. In β2-AR the outer edge and center of the binding groove are populated with polar residues. V1AR shows a more hydrophobic binding groove, particularly near the outer edge of the interface (Fig. 3a), and most of its polar residues clustered in the center of the interface (Fig. 3a). The cognate peptides orient and bind differently between the two receptors, despite starting the MD simulations from the same initial orientations. The center of each peptide interacts in a similar groove of the receptor interface, always between TM5 and TM3/ICL2, but the extreme C terminus of the peptide orients toward different positions in the receptor interface. The s peptide points toward TM7 and helix 8 in β2-AR, whereas the q peptide points toward TM2 in V1AR. To identify residues in the C-terminal peptides that contribute significantly to the binding of the GPCR, we calculated the interaction energies of the residues in the s peptide to the residues in the binding groove in β2-AR, and the same for the q peptide to V1AR. Fig. 3b shows the increasing favorable interaction energies mapped as colored gradation in the s peptide (white to red) and q peptide (white to blue) with β2-AR and V1AR, respectively. Residues in the s and q peptides making tighter contacts with favorable interaction energies are represented with deeper shading. About eight amino acids in the N terminus “head” region (Fig. 3b) of both the s and q peptides are disordered and show no significant interactions with their respective receptors. It is evident that the s and q peptides interact with the receptor in different ways. The s peptide has its strongest interactions both at the C-terminal “tail” and “neck” of the peptide, denoted in Fig. 3b. The q peptide, in contrast, makes its strongest contacts at the C-terminal tail. To identify the residues that are “hot spots” in the interaction of the peptides with their respective GPCRs, we did two types of analyses as follows: (a) sequence alignment of the s and q peptides shown in Fig. 3c, with (from left to right) the head, neck, and tail demarcated by dashed lines, and (b) identify the residues that make tight contacts between the peptide and the receptor for more than 50% of the simulation time. These residues are shown in black in the sequence alignment in Fig. 3c. Sequence alignment revealed a few positions that are divergent between the s and q peptides. From the s peptide we identified the polar residue, Gln-384 (glutamine) that is replaced by a hydrophobic Leu-349 (leucine) in the q peptide. The residues Gln-390 and Glu-392 in the s peptide are replaced by residues with similar properties, Glu-355 and Asn-357, in the q peptide. However, the interaction energies of these residues with their respective receptors are different (data not shown). Based on these findings, we first chose one residue pair from the neck (Gln-384/Leu-349) and one from the tail (Glu-392/Asn-357) regions to test the effects of the neck and tail regions on binding and orientation of the peptide to β2-AR and V1AR.
FIGURE 3.

Electrostatic, energetic, and structural differences in GPCR/peptide interface identify three hot spots for binding. a, intracellular view of β2-AR·s peptide complex (left) and V1AR·q peptide complex (right) showing surface representation of the receptor's binding interface coupled with cognate peptide. Charged residues are colored as follows: anionic (red), cationic (blue), non-charged polar (yellow), and hydrophobic (white). b, colored gradation indicating distribution of energetically favored (white to color: unfavorable to favorable) residue positions in s (left) and q (right) peptides based on simulation with cognate receptors. Peptides are rotated 180° about their principal axis to display GPCR contacting interface. Head, neck, and tail regions of C termini are denoted between dashed lines. c, structure-based sequence alignment of Gαs and Gαq C termini depicts residues binding to receptor (black) and residues left out of interface (gray). Residue similarity denoted as follows: identical (*); conservative, maintenance of charges (:); semi-conservative, replacement of charges (.); non-synonymous, changed chemical properties (no symbol). d, hot spot residues conferring specificity of Gαs binding to β2-AR and Gαq binding to V1AR.
Single-point Mutants Sufficient to Alter Selection in V1AR but not in β2-AR
The single residues Gln-384/Leu-349 and Glu-392/Asn-357 were tested for their role in GPCR/peptide binding using ΔFRET measurements of single-point mutants in the s peptide (Q384L and E392N) and q peptide (L349Q and N357E) within the V1AR sensor (Fig. 4a). In the q peptide, the L349Q mutant exhibited a 46.1% decrease in ΔFRET compared with the wild type (p ≤ 0.0001). The reverse mutation (Q384L) done in V1AR·s peptide showed a 134.5% increase in ΔFRET compared with wild type (p ≤ 0.01). Similarly, the N357E mutant in the q peptide resulted in a 38.8% decrease in ΔFRET (p ≤ 0.0001), and the reverse mutation in s peptide, E392N, caused a 78.8% increase in ΔFRET (p ≤ 0.05). The downstream signaling effects of these interactions were examined functionally using a cAMP assay with tethered V1AR·Gαs WT and mutant constructs (Fig. 4b). Expression of both Gαs-Q384L and Gαs-E392N mutants resulted in ∼38 and 53% increases in cAMP production upon stimulation with 100 nm AVP (p ≤ 0.001 and p ≤ 0.01, respectively). When these single-point mutants were tested with the β2-AR FRET sensor (Fig. 4c), Q384L did not show a significant change in ΔFRET compared with wild-type s peptide (p > 0.05), although there was an observable loss in binding for the E392N s peptide mutant (∼30%, p ≤ 0.0001). The results with β2-AR and mutant q peptides were non-reciprocal to the results obtained with the V1AR·s peptide, and we showed that β2-AR/Gα binding is not switchable with single-point mutations.
FIGURE 4.

Single point mutations are sufficient to enhance peptide binding in V1AR but not β2-AR. a, ΔFRET assay for agonist-stimulated V1AR testing single-point mutations in q peptide (L349Q and N357E) and s peptide (Q384L and E392N) compared with WT q and s peptide, respectively. b, cAMP assay for single-point mutations (Q384L and E392N) in Gαs-tethered V1AR FRET sensor compared with WT or untransfected HEK-293 (basal). c, ΔFRET assay with β2-AR testing single-point mutations in s and q peptides compared with WT. Results are expressed as mean ± S.E. of three independent experiments performed in triplicate. Asterisks represent significance of mutant peptides compared with WT peptide using Student's unpaired t test. *, p ≤ 0.05; **, p ≤ 0.01; ***, p ≤ 0.001; ****, p ≤ 0.0001; n.s., not significant.
β2-AR Stabilizes Peptide Selection through Both the Tail and Neck Regions of the Gα C Terminus
To rationalize how these single-point mutations differentially influenced peptide binding between V1AR and β2-AR, we analyzed the simulation trajectories of β2-AR with the Gα peptides. Fig. 5a highlights the different orientations that wild-type s and q peptides take when bound to the β2-AR binding pocket. The q peptide does not bind as deep as the s peptide. Taking a closer look at the hot spot residues identified in Fig. 3, Gln-390 in the s peptide makes several contacts with anionic and polar residues in β2-AR (Fig. 5b). However, the homologous residue in the q peptide, Glu-355, shows a repulsion from this pocket and appears to alter the orientation of the q peptide in the β2-AR interface (Fig. 5b). We predicted that the Glu-355 residue of the q peptide introduces a strong barrier to the q peptide binding in β2-AR and proposed to test this residue with the β2-AR FRET sensor. The E355Q single mutant has a gain in ΔFRET of 119.4% (p ≤ 0.01); the q peptide double mutant L349Q/E355Q significantly improves interaction with β2-AR, with a gain of 145.5% (p ≤ 0.0001) (Fig. 5c). The E355Q/N357E double mutant did not show a significant change in ΔFRET (p > 0.1). We further performed MD simulations (with the same procedure as the β2-AR receptor bound to the wild-type s peptide described under “Experimental Procedures”) on isoproterenol-bound β2-AR with the double mutant q peptide L349Q/E355Q. We observed that the double mutant q peptide (shown in purple) is able to bind deeper in β2-AR and translates to an orientation closer to that of the s peptide (red) compared with the q peptide (blue) (Fig. 5, a and d). In the simulated L349Q/E355Q double mutant, the E355Q residue is able to regain contact with polar residues in the binding pocket (Fig. 5e), and the receptor also samples a tighter range of TM3–TM6 distances with the q peptide L349Q/E355Q mutant compared with WT q peptide (Fig. 5f).
FIGURE 5.

Glu-355 hot spot residue in q peptide shows steric clash in β2-AR interface, resolved by mutation to glutamine. a, overlain structures of s (red) and q (blue) peptides in β2-AR interface shows shallow rearranged orientation of q peptide compared with s peptide. b, intermolecular contacts (within 5 Å) made between Gln-390 of s peptide and β2-AR (left) are found outside of suitable binding (>6 Å) radius from Glu-355 in q peptide bound to β2-AR (right). c, ΔFRET assay with β2-AR testing E355Q q peptide mutant in context of single-point mutation, L349Q/E355Q double mutant, and E355Q/N357E double mutant compared with WT q peptide. d, double mutation of Glu-355 and Leu-349 in q peptide to glutamine rearranges mutant q peptide (purple) orientation to s peptide-like (red) orientation within β2-AR interface. e, several intermolecular contacts made between Gln-390 in s peptide and β2-AR are restored in the L349Q/E355Q q peptide interaction with β2-AR (highlighting E355Q residue). f, TM3 to TM6 distance measured in β2-AR bound to s, q, and q double mutant peptides. Results for ΔFRET are expressed as mean ± S.E. of three independent experiments performed in triplicate. Asterisks represent significance of mutant peptides compared with WT peptide using Student unpaired t test. **, p ≤ 0.01; ****, p ≤ 0.0001.
Discussion
Hot Spot Residues in the Gα C Terminus
Delineating the structural basis of G protein selectivity in GPCR/G protein pairings is an important goal for structure-based drug discovery, yet remains an outstanding challenge. Although the C terminus of the Gα subunit has long been recognized as an important determinant in GPCR/G protein coupling (13, 15), the structural basis of selective interactions is unexplored. In this study, we combined molecular dynamics simulations and live cell FRET measurements to probe the GPCR/Gα C-terminal peptide interaction in β2-AR and V1AR. Iterative integration of these approaches reveals three hot spot residues (Gαs/Gαq-Gln-384/Leu-349, Gln-390/Glu-355, and Glu-392/Asn-357) that together determine differential signaling through Gs- and Gq-coupled pathways. Swapping these residues, either individually or in combination, switches the agonist-stimulated GPCR/peptide interaction in live cells (Figs. 4 and 5). Closer examination of the GPCR/peptide interface reveals distinct modes of interaction for the Gαs and Gαq C termini with their cognate GPCRs. The β2-AR/Gαs interaction shows several electrostatic interactions between a charged β2-AR cytosolic pocket and a charged Gαs C terminus (Fig. 3a). In contrast, the V1AR/Gαq interaction is dominated by only two residues in the Gαq C terminus (Asn-357 and Leu-349) that interact with a predominantly hydrophobic surface presented by the Gq-coupled receptor (Fig. 3a). The presence of multiple charged interactions in the β2-AR/s peptide interaction is also consistent with the more modest effects of single-point mutations compared with V1AR/Gαq (Fig. 4).
Our study suggests two distinct regions within the Gα C terminus, a central neck region that makes electrostatic or hydrophobic interactions (based on GPCR-peptide pairing) and the extreme C-terminal tail region that is important for peptide orientation. The Gαs C terminus has multiple favorable polar interactions with β2-AR within both the neck and tail regions (Fig. 3b, left), whereas the Gαq C terminus has favorable electrostatic interactions with V1AR only in the tail region (Fig. 3b, right). We propose that the different modes of interaction of the Gαs and Gαq C termini account for the asymmetry in ΔFRET changes upon single-point mutations between β2-AR and V1AR (Figs. 4 and 5c). The q peptide requires hydrophobic-to-polar residue mutations in the neck and fine-tuning of the polar and charged residues in the tail to increase its affinity for β2-AR, whereas the s peptide requires additional hydrophobic residues in its C-terminal neck to increase its binding with V1AR. Both s and q peptides have similar types of residues in positions 390QYE392/355EYN357, respectively. The QYE/EYN residues in either peptide make strong contacts with the polar region in the center of V1AR (Fig. 3a). Therefore, we conclude that minimal improvements in the neck or tail of s peptide improve its binding to V1AR, whereas multiple substitutions in the q peptide are necessary to promote its binding to β2-AR.
Although two of the hot spots identified here reside within the last five C-terminal residues previously characterized as important for pathway selection (13), the precise structural mechanism for this selectivity has not been previously examined. Our systematic dissection of the structural interface reveals a role for both favorable and unfavorable interactions in G protein selection. Gln-390 in the Gαs C terminus makes favorable electrostatic interactions with β2-AR (Fig. 5b). In contrast, the homologous residue in the Gαq C terminus (Glu-355) cannot coordinate equivalent interactions within the β2-AR cytosolic pocket (Fig. 5b). Hence, Gαq is unable to interact with β2-AR until the unfavorable glutamic acid (Glu-355) is substituted for a glutamine (E355Q). Accordingly, a Gαq peptide with mutations in both regions (L349Q/E335Q) adopts the same orientation and location as the Gαs C-terminal peptide and leads to an enhanced β2-AR/Gαq interaction in live cells (Fig. 5c).
Stabilizing the Active TM6 Outward Tilt
Our study provides a direct link between binding of the Gα C terminus and GPCR conformation. The current view of the GPCR structure is that the receptor in the absence of any ligand or G protein populates a broad conformational ensemble (6, 34). Binding of an agonist shifts the relative population of this conformational ensemble, whereas the agonist in combination with G protein stabilizes the fully active conformation (34). We report similar findings using molecular dynamics simulations albeit with the binding of only the cognate Gα C terminus (Fig. 2). The connection between Gα C terminus binding and GPCR conformation is further evident when examining the preferred location and orientation of the Gα C-terminal peptide in relation to the GPCR. Consistent with crystal structures of β2-AR·Gs and rhodopsin·Gαt peptide (10, 35), we find distinct orientations of different Gα C termini when bound to their cognate GPCR (Fig. 3a). When comparing the cognate and non-cognate interactions, we find that the cognate Gα C terminus inserts deeper into the GPCR cytosolic pocket, and in a distinct orientation compared with the non-cognate interaction (Fig. 6). Deep binding of the Gα C terminus in a specific orientation reduces the flexibility of the receptor in the intracellular regions of TM3 and TM6 (Fig. 2). In both cognate interactions, β2-AR/Gs and V1AR/Gq, the Gα C terminus makes significant contact with TM3 and TM6 of the receptor. This allows TM3 and TM6 to function as molecular “chopsticks” to hold the cognate Gα C terminus in place. In contrast, the non-cognate Gα C terminus displays shallow binding in a different orientation, leading to weaker binding and loss of contact with TM3 and TM6 (Figs. 2 and 6). However, point mutagenesis of the non-cognate Gα C terminus is sufficient to adjust the orientation (Fig. 5c) and correspondingly regain significant contact with TM3 and TM6 of the GPCR, stabilizing a conformational ensemble that mimics the dynamics of the cognate interaction (Fig. 5f).
FIGURE 6.
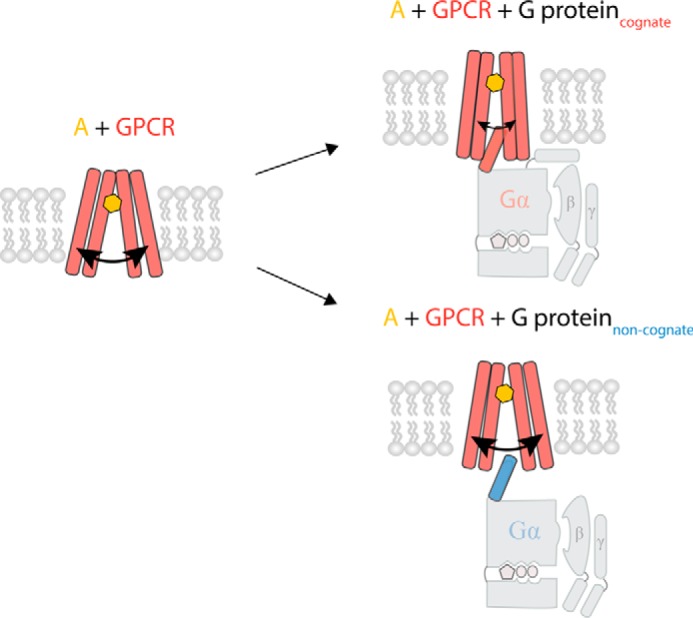
C terminus of cognate G protein stabilizes GPCR conformational flexibility, allowing tighter binding to G protein, deeper insertion of C terminus in receptor interface. Agonist-stimulated GPCRs are able to interact with different G proteins; however, the cognate G protein binds deeper into the receptor based on favorable interactions between the Gα C terminus and the GPCR, whereas the non-cognate interaction is hindered by unfavorable interactions between Gα C terminus and GPCR.
Integrating Computational Modeling with Experiments in Live Cells
The GPCR/G protein interaction is inherently dynamic at the interface. The crystal structure of the β2-AR·Gs complex provides an essential snapshot of the interaction but does not capture the dynamics of the interaction (10). Likewise, spectroscopy-based approaches to examine the GPCR conformational ensemble do not resolve individual structural interactions (2, 4). Neither of these approaches is easily scalable to compare and contrast different GPCR/G protein pairings. Molecular dynamics (MD) can be scaled to examine different GPCR/G protein pairs, especially given the ability of homology modeling to create new GPCR/G protein combinations. However, given the diversity of parameters that can influence simulation trajectories, and the large structural interface, MD is best paired with a suitable experimental approach that permits iterative dissection and validation of its findings. We have previously demonstrated the utility of GPCR SPASM sensors in analyzing the effects of single-point mutations in the GPCR/Gα C-terminal peptide interaction (30). Here, our study interdigitates MD and SPASM sensor measurements to dissect both hot spot residues and provide a rationale for the ensemble GPCR/Gα C-terminal peptide interaction. Our study serves as proof-of-concept using the disparate β2-AR/Gαs and V1AR/Gαq pairs. Future studies will examine the implications of our findings across a broader range of GPCR/G protein pairings and extend to structural elements in the GPCR that drive ligand-dependent effector selection.
Experimental Procedures
Buffers and Reagents
(−)-Isoproterenol (+)-bitartrate salt, dopamine hydrochloride, epinephrine (+)-bitartrate salt, and phenylephrine hydrochloride were purchased from Sigma. 2-AG was purchased from Tocris. AVP was purchased from GenScript. cDNAs for α1A-AR isoform 2 (Homo sapiens) and α2-AR (Sus scrofa) were the kind gifts of R. R. Neubig. cDNAs for human β2-AR, β3-AR, and long splice variant of Gαs were purchased from Open Biosystems. Human cDNAs for D1R and V1AR were acquired from DNASU Plasmid Repository. CB1 (Mus musculus) was acquired from Transomic Technologies. Cell Buffer is HEPES-buffered saline supplemented with 0.2% dextrose (w/v), 1.5 μg ml−1 aprotinin, and 1.5 μg ml−1 leupeptin at pH 7.5. Drug Buffer for isoproterenol and dopamine is HEPES-buffered saline supplemented with 1 mm ascorbic acid. Drug Buffer for epinephrine and phenylephrine is HEPES-buffered saline. Drug Buffer for 2-AG is HEPES-buffered saline supplemented with 1% DMSO. Drug Buffer for AVP is double distilled H2O.
Molecular Cloning
All receptors were cloned into PCDNA5/FRT vectors and expressed as single polypeptides. From N to C terminus, polypeptide consists of full-length GPCR, mCitrine (FRET acceptor), ER/K linker, mCerulean (FRET donor), and a Gα C-terminal peptide (s peptide, i peptide, or q peptide.) cAMP assay was performed with sensor expressing the full-length Gαs subunit. The following amino acid sequences were used for Gα C-terminal peptides: s peptide, DTENRRVFNDCRDIIQRMHLRQYELL; i peptide, DTKNVQFVFDAVTDVIIKNNLKDCGLF; and q peptide, DTENIRFVFAAVKDTILQLNLKEYNLV. Control GPCR sensors (no peptide) contain a repeating Gly-Ser-Gly residue series after mCerulean. GPCRs were cloned between NheI and KpnI restriction sites in the PCDNA5/FRT vector, with the exception of α2-AR, which was cloned between HindIII and KpnI. Peptide point mutations for q peptide and s peptide were generated via PCR using oligonucleotide-directed mutagenesis (QuikChange site-directed mutagenesis kit, Stratagene). All constructs were confirmed by sequencing.
Cell Culture and Sensor Expression
HEK293T-Flp-in (Invitrogen) cells were cultured in DMEM supplemented with 10% FBS (v/v), 4.5 g/liter d-glucose, 1% Glutamax, 20 mm HEPES, pH 7.5, at 37 °C in humidified atmosphere at 5% CO2. Cells were used for passages 3–27 and were plated into tissue culture-treated six-well dishes at 30% confluence and allowed to adhere for 16–20 h. Cells were transiently transfected using X-tremeGENE HP DNA transfection reagent (Roche Applied Science). Conditions for DNA (1.4–4 μg), reagent (4.2–6 μl), and length of transfection (18–36 h) were optimized to achieve consistent membrane expression levels for all constructs. Expression levels were monitored on a Nikon tissue culture microscope with fluorescence detection. Consistent expression was achieved by quantifying percent of cells with fluorescent expression (>70%) with primary expression at the plasma membrane. Experiments were conducted at equivalent sensor expression, and cells were resuspended by gently pipetting into their original media. Cells were spun down (300 × g, 3 min) and washed twice, resuspended in Cell Buffer, and brought to the same optical density (cyan fluorescent protein/OD of 1.5–3.0) across experiments.
Steady-state FRET Measurements
Sensor integrity was monitored by measuring mCitrine/mCerulean fluorescence ratios (1.8–2.1). All ΔFRET experiments were conducted at 37 °C (buffers, cuvettes, and fluorometer). Once resuspended to optical density listed above, cells were aliquoted into 90 μl samples kept at 37 °C. 10 μl of Drug Buffer was added to five control samples and 10 μl of the respective agonist in Drug Buffer was added to five separate samples serially in 1-min intervals. After 5 min of incubation at 37 °C with drug, cells were collected for fluorescence reading by exciting the cells at 430 nm (bandpass 8 nm) in a 3-mm optical quartz cuvette (3–3.30-SOG-3, Starna Cells Inc.) and monitoring emission from 450 to 600 nm (bandpass 4 nm) on a FluoroMax-4 fluorometer (Horiba Scientific). Cells were used within 20 min of harvesting.
cAMP Assay
30–32 h post-transfection, HEK293T cells expressing V1AR tethered to wild-type or mutant Gαs subunit were harvested to evaluate cAMP levels using the bioluminescent cAMP Glo assay (Promega). Briefly, cells were gently suspended in their original media, counted using a hemocytometer, and spun down (300 × g, 3 min). Appropriate volume of buffer (PBS supplemented with 800 μm ascorbic acid and 0.2% dextrose (w/v)) was added to reach 2 × 10⁶ cells ml−1 density. Cell suspensions were aliquoted into 96-well round-bottom opaque plates. Cells were treated with or without AVP (100 nm) in the presence of 0.25 mm isobutylmethylxanthine for 15 min at 37 °C. Subsequently, cells were lysed, and the protocol was followed according to the manufacturer's recommendation (Promega). Luminescence was measured using a microplate luminometer reader (SpectraMax M5e, Molecular Devices). cAMP levels (relative luminescence unit) were evaluated by subtracting the untreated background from the transfected conditions. Each experiment had four repeats per condition and was repeated at least three times (n > 3).
Live Cell FRET Data and Statistical Analysis
FRET ratio is calculated by dividing normalized mCitrine emission (525 nm) by normalized mCerulean emission (475 nm). Spectra are normalized to 1.0 at 475 nm. All FRET readings were analyzed using MatLab (R2014a, MathWorks, Inc.), and averages were calculated for plus and minus drug conditions. The cyan fluorescent protein/OD ratios were used to compare various peptide sensors of similar expression conditions. ΔFRET was calculated by the following: the average FRET ratio of the minus condition was subtracted from the FRET ratio of each drug condition sample; these values were then averaged for ΔFRET. Results are expressed as mean values ± S.E. of the mean of at least three independent experiments with at least three repeats per condition per experiment. Statistical analysis was performed with GraphPad Prism (version 6, GraphPad Software, Inc.). Statistical significance for ΔFRET for six different receptor-peptide combinations was evaluated by ANOVA and Tukey's multiple comparison test. Values from Tukey's test are reported in figures with corresponding significance values of non-significant (n.s.), p > 0.05; *, p ≤ 0.05; **, p ≤ 0.01; ***, p ≤ 0.001;****, p ≤ 0.0001. ANOVA was used to test the significance for the four-peptide set of each receptor, and Tukey's multiple comparison test was used to calculate statistical significance comparing mean of cognate peptide sample to the control no-peptide or other non-cognate peptides (Fig. 1, b–d). Student's unpaired t test was used to compare mutant peptide to WT peptide samples (Figs. 4 and 5c).
Computational Modeling of the Structural Model of the GPCR Bound to Agonist and C-terminal Peptides
Isoproterenol-bound β2-AR·Gα C-terminal peptide complexes were modeled starting from the co-crystal structure of the active state of β2-AR bound to Gαs protein (PDB code 3SN6 (10)). Residues missing from the extracellular loop 2 in the crystal structure (amino acid residues 176–178) were inserted using the corresponding conformation from the nanobody-stabilized crystal structure of β2-AR (PDB code 3P0G (36)). We aligned to the 3P0G structure to the 3SN6 structure of β2-AR (37) and transferred the coordinates of the missing residues from the 3P0G structure. The ICL3 region (amino acid residues 240–264) was not present in either crystal structure, and it was not modeled in our β2-AR structure. Next, we modeled the full agonist isoproterenol binding to β2-AR by transferring the conformation of isoproterenol from the crystal structure of β1-AR (PDB code 2Y03 (38)) into the conserved ligand binding pocket of the β2-AR. This required using structural alignment of the modeled β2-AR to the β1-AR 2Y03 structure in PyMOL and extraction of the aligned ligand coordinates to the modeled β2-AR (Schrödinger LLC 2010, PyMOL Molecular Graphics System, Version 1.3r1). The next step was to generate a starting conformation for the binding of the C-terminal peptides of the Gα subunit into the agonist-bound GPCR structural model. The starting orientation of the Gαs, Gαi, and Gαq C-terminal peptides were generated from the Gs-bound β2-AR crystal structure (3SN6). The 27 terminal amino acids of Gαs were used as the starting structure for the s peptide. The s peptide was used as a template to mutate the respective sequences in the case of q and i peptides. We superimposed the s, i, and q peptides onto the Gαs C terminus and extracted their coordinates after alignment to the receptor's intracellular interface. For modeling of mutant peptides, single and double point mutations were made to the aligned s and q peptides using Maestro's fragment builder application (release 2015–3: Maestro, version 10.3 2015, Schrödinger, LLC). The orientations of the s, i, q, and mutant peptides were further optimized using MD simulations as described below.
As there is no crystal structure of the vasopressin receptor V1AR, we used a homology modeling technique to generate a structural model for the Gq-coupled V1AR. The homology model of the vasopressin receptor V1AR was generated with the MODELLER software suite (37), using the active state structure of μ-opioid receptor (PDB code 5C1M (32)) as the template. We used the active state structure, because that is relevant to generate the q peptide-bound state. The μ-opioid receptor scored highest in sequence similarity to V1AR when we performed a BLAST search for sequences of GPCRs in active state in the Protein Data Bank (39). The ICL3 is absent in the μ-opioid receptor template structure and is omitted from the V1AR model as well (amino acids 246–279). We docked the 9-amino acid-long endogenous agonist AVP with amidated C terminus, using Glide SP flexible ligand docking suite (Suite 2012: Glide. 2012, Schrödinger, LLC) with the site-directed mutation results used as guiding constraints while docking (40–45). Mutated residues that affected ligand binding were used to establish distance constraints for docking of the ligand. AVP structure was obtained from the crystal structure of AVP complexed with trypsin (PDB code 1YF4 (46)). Residues 1–6 of AVP form a cyclic ring, with three terminal residues remaining in a flexible loop. To generate multiple peptide conformations for docking, the cyclic region of the peptide was kept constrained, with only the loop region allowed to sample using MacroModel Conformational Search (release 2014–3: MacroModel, 2014, Schrödinger, LLC). Because of the large structure of the peptide, the van der Waals radii of the atoms both in the AVP ligand and V1AR receptor were scaled to 30% of normal values to accommodate the ligand. Docking was performed using ligand flexible docking of 20 non-redundant conformations generated by Macromodel. We optimized the side chain conformations for the residues within 5 Å of AVP-docked poses using Prime (release 2014–3: Prime. 2014, Schrödinger, LLC). Subsequently, we chose the Prime optimized pose that showed the most favorable interaction energy to begin molecular dynamics. Finally, using the same procedure as β2-AR, we generated AVP·V1AR complexes with the s, i, q, and mutant peptides by superimposing the AVP·V1AR complex and the C-terminal peptides onto β2-AR·Gαs C terminus from the 3SN6 structure. This allowed us to model the initial orientation of the AVP·V1AR·peptide complex using the coordinates of the β2-AR and C terminus of Gαs complex.
Before beginning the all-atom MD simulations, each unique GPCR·Gα C-terminal peptide complex structure (β2-AR with s, i, q, and single and double point mutant peptides; V1AR with s, i, q, and single mutant peptides) was minimized using conjugate gradient minimization method in the Maestro software suite (2015–3: Maestro, version 10.3, 2015, Schrödinger, LLC) to remove steric clashes of amino acids in initial conformations of receptor·peptide complexes.
Details of the Molecular Dynamics Simulations
We used all-atom MD simulations to optimize the conformations of the agonist·GPCR·Gα C-terminal peptide complexes. GPCR·peptide complexes were embedded into lipid membrane and equilibrated to 310 K temperature and 1 atm pressure with the GROMACS 5.1.0 software suite (47), following the protocol described below. GPCR·peptide complexes were inserted into an equilibrated box of 128 molecules of 1-palmitoyl-2-oleoyl-sn-glycero-3-phosphocholine) phospholipid bilayer (48). GPCR·agonist·peptide complexes were concatenated to the lipid membrane structure, and the lipids were expanded and re-fitted around the protein complex using the common INFLATEGRO perl script functions (49). Water (SPC/E model (50)) and charge-balancing counter-ions (Na+ and Cl−) were added to the simulation system. Simulations were run with an adapted gromos53a6 force field to account for lipid parameters. Membrane-embedded GPCR·peptide complexes were minimized in GROMACS using steepest descent minimization until maximum force was below 1000 kJ/mol/nm. During equilibration steps, protein backbone atoms of the GPCR and C-terminal peptides were restrained to their initial positions with 100 kJ/mol position restraints to allow optimal protein side-chain packing at protein/water and protein/membrane interfaces. Simulation systems were equilibrated first with a 500-ps isothermal-isochoric ensemble with Nose-Hoover thermostat (51) to bring system temperature to 310 K, followed by a 20-ns simulation under isothermal-isobaric ensemble with Parinello-Rahman barostat (52) to equilibrate pressure to ∼1.05 bar. Equilibrated systems were then simulated for 5-ns windows with stepwise reduction of protein backbone position restraints to 80, 60, 40, 20, 10, and then 5 kJ/mol, followed by 20 ns of simulation with no position restraints. Production simulations for each GPCR·peptide complex were conducted in replicates of five with no restraints. One replicate continued from velocities generated during equilibration, and four other replicates were initiated with random velocities. The five replicates were simulated for 200 ns each, for a collective 1 μs of conformational sampling for each agonist·GPCR·peptide complex.
Computational Data Analysis
To avoid large fluctuations in the calculated potential energies, the last 20-ns window from each of the five replicate simulations per system was used to generate a 100-ns ensemble of conformations for data analysis. The r.m.s.d.-based (root mean squared deviation in coordinates) clustering was used to determine the average conformations sampled within the 100-ns window of simulations. Clusters were populated by counting the number of structures within an r.m.s.d. cutoff to each structure within the ensemble. The structure with the greatest number of neighboring structures and all of its neighbors were removed from the ensemble of structures as one cluster, and the procedure was repeated on the remaining structures (53). To obtain clusters of conformations that allow mixing of structures from different replicates, we used a distance cutoff of 3 Å for the r.m.s.d. clustering.
All the snapshots in the most populated cluster were used to determine intermolecular contacts and to calculate the binding energy between V1AR and s, i, and q peptides. The total terminal 100-ns ensemble was used for analysis of β2-AR intermolecular contacts and binding energies. In each case, the entire ensemble mentioned was averaged to measure the close residue contacts and calculate the binding energy. Residue contacts were obtained using Tcl scripts developed in-house with visual molecular dynamics (54). The interaction energies of the s, i, and q peptides were calculated as the non-bond energies (Coulomb and van der Waals) of the peptides' interactions with the receptor.
To measure the conformational flexibility in the intracellular region where the s, i, and q peptides insert into the receptor, we measured the distance between the intracellular region of TM3 and TM6. The TM3 to TM6 measurement was calculated as the distance between Cα atoms of the residues Arg-3.50 (R1313.50) and Glu-6.30 (E2686.30) for β2-AR and Arg-3.50 (R1493.50) and Lys-6.30 (K2866.30) for V1AR. Statistical significance for the TM3–TM6 distance distribution for different receptor-peptide combinations was evaluated by two-sample Kolmogorov-Smirnov test using MatLab (R2013a, Mathworks, Inc.). Test results indicate the significance of dissimilarity between distribution pairs, with significance values denoted by ****, p ≤ 0.0001. To visually compare the overall peptide orientations within the GPCR interface, the structural ensembles were arranged by increasing TM3–TM6 distance, and structures from the median of the distribution were used to compare depth and orientation of peptide binding.
RMSF Calculations for the Whole Receptor Complex
To assess the flexibility of the entire GPCR structure when bound to agonist and the s, i, and q peptides, we calculated the RMSF for each residue in β2-AR and V1AR averaged over the entire trajectory. We calculated RMSF in Gromacs, using the trajectory of the total 100 ns ensemble of β2-AR and V1AR with each s, i, and q peptide. A least squares fit was performed over the entire trajectory to identify the average structure of the ensemble. The fluctuation of each residue throughout the trajectory was compared with its position in the average structure. The average RMSF for each residue was calculated by squaring the difference between the residue's position in each frame to the average structure, summing this difference for every frame in the trajectory, and calculating the square root of this sum.
Author Contributions
A. S., M. S., N. V., and S. S. planned and designed the experiments. A. S., M. S., and R. U. M. performed the experiments. A. S. and M. S. analyzed the results. A. S., M. S., N. V., and S. S. wrote the manuscript.
Supplementary Material
Acknowledgments
M. S. and N. V. thank Dr. Supriyo Bhattacharya and Dr. Hubert Li for helpful discussions and suggestions on the analysis of the molecular dynamics trajectories.
This work was supported by American Heart Association Scientist Development Grant 13SDG14270009 and National Institutes of Health Grants 1DP2 CA186752-01 and 1-R01-GM-105646-01-A1 (to S. S.) and R01 GM097261-04 (to N. V.). The authors declare that they have no conflicts of interest with the contents of this article. The content is solely the responsibility of the authors and does not necessarily represent the official views of the National Institutes of Health.

This article contains supplemental Fig. S1 and Tables S1–S4.
- GPCR
- G protein-coupled receptor
- V1AR
- V1A receptor
- β2-AR
- β2 adrenergic receptor
- MD
- molecular dynamics
- PDB
- Protein Data Bank
- ANOVA
- analysis of variance
- AVP
- [Arg8]vasopressin
- r.m.s.d.
- root mean square deviation
- RMSF
- root mean square fluctuation
- D1R
- dopamine receptor D1
- CB1
- cannabinoid receptor type 1
- TM
- transmembrane
- 2-AG
- 2-arachidonylglycerol
- ICL
- intracellular loop.
References
- 1. Bhattacharya S., Hall S. E., Li H., and Vaidehi N. (2008) Ligand-stabilized conformational states of human β(2) adrenergic receptor: insight into G-protein-coupled receptor activation. Biophys. J. 94, 2027–2042 [DOI] [PMC free article] [PubMed] [Google Scholar]
- 2. Granier S., and Kobilka B. (2012) A new era of GPCR structural and chemical biology. Nat. Chem. Biol. 8, 670–673 [DOI] [PMC free article] [PubMed] [Google Scholar]
- 3. Kahsai A. W., Xiao K., Rajagopal S., Ahn S., Shukla A. K., Sun J., Oas T. G., and Lefkowitz R. J. (2011) Multiple ligand-specific conformations of the β2-adrenergic receptor. Nat. Chem. Biol. 7, 692–700 [DOI] [PMC free article] [PubMed] [Google Scholar]
- 4. Kobilka B., and Schertler G. F. (2008) New G-protein-coupled receptor crystal structures: insights and limitations. Trends Pharmacol. Sci. 29, 79–83 [DOI] [PubMed] [Google Scholar]
- 5. Liu J. J., Horst R., Katritch V., Stevens R. C., and Wüthrich K. (2012) Biased signaling pathways in β2-adrenergic receptor characterized by 19F-NMR. Science 335, 1106–1110 [DOI] [PMC free article] [PubMed] [Google Scholar]
- 6. Niesen M. J., Bhattacharya S., and Vaidehi N. (2011) The role of conformational ensembles in ligand recognition in G-protein coupled receptors. J. Am. Chem. Soc. 133, 13197–13204 [DOI] [PubMed] [Google Scholar]
- 7. Vilardaga J. P., Steinmeyer R., Harms G. S., and Lohse M. J. (2005) Molecular basis of inverse agonism in a G protein-coupled receptor. Nat. Chem. Biol. 1, 25–28 [DOI] [PubMed] [Google Scholar]
- 8. Yao X. J., Vélez Ruiz G., Whorton M. R., Rasmussen S. G., DeVree B. T., Deupi X., Sunahara R. K., and Kobilka B. (2009) The effect of ligand efficacy on the formation and stability of a GPCR-G protein complex. Proc. Natl. Acad. Sci. U.S.A. 106, 9501–9506 [DOI] [PMC free article] [PubMed] [Google Scholar]
- 9. Hermans E. (2009) Multiplicity and regulation of G-protein couplings. Bull. Mem. Acad. R. Med. Belg. 164, 255–262 [PubMed] [Google Scholar]
- 10. Rasmussen S. G., DeVree B. T., Zou Y., Kruse A. C., Chung K. Y., Kobilka T. S., Thian F. S., Chae P. S., Pardon E., Calinski D., Mathiesen J. M., Shah S. T., Lyons J. A., Caffrey M., Gellman S. H., et al. (2011) Crystal structure of the β2 adrenergic receptor-Gs protein complex. Nature 477, 549–555 [DOI] [PMC free article] [PubMed] [Google Scholar]
- 11. Chung K. Y., Rasmussen S. G., Liu T., Li S., DeVree B. T., Chae P. S., Calinski D., Kobilka B. K., Woods V. L. Jr., and Sunahara R. K. (2011) Conformational changes in the G protein Gs induced by the β2 adrenergic receptor. Nature 477, 611–615 [DOI] [PMC free article] [PubMed] [Google Scholar]
- 12. Conklin B. R., and Bourne H. R. (1993) Structural elements of G α subunits that interact with Gβγ, receptors, and effectors. Cell 73, 631–641 [DOI] [PubMed] [Google Scholar]
- 13. Conklin B. R., Farfel Z., Lustig K. D., Julius D., and Bourne H. R. (1993) Substitution of three amino acids switches receptor specificity of Gqα to that of Giα. Nature 363, 274–276 [DOI] [PubMed] [Google Scholar]
- 14. Conklin B. R., Herzmark P., Ishida S., Voyno-Yasenetskaya T. A., Sun Y., Farfel Z., and Bourne H. R. (1996) Carboxyl-terminal mutations of Gq α and Gs α that alter the fidelity of receptor activation. Mol. Pharmacol. 50, 885–890 [PubMed] [Google Scholar]
- 15. Hamm H. E., Deretic D., Arendt A., Hargrave P. A., Koenig B., and Hofmann K. P. (1988) Site of G protein binding to rhodopsin mapped with synthetic peptides from the α subunit. Science 241, 832–835 [DOI] [PubMed] [Google Scholar]
- 16. Hamm H. E., and Rarick H. M. (1994) Specific peptide probes for G-protein interactions with receptors. Methods Enzymol. 237, 423–436 [DOI] [PubMed] [Google Scholar]
- 17. Kostenis E., Degtyarev M. Y., Conklin B. R., and Wess J. (1997) The N-terminal extension of Gαq is critical for constraining the selectivity of receptor coupling. J. Biol. Chem. 272, 19107–19110 [DOI] [PubMed] [Google Scholar]
- 18. Lambright D. G., Noel J. P., Hamm H. E., and Sigler P. B. (1994) Structural determinants for activation of the α-subunit of a heterotrimeric G protein. Nature 369, 621–628 [DOI] [PubMed] [Google Scholar]
- 19. Lambright D. G., Sondek J., Bohm A., Skiba N. P., Hamm H. E., and Sigler P. B. (1996) The 2.0 A crystal structure of a heterotrimeric G protein. Nature 379, 311–319 [DOI] [PubMed] [Google Scholar]
- 20. Liu J., Conklin B. R., Blin N., Yun J., and Wess J. (1995) Identification of a receptor/G-protein contact site critical for signaling specificity and G-protein activation. Proc. Natl. Acad. Sci. U.S.A. 92, 11642–11646 [DOI] [PMC free article] [PubMed] [Google Scholar]
- 21. Oldham W. M., and Hamm H. E. (2006) Structural basis of function in heterotrimeric G proteins. Q. Rev. Biophys. 39, 117–166 [DOI] [PubMed] [Google Scholar]
- 22. Rasenick M. M., Watanabe M., Lazarevic M. B., Hatta S., and Hamm H. E. (1994) Synthetic peptides as probes for G protein function. Carboxyl-terminal G α s peptides mimic Gs and evoke high affinity agonist binding to β-adrenergic receptors. J. Biol. Chem. 269, 21519–21525 [PubMed] [Google Scholar]
- 23. Skiba N. P., Yang C. S., Huang T., Bae H., and Hamm H. E. (1999) The α-helical domain of Gαt determines specific interaction with regulator of G protein signaling 9. J. Biol. Chem. 274, 8770–8778 [DOI] [PubMed] [Google Scholar]
- 24. Slessareva J. E., Ma H., Depree K. M., Flood L. A., Bae H., Cabrera-Vera T. M., Hamm H. E., and Graber S. G. (2003) Closely related G-protein-coupled receptors use multiple and distinct domains on G-protein α-subunits for selective coupling. J. Biol. Chem. 278, 50530–50536 [DOI] [PubMed] [Google Scholar]
- 25. Van Eps N., Oldham W. M., Hamm H. E., and Hubbell W. L. (2006) Structural and dynamical changes in an α-subunit of a heterotrimeric G protein along the activation pathway. Proc. Natl. Acad. Sci. U.S.A. 103, 16194–16199 [DOI] [PMC free article] [PubMed] [Google Scholar]
- 26. Van Eps N., Preininger A. M., Alexander N., Kaya A. I., Meier S., Meiler J., Hamm H. E., and Hubbell W. L. (2011) Interaction of a G protein with an activated receptor opens the interdomain interface in the α subunit. Proc. Natl. Acad. Sci. U.S.A. 108, 9420–9424 [DOI] [PMC free article] [PubMed] [Google Scholar]
- 27. Westfield G. H., Rasmussen S. G., Su M., Dutta S., DeVree B. T., Chung K. Y., Calinski D., Velez-Ruiz G., Oleskie A. N., Pardon E., Chae P. S., Liu T., Li S., Woods V. L. Jr., Steyaert J., et al. (2011) Structural flexibility of the Gαs α-helical domain in the β2-adrenoceptor Gs complex. Proc. Natl. Acad. Sci. U.S.A. 108, 16086–16091 [DOI] [PMC free article] [PubMed] [Google Scholar]
- 28. Yang C. S., Skiba N. P., Mazzoni M. R., and Hamm H. E. (1999) Conformational changes at the carboxyl terminus of Gα occur during G protein activation. J. Biol. Chem. 274, 2379–2385 [DOI] [PubMed] [Google Scholar]
- 29. Oldham W. M., and Hamm H. E. (2008) Heterotrimeric G protein activation by G-protein-coupled receptors. Nat. Rev. Mol. Cell Biol. 9, 60–71 [DOI] [PubMed] [Google Scholar]
- 30. Malik R. U., Ritt M., DeVree B. T., Neubig R. R., Sunahara R. K., and Sivaramakrishnan S. (2013) Detection of G protein-selective G protein-coupled receptor (GPCR) conformations in live cells. J. Biol. Chem. 288, 17167–17178 [DOI] [PMC free article] [PubMed] [Google Scholar]
- 31. Sivaramakrishnan S., and Spudich J. A. (2011) Systematic control of protein interaction using a modular ER/K α-helix linker. Proc. Natl. Acad. Sci. U.S.A. 108, 20467–20472 [DOI] [PMC free article] [PubMed] [Google Scholar]
- 32. Huang W., Manglik A., Venkatakrishnan A. J., Laeremans T., Feinberg E. N., Sanborn A. L., Kato H. E., Livingston K. E., Thorsen T. S., Kling R. C., Granier S., Gmeiner P., Husbands S. M., Traynor J. R., Weis W. I., et al. (2015) Structural insights into micro-opioid receptor activation. Nature 524, 315–321 [DOI] [PMC free article] [PubMed] [Google Scholar]
- 33. Kobilka B. K. (2007) G protein coupled receptor structure and activation. Biochim. Biophys. Acta 1768, 794–807 [DOI] [PMC free article] [PubMed] [Google Scholar]
- 34. Nygaard R., Zou Y., Dror R. O., Mildorf T. J., Arlow D. H., Manglik A., Pan A. C., Liu C. W., Fung J. J., Bokoch M. P., Thian F. S., Kobilka T. S., Shaw D. E., Mueller L., Prosser R. S., and Kobilka B. K. (2013) The dynamic process of β(2)-adrenergic receptor activation. Cell 152, 532–542 [DOI] [PMC free article] [PubMed] [Google Scholar]
- 35. Palczewski K., Kumasaka T., Hori T., Behnke C. A., Motoshima H., Fox B. A., Le Trong I., Teller D. C., Okada T., Stenkamp R. E., Yamamoto M., and Miyano M. (2000) Crystal structure of rhodopsin: A G protein-coupled receptor. Science 289, 739–745 [DOI] [PubMed] [Google Scholar]
- 36. Rasmussen S. G., Choi H. J., Fung J. J., Pardon E., Casarosa P., Chae P. S., Devree B. T., Rosenbaum D. M., Thian F. S., Kobilka T. S., Schnapp A., Konetzki I., Sunahara R. K., Gellman S. H., Pautsch A., et al. (2011) Structure of a nanobody-stabilized active state of the β(2) adrenoceptor. Nature 469, 175–180 [DOI] [PMC free article] [PubMed] [Google Scholar]
- 37. Webb B., and Sali A. (2014) Comparative protein structure modeling using MODELLER. Curr. Protoc. Bioinformatics 47, 5.6.1–5.6.32 [DOI] [PubMed] [Google Scholar]
- 38. Warne T., Moukhametzianov R., Baker J. G., Nehmé R., Edwards P. C., Leslie A. G., Schertler G. F., and Tate C. G. (2011) The structural basis for agonist and partial agonist action on a β(1)-adrenergic receptor. Nature 469, 241–244 [DOI] [PMC free article] [PubMed] [Google Scholar]
- 39. Berman H. M., Westbrook J., Feng Z., Gilliland G., Bhat T. N., Weissig H., Shindyalov I. N., and Bourne P. E. (2000) The Protein Data Bank. Nucleic Acids Res. 28, 235–242 [DOI] [PMC free article] [PubMed] [Google Scholar]
- 40. Rodrigo J., Pena A., Murat B., Trueba M., Durroux T., Guillon G., and Rognan D. (2007) Mapping the binding site of arginine vasopressin to V1a and V1b vasopressin receptors. Mol. Endocrinol. 21, 512–523 [DOI] [PubMed] [Google Scholar]
- 41. Mouillac B., Chini B., Balestre M. N., Elands J., Trumpp-Kallmeyer S., Hoflack J., Hibert M., Jard S., and Barberis C. (1995) The binding site of neuropeptide vasopressin V1a receptor. Evidence for a major localization within transmembrane regions. J. Biol. Chem. 270, 25771–25777 [DOI] [PubMed] [Google Scholar]
- 42. Lubecka E. A., Sikorska E., Sobolewski D., Prahl A., Slaninová J., and Ciarkowski J. (2015) Arginine-, d-arginine-vasopressin, and their inverso analogues in micellar and liposomic models of cell membrane: CD, NMR, and molecular dynamics studies. Eur. Biophys. J. 44, 727–743 [DOI] [PMC free article] [PubMed] [Google Scholar]
- 43. Cotte N., Balestre M. N., Aumelas A., Mahé E., Phalipou S., Morin D., Hibert M., Manning M., Durroux T., Barberis C., and Mouillac B. (2000) Conserved aromatic residues in the transmembrane region VI of the V1a vasopressin receptor differentiate agonist vs. antagonist ligand binding. Eur. J. Biochem. 267, 4253–4263 [DOI] [PubMed] [Google Scholar]
- 44. Chini B., Mouillac B., Ala Y., Balestre M. N., Trumpp-Kallmeyer S., Hoflack J., Elands J., Hibert M., Manning M., and Jard S. (1995) Tyr115 is the key residue for determining agonist selectivity in the V1a vasopressin receptor. EMBO J. 14, 2176–2182 [DOI] [PMC free article] [PubMed] [Google Scholar]
- 45. Cheng L. L., Stoev S., Manning M., Derick S., Pena A., Mimoun M. B., and Guillon G. (2004) Design of potent and selective agonists for the human vasopressin V1b receptor based on modifications of [deamino-cys1]arginine vasopressin at position 4. J. Med. Chem. 47, 2375–2388 [DOI] [PubMed] [Google Scholar]
- 46. Syed Ibrahim B., and Pattabhi V. (2005) Trypsin inhibition by a peptide hormone: crystal structure of trypsin-vasopressin complex. J. Mol. Biol. 348, 1191–1198 [DOI] [PubMed] [Google Scholar]
- 47. Abraham M. J., Murtola T., Schulz R., Pall S., Smith J. C., Hess B., and Lindahl E. (2015) GROMACS: high performance molecular simulations through multi-level parallelism from laptops to supercomputers. SoftwareX 1–2, 19–25 [Google Scholar]
- 48. Sapay N., Bennett W. F. D., and Tieleman D. P. (2009) Thermodynamics of flip-flop and desorption for a systematic series of phosphatidylcholine lipids. Soft Matter 5, 3295–3302 [Google Scholar]
- 49. Kandt C., Ash W. L., and Tieleman D. P. (2007) Setting up and running molecular dynamics simulations of membrane proteins. Methods 41, 475–488 [DOI] [PubMed] [Google Scholar]
- 50. Berendsen H. J. C., Grigera J. R., and Straatsma T. P. (1987) The missing term in effective pair potentials. J. Phys. Chem. 91, 6269–6271 [Google Scholar]
- 51. Evans D. J., and Holian B. L. (1985) The Nose-Hoover thermostat. J. Chem. Phys. 83, 4069–4074 [Google Scholar]
- 52. Parrinello M., and Rahman A. (1981) Polymorphic transitions in single crystals: a new molecular dynamics method. J. Appl. Phys. 52, 7182–7190 [Google Scholar]
- 53. Daura X., Gademann K., Jaun B., Seebach D., van Gunsteren W. F., and Mark A. E. (1999) Peptide folding: when simulation meets experiment. Angew. Chem. Int. Ed. 38, 236–240 [Google Scholar]
- 54. Humphrey W., Dalke A., and Schulten K. (1996) VMD: visual molecular dynamics. J. Mol. Graph. 14, 33–38 [DOI] [PubMed] [Google Scholar]
Associated Data
This section collects any data citations, data availability statements, or supplementary materials included in this article.