Figure 1.
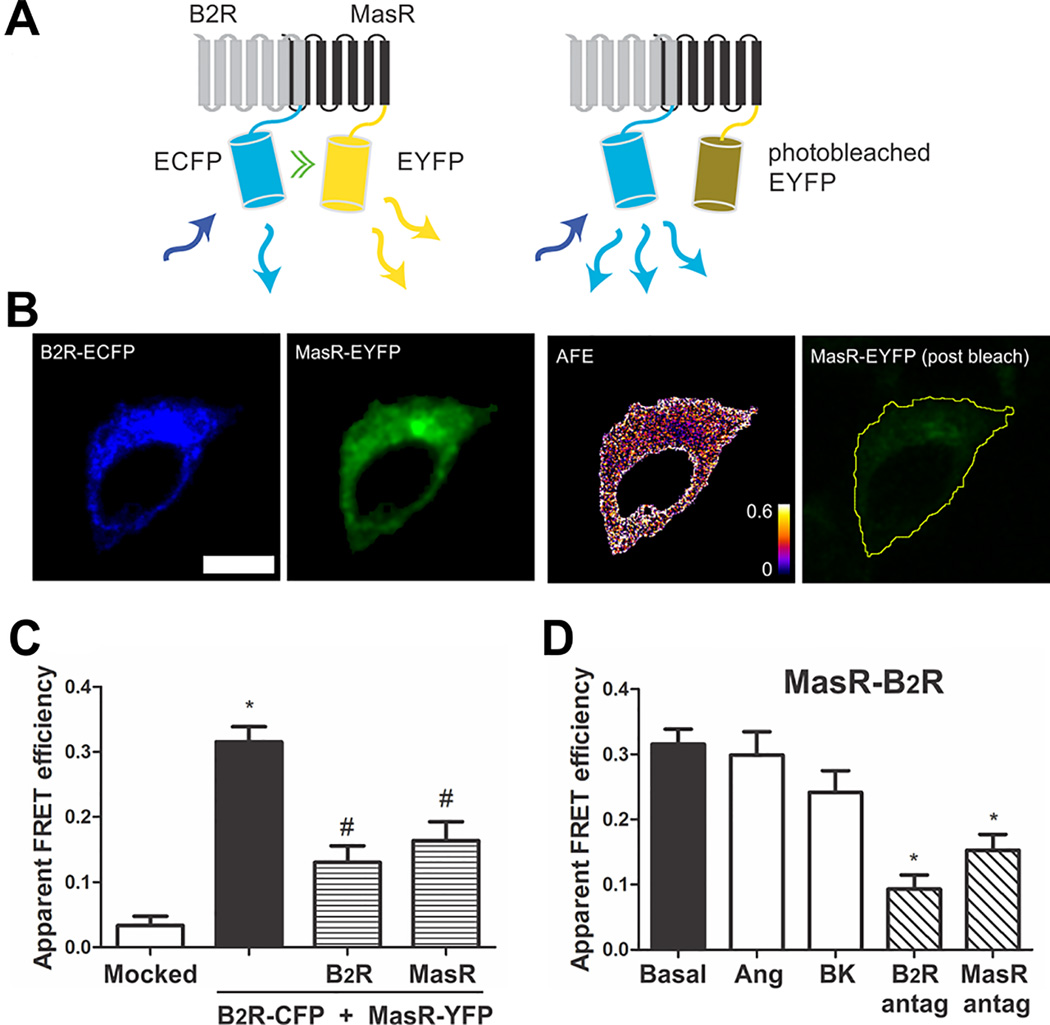
B2R interacts with MasR. (A) Schematic representation of FRET. B2R fused to ECFP (FRET donor) and MasR fused to EYFP (FRET acceptor) are coexpressed in the same cell. Upon excitation of the donor molecule (blue arrow) not only the donor emits the energy (light blue arrow), but also part of the energy is transferred to the acceptor (green double arrow) which also emits (yellow arrows) (left panel). Photodestruction of the acceptor molecule abolishes energy transfer which is evidenced by an increase in the donor emission (light blue arrows) (right panel). (B) Representative images of the FRET measurements (scale bar: 10 µm): B2R-CFP (FRET donor) and MasR-YFP (FRET acceptor) before acceptor photobleaching, apparent FRET efficiency (AFE) and resulting acceptor image after photobleaching. The AFE values can be between 0 and 1 and are proportional to the fraction of interacting B2R molecules. (C) Apparent FRET efficiency of cells transfected with the empty vector (mocked) or the vectors containing the DNA coding for B2R-CFP + MasR-YFP (black bar), B2R-CFP + MasR-YFP + untagged B2R (patterned bar) or B2R-CFP + MasR-YFP + untagged MasR (patterned bar). * P < 0.05 vs. mocked; # P < 0.05 vs. B2R-CFP + MasR-YFP. (D) Influence of ligands on B2R-MasR heteromer formation. Prior to FRET measurements, HEK293T cells transiently co-expressing B2R-CFP + MasR-YFP were incubated without (basal) or with 1 µmol/L BK or Ang-(1–7) or the B2 receptor antagonist Hoe or the Mas receptor antagonist A779 15 min at 37°C. * P < 0.05 vs. basal. Values are expressed as the mean±SEM from four independent experiments. 25 cells were analyzed per experiment.

