

ABSTRACT
The O6‐alkylguanine DNA alkyltransferase (AGT) is a DNA repair enzyme that binds DNA with moderate cooperativity. This cooperativity is important for its search for alkylated bases. A structural model of the cooperative complex of AGT with DNA predicts short‐range interactions between nearest protein neighbors and long‐range interactions between proteins separated in the array. DNA substrates ranging from 11bp to 30bp allowed us to use differences in binding stoichiometry to resolve short‐ and long‐range protein contributions to the stability of AGT complexes. We found that the short‐range component of ΔG°coop was nearly independent of DNA length and protein packing density. In contrast the long‐range component oscillated with DNA length, with a period equal to the occluded binding site size (4bp). The amplitude of the long‐range component decayed from ∼−4 kcal/mole of interaction to ∼−1.2 kcal/mol of interaction as the size of cooperative unit increased from 4 to 7 proteins, suggesting a mechanism to limit the size of cooperative clusters. These features allow us to make testable predictions about AGT distributions and interactions with chromatin structures in vivo. © 2015 The Authors Biopolymers Published by Wiley Periodicals, Inc. Biopolymers 103: 509–516, 2015.
Keywords: DNA repair, O6‐alkylguanine, binding cooperativity, protein–DNA interaction
INTRODUCTION
Many proteins bind DNA cooperatively and with low sequence specificity. Important examples may be found among the transcription‐regulatory proteins (E. coli CAP protein,1, 2 human glucocorticoid receptor,3 NFkB,4 X. laevis TFIIIA5); eukaryotic chromosome‐structuring proteins6; bacterial nucleoid‐structuring proteins7, 8; eu‐and prokaryotic DNA‐repair proteins9, 10 and the superfamily of single‐strand binding proteins.11, 12 The importance of cooperative interactions was recognized early13, 14 and this recognition has sustained a continuing development of theory to account for the observable features of cooperative protein‐ and drug‐DNA assemblies.15, 16, 17, 18, 19, 20, 21, 22
Perhaps, the most widely‐used approach to the analysis of cooperativity is that of McGhee and von Hippel16 and its later developments [c.f.,19,12]. Of special value is the variant of the McGhee and von Hippel model that takes into account the finite length of the DNA lattice.16, 21 This variant is embodied in Eq. (1)
| (1) |
Here, ν is the binding density (protein molecules/nucleotide), K is the equilibrium association constant for binding a single site, ω is the cooperativity parameter, N is the length of the DNA in base pairs and s is the occluded site size (the size of the site, in base pairs, that one protein molecule occupies to the exclusion of others). The cooperativity parameter ω is equal to the equilibrium constant for moving a protein from an isolated site to a singly‐contiguous one or from a singly‐contiguous site to a doubly‐contiguous one.16
The model described by this equation is one in which interactions are homogeneous, with all DNA sites of equal affinity, all protein–protein interactions of equal strength, all occluded sites of equal length, and proteins are assumed not to bind to fractional sites of length <s. When these conditions are not met, analysis using Eq. (1) returns parameter values averaged over the ensemble of detectable interactions. This complicates the characterization of heterogeneous interactions. This shortcoming has been noted, and several investigators have developed expressions that account for more than one binding mode19, 23, 24, 25 or for the coupling of DNA allosterism to binding.26 Here, we describe an experimental approach that allows resolution of two interaction modes, based on differences in the length of DNA substrate needed to support each mode. Such length‐dependent changes in binding mode are found with some frequency.27, 28, 29, 30
The molecular system that motivates our work is that of human O6‐alkylguanine‐DNA alkyltransferase (AGT) interacting with short duplex DNA molecules. AGT (also known as methylguanine methyltransferase, MGMT) is a ubiquitous enzyme with an amino acid sequence that is conserved in Eubacteria, Archaea and Eukarya. It repairs mutagenic and carcinogenic O6‐alkylguanine and O4‐alkylthymine adducts in single‐stranded and duplex DNAs.31, 32 Ironically, it also protects tumor cells against the actions of alkylating chemotherapeutic drugs.33, 34 Pre‐clinical studies and clinical trials are underway to determine whether AGT‐inhibitors can increase the efficacy of DNA‐alkylating drugs.35, 36
Human AGT is a well‐characterized protein31, 34, 37, 38 that binds undamaged DNA with little sequence‐specificity or base‐composition‐specificity and only moderate cooperativity.10, 39, 40 It binds the minor groove face of B‐form DNA, bending the DNA toward the major groove by ∼15 degrees37 and unwinding the DNA by ∼7 degrees.41 It occupies ∼8bp along one face of the DNA cylinder,37 but each molecule excludes others from only 4bp40; thus protein molecules overlap along the DNA contour. At binding saturation on torsionally‐relaxed DNA, this produces a three‐start helical array of proteins with each monomer displaced by ∼13.6 Å along the helix axis and rotated ∼138 degrees with respect to its nearest neighbors42 (Figure 1). This combination of rotation and translation allows little contact between proteins that are nearest neighbors, but proteins in relative positions n and n+3 make extensive contact (ΔASA ∼1100Å2).42 Accordingly, we predicted that the n‐to‐n+3 contact would contribute more to binding cooperativity than would nearest neighbor interactions. Here, we use a combination of new data and data from a previous study,40 together with a new analysis strategy, to test this prediction.
Figure 1.
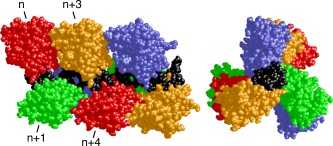
Model of a cooperative AGT‐DNA complex formed on double‐stranded DNA. The repeating unit of this model is one molecule of AGT (colors) plus 4 base‐pairs of DNA (black); the coordinates were derived from the crystal structure of Daniels et al.37 Repeating units were juxtaposed with preservation of B‐DNA helical parameters (separation = 3.4 Å, twist = 34.6°) between base‐pairs of adjacent units. For details of the construction of this model and data supporting it, see Adams et al.42 Left panel: side view with N‐terminal faces of proteins oriented to left. Right panel: end‐view showing the C‐terminal faces of proteins.
MATERIALS AND METHODS
Reagents
T4 polynucleotide kinase was purchased from New England Biolabs. [γ‐32P]ATP was from ICN Radiochemicals. Electrophoresis grade polyacrylamide was from Fisher. All other chemicals were reagent‐grade or better.
Protein and DNA Preparations
Recombinant human AGT protein (tagged with His6 at its C‐terminal end) was purified to apparent homogeneity according to published protocols.37 The purity of the protein was verified by SDS‐gel electrophoresis followed by silver‐staining.43 Sedimentation equilibrium data were consistent with a single species of M r = 21,860 ± 400 for [AGT] ≤ 100 µM, consistent with the value (M r = 21,614) predicted for this sequence variant (results not shown). The preparations used were >95% active in transfer of methyl groups from O6‐[3H]methyl guanine‐labeled calf‐thymus DNA to AGT and >95% active in debenzylating O 6‐benzylguanine, as previously described.44, 45 AGT concentrations were measured spectrophotometrically using ε 280 = 3.93 × 10⁴ M−1 cm−1.45 Samples were stored at −80°C until needed.
Oligodeoxyribonucleotides (sequences shown in Table 1) were synthesized by the Macromolecular Core Facility of the Penn State College of Medicine or were purchased from Midland Certified Reagent Company. Single‐stranded DNA concentrations were measured using extinction coefficients calculated by the nearest‐neighbor method.46, 47 Where appropriate, oligo‐nucleotides were labeled at 5′ termini with 32P as described by Maxam and Gilbert.48 Duplex DNAs were obtained by mixing an oligonucleotide with a 1.05‐fold molar excess of its complement. Samples dissolved in 10 mM Tris (pH 8.0 at 20°C ± 1°C), 1 mM EDTA buffer, were heated to 90°C for 3 min and cooled to 20°C over 2 h. Duplex formation was monitored by non‐denaturing PAGE.49 All DNAs were dialyzed against 10 mM Tris (pH 8.0), 0.1 mM EDTA before use or storage at −20°C.
Table 1.
Duplex Oligodeoxynucleotides
| Length bp | Sequence |
|---|---|
| 11 | 5′‐TTT TTG TTT TT‐3′ 3′‐AAA AAC AAA AA‐5′ |
| 12 | 5′‐GAC TGA CTG ACT‐3′ 3′‐CTG ACT GAC TGA‐5′ |
| 14 | 5′‐GAC TGA CTG ACT GA‐3′ 3′‐CTG ACT GAC TGA CT‐5′ |
| 16 | 5′‐GAC TGA CTG ACT GAC T‐3′ 3′‐CTG ACT GAC TGA CTG A‐5′ |
| 18 | 5′‐GGA ACC TTG GAA CCT TGG‐3′ 3′‐CCT TGG AAC CTT GGA ACC‐5′ |
| 20 | 5′‐GAC TGA CTG ACT GAC TGA CT‐3′ 3′‐CTG ACT GAC TGA CTG ACT GA‐5′ |
| 21 | 5′‐TGA AGT CCA AAG TTC AGT CCC‐3′ 3′‐CT TCA GGT TTC AAG TCA GGG A‐5′ |
| 22 | 5′‐CGC CAA CCC GCT GCC TAT CGT T‐3′ 3′‐GCG GTT GGG CGA CGG ATA GCA A‐5′ |
| 24 | 5′‐AAA AAA AAA AAA AAA AAA AAA AAA‐3′ 3′‐TTT TTT TTT TTT TTT TTT TTT TTT‐5′ |
| 24 | 5′‐GGG GGG GGG GGG GGG GGG GGG GGG‐3′ 3′‐CCC CCC CCC CCC CCC CCC CCC CCC‐5′ |
| 26 | 5′‐GAC TGA CTG ACT GAC TGA CTG ACT GA‐3′ 3′‐CTG ACT GAC TGA CTG ACT GAC TGA CT‐5′ |
| 28 | 5′‐GAC TGA CTG ACT GAC TGA CTG ACT GAC T‐3′ 3′‐CTG ACT GAC TGA CTG ACT GAC TGA CTG A‐5′ |
| 30 | 5′‐GTG CCG CCA ACC CGC TGC CTA TCG TTA TAC‐3′ 3′‐CAC GGC GGT TGG GCG ACG GAT AGC AAT ATG‐5′ |
DNAs new to this study are indicated in boldface. Other DNAs have been previously described.40
Electrophoretic Mobility Shift Assays (EMSA)
Binding reactions were carried out at 20°C ± 1°C in 10 mM Tris (pH 7.6), 100 mM NaCl, 1 mM dithiothreitol, and 10 µg/mL bovine serum albumin. Mixtures were equilibrated at 20 (±1)°C for 30 min. Duplicate samples incubated for longer periods gave identical results, indicating that equilibrium had been attained (result not shown). Electrophoresis was carried out in 10% polyacrylamide gels.10 Autoradiographic images were captured on storage phosphor screens (type GP, GE Healthcare) detected with a Typhoon phosphorimager. In a few cases data was captured using Kodak XB‐1 film and digitized using the Typhoon instrument. Band‐quantitation was performed using Image‐Quant software (GE Healthcare).
Analytical Ultracentrifugation
Human AGT protein and duplex DNAs were dialyzed against 10 mM Tris (pH 7.6), 1 mM DTT, 1 mM EDTA, 100 mM NaCl. Analytical ultracentrifugation was performed at 20°C ± 0.1°C in a Beckman XL‐A centrifuge using an AN60Ti rotor. Scans were obtained at 260 nm. Approach to equilibrium was considered to be complete when scans taken 6h apart were indistinguishable. Five scans were averaged for each sample at each wavelength and rotor speed.
For DNAs with small numbers of protein‐binding sites, strong, positively‐cooperative binding can be described by an all‐or‐none mechanism, nP + D ⇄ PnD, in which free protein (P) and DNA (D) are in equilibrium with saturated complex (PnD) and intermediates with protein stoichiometries < n are not present in significant concentrations. The radial distribution of absorbance at sedimentation equilibrium for such a system is given by Eq. (2).
| (2) |
Here A(r) is the absorbance at radial position r and αP, αD and αPnD are absorbances of protein, DNA and protein‐DNA complex at the reference position, r o, and ε is a baseline offset that accounts for radial position‐independent differences in the absorbances of different cell assemblies. The reduced molecular weights of AGT protein, DNA and protein‐DNA complexes are given by σ P = M P(1 − P ρ)z 2/(2RT), σ D = M D(1− D ρ)z 2/(2RT) and = (nM P + M D)(1 − ρ)z2/(2RT). Here M P and M D are the molecular weights of protein and DNA, n is the protein:DNA ratio of the complex; ρ is the solvent density, z, the rotor angular velocity, R is the gas constant and T the temperature (Kelvin). The partial specific volume of AGT ( P = 0.744 mL/g) was calculated by the method of Cohn and Edsall,50 using partial specific volumes of amino acids tabulated by Laue and co‐workers.51 The partial specific volume of double‐stranded NaDNA at 0.1M NaCl (0.540 ml/g) was estimated by interpolation of the data of Cohen and Eisenberg.52 The partial specific volumes of protein‐DNA complexes were estimated using Eq. (3).
| (3) |
RESULTS
Binding Stoichiometries and Site Sizes
Titration of short DNAs with AGT gave mixtures containing the free duplex and a saturated protein‐DNA complex. Mobility‐shift profiles for mixtures containing the 20bp and 28bp DNAs are shown in Figure 2. Global analyses of sedimentation equilibirum data obtained under conditions of AGT‐excess (Figure 3) returned Mr(complex, 20mer) = 115,026 ± 4,235 and Mr(complex, 28mer) = 170,466 ± 5,138, respectively, consistent with AGT stoichiometries of 4.8 ± 0.17 for the 20mer and 7.11 ± 0.21 for the 28mer. These stiochiometries are consistent with binding site sizes of ∼4bp/protein found for dsDNAs of other lengths40, 53 and they conform to the model shown in Figure 1, in which protein molecules are tightly packed along the DNA contour.
Figure 2.

Titration of 20bp and 28bp DNAs with human AGT, detection by EMSA. Upper panel: 20‐mer duplex DNA, 1.35 × 10⁻⁹ M with [AGT] increasing from 0 M to 3.5 × 10⁻⁶ M from left to right. Lower panel: 28‐mer duplex DNA, 3.6 × 10⁻⁹ M, with [AGT] increasing from 0 M to 5.5 × 10⁻⁶ M from left to right. Binding reactions were carried out at 20°C ± 1°C and samples were resolved on 10% polyacrylamide gels, as described in Experimental Procedures. Band designations B, bound DNA; F, free DNA.
Figure 3.

Determination of stoichiometry for AGT complexes with 20mer and 28mer DNAs. Sedimentation equilibrium analyses carried out at 20°C ± 0.1°C, in 10 mM Tris (pH 7.6), 1 mM DTT, 1 mM EDTA, 100 mM NaCl, at 14,000, 19,000, and 23,000 rpm. The smooth curves represent a global fit of Eq. (2) to the combined data. Small, symmetrically distributed residuals indicate that this sedimentation model corresponds well to the data. Left panel: complexes formed with the 20mer duplex. Individual profiles offset vertically for clarity. Samples containing 1.04 × 10⁻⁶ M DNA and 9.4 × 10⁻⁶ M AGT returned M w (complex) = 115,026 ± 4235, corresponding to ∼4.8 AGT/DNA. Right panel: complexes formed with the 28mer duplex. Individual profiles offset vertically for clarity. Samples containing 1.57 × 10⁻⁶ M DNA and 1.6 × 10⁻⁵ M AGT returned M w(complex) = 170,466 ± 5,138, corresponding to ∼7.1 AGT/DNA.
Sequence‐Dependent Association Constants, Sequence‐Independent Cooperativities
Equation (1) resolves overall binding affinity into ensemble‐average values of K and ω. Shown in Figure 4 are Scatchard plots of data for AGT binding to 20bp and 28bp duplexes. Fitting the data with Eq. (1) returned values of K(ave, 20mer) = 8286 ± 1134 M−1, ω(ave, 20mer) = 112.1± 18.1, and K(ave, 28mer) = 10174 ± 1081 M−1, ω(ave, 28mer) = 127.9 ± 13.6. These values are comparable to others found under the same conditions of temperature and buffer composition, but using different DNAs (Figure 5). Values of K and ω oscillate with increasing DNA length, and the fact that maxima for K and ω occur at both 16bp and 20bp DNA lengths suggests that protein‐DNA and protein‐protein interactions may be coupled to some degree (In a study of drug‐DNA interactions, Correia and Chaires found values of K and ω were strongly correlated 54; this remains an important caveat in the use of least‐squares fitting using the McGhee‐von Hippel equation and related expressions). However, it is clear that DNA sequence, or possibly base composition, also has an effect on K (compare values for dG24•dC24 and dA24•dT24 substrates) and sequence effects on binding to the rest of the heterogeneous DNA population may obscure periodicity in K as DNA length increases.
Figure 4.

Determination of ensemble average binding affinities for 20bp and 28bp DNAs. DNAs ([20 mer] = 1.35 × 10⁻⁹ M, [28mer] = 3.6 × 10⁻⁹ M) were titrated with AGT protein (0 ≤ [AGT] ≤ 5.2 × 10⁻⁵ M) in buffer consisting of 10 mM Tris (pH 7.6), 1 mM DTT, 1 mM EDTA, 100 mM NaCl. Free and bound DNA species were resolved by native electrophoresis (EMSA) as described for Figure 2. Each data set is derived from two or more independent titrations. The smooth curves are non‐linear least squares fits using Eq. (1).
Figure 5.

Dependence of K and ω on DNA length. Points designated with arrows are results of experiments shown in Figure 4. Data for other DNA lengths are from Melikishvili et al.40 The error bars correspond to 95% confidence limits estimated for each parameter. The points corresponding to K‐values for dA24‐dT24 and dG24‐dC24 templates are labeled. The smooth curve fitting the dependence of ω on N is the sum of a baseline with a constant, positive slope and a cosine function40 with a period of 4.02 ± 0.05 bp/cycle.
In contrast to the irregular pattern observed for K, the oscillation of ω with DNA length is strikingly regular in amplitude and period. The complexes with the strongest protein‐protein interactions (largest ω,) occur when DNA lengths are integer‐multiples of 4bp. As one molecule of AGT occupies 4bp to the exclusion of others, these complexes are the most compact forms of the cooperative assembly. These results suggest that protein juxtaposition is optimal in the most compact complexes and becomes less so as binding density decreases. The baseline for the oscillation of ω increases uniformly with increasing DNA length. This may be a consequence of binding linear substrates. Proteins at the ends of a cooperative array interact with a single neighbor while proteins in the center of the array interact with two. With increasing array length, the proportion of proteins that make two protein contacts (i.e., are not located at array ends) increases, with corresponding increase in ω averaged over the whole assembly. A second possibility derives from the notion that the cooperative array is stabilized by two distinct protein‐protein interactions. A short‐range, nearest‐neighbor interaction, and a longer range interaction between proteins n and n+3 in the array (Figure 1). The proportion of long‐range interactions to short‐range interactions changes with increasing length. Thus a 4:1 AGT‐DNA complex is stabilized by 3 nearest neighbor and 1 long‐range interactions (long/short = 0.33), a 5:1 complex by 4 nearest neighbor, 2 long‐range interactions (long/short = 0.5) and so on. If long‐range interactions are stronger than short, as might be predicted from their larger occluded surface areas, the changing long/short ratio should increase ensemble‐average ω‐values with increasing number of proteins bound.
Distinguishing Contributions from Two Cooperative Mechanisms
The short‐range, nearest‐neighbor interaction is present in complexes with two or more adjacent proteins; a linear array containing m proteins will be stabilized by m‐1 of these short‐range interactions. The long‐range interaction extends between the nth and the n+3rd proteins; a linear array containing m proteins will be stabilized by m‐3 of these interactions. Importantly, complexes formed on DNAs that are too short to accommodate 4 proteins (≤15 bp) will be stabilized only by short‐range protein‐protein contacts. Three DNAs in our sample set meet this requirement; 11 bp (saturating stoichiometry 2 AGT/DNA, 5.5 bp/protein), 12 bp (saturating stoichiometry 3 AGT/DNA, 4 bp/protein) and 14 bp (saturating stoichiometry 3 AGT/DNA, 4.7 bp/protein). In view of this range of binding densities, the ω‐values of these AGT‐DNA complexes are strikingly uniform (45.8 ± 11.0 ≤ ω ≤ 52.0 ± 5.1) when compared with the variation found for DNAs of ≥16 bp that can accommodate the long‐range interaction (Figure 5).
To resolve short‐ and long‐range contributions to the ensemble‐average cooperativity, we treat them as if they were independent. This is justified by the fact that short‐range interactions occur in the absence of long‐range contacts and by the striking difference in DNA length‐dependence that indicates distinct geometrical requirements for the two interactions. Thermodynamic independence implies additive free energies.55 On this basis we express the average cooperative free energy for an n‐to‐1 AGT‐DNA complex as follows.
| (4) |
Rearrangement gives
| (5) |
Here, for each term, ΔG°ω = −RT ln ω, and ΔG°ω ,short is the mean of values for 11mer, 12mer and 14mer DNAs. A graph of resolved ΔG°ω ,long values as a function of DNA length is shown in Figure 6. Included for comparison are individual values for ΔG°ω ,short. For the shortest DNAs, values of ΔG°ω ,long ≤ ΔG°ω ,short, but they become less negative over the experimental DNA‐length range until they are greater than the short‐range values. This occurs for both optimally packed (4.0 bp/protein) and poorly‐packed (>4.0 bp/protein) complexes, so the increase is not simply explained by increasing packing degeneracy. As discussed below, this feature may reflect increasing torsional stress with increase in the number of proteins in each cooperative unit. Values of ΔG°ω ,long retain the oscillation seen in the DNA length‐dependence of ω. This is expected in view of the independence of ΔG°ω ,short on DNA length.
Figure 6.

Contributions of short‐ and long‐range interactions to the ensemble average cooperative free energy. Short‐range components (ΔG°ω ,short) were determined directly from binding data using Eq. (1), for DNAs of ≤14 bp, using ΔG°ω ,ave = ΔG°ω ,short. Long‐range components were calculated for DNAs of length ≥16 bp, using Eq. (5). For this we used the mean of the three available values of ΔG°ω ,short. The smooth curve through the long‐range points is the sum of a damped cosine function and a hyperbolic baseline; the period of the cosine function is 4.02 ± 0.07 bp/cycle. The arrows designate values calculated for 20bp and 28bp DNAs using the analyses shown in Figures 3, 4, 5. Error bars represent propagation of experimental uncertainties through the calculation.
DISCUSSION
The reduced binding valence approach described here is conceptually similar to one used to resolve contributions of operator‐repressor interactions in the phage lambda system.56 It differs in that lambda repressor binds DNA with high sequence specificity, allowing valence to be altered by changing DNA sequence; here AGT binds with low sequence specificity (Figure 5), so we alter valence by changing DNA length. Our analysis is based on a structural model42 that predicts that two cooperative interactions operate on different DNA length scales. That model is supported by a wide range of experimental data, including crystal structures of AGT‐DNA complexes,37, 57 chemical crosslinking and directed mutagenesis42, 58 and solution binding analyses.40, 41
On short DNAs cooperativity produces tight packing of AGT molecules that results in DNA‐length dependent oscillations in binding density with a period of 4 bp/protein molecule.40 The ensemble‐average cooperativity ω oscillates with the same frequency. This supports the idea that some molecular contacts that contribute to cooperativity require the correct juxtaposition of proteins. However, this requirement is clearly not absolute, because significant cooperativity was obtained with all DNA lengths, even those allowing inefficient packing. Our analysis parses ensemble‐average cooperativity values into a non‐oscillatory short‐range component and a long‐range component that oscillates with a 4 bp period that is identical to the contour length of DNA occluded by an AGT molecule.
The striking features of the short‐range component are its apparent independence of protein stoichiometry and DNA length. These characteristics suggest two distinct structural possibilities. First, that the protein density within cooperative clusters varies with DNA length, but ω is independent (or weakly dependent) of protein density. If this is the case, it seems unlikely that cooperativity results from contacts that require precise juxtaposition of protein molecules. A plausible alternative is that these interactions are mediated by DNA allostery. AGT binding widens the DNA minor groove by ∼3Å and bends the DNA toward the major groove by ∼15 degrees.37 One or both of these changes might facilitate the binding of adjacent proteins. A second possibility (and the one that we currently favor) is that protein density within cooperative clusters is always the same and any unoccupied base‐pairs are located outside of the cluster. This idea is supported by the fact that for these short DNAs, ω is greater than the number of possible degenerate states, so compact clusters should be more probable than dispersed binding configurations. It is also consistent with our observation that compact clusters form on large DNAs at sub‐saturating AGT concentrations.41 If this reasoning is correct, the short‐range cooperativity is likely mediated, at least in part, by contacts between adjacent proteins.
The long‐range n‐to‐n+3 interaction is also intriguing. Its oscillation shows that it depends on geometry (recall that on B‐DNA, changing the separation of two proteins by 1 bp results in a 3.4 Å translation and a 34.6 degree rotation of one with respect to the other). However, the fact that ΔG°ω ,long is always < 0 tells us that that long‐range interactions are possible even when proteins are not optimally‐juxtaposed. This suggests that the interactions are flexible to some degree, as might be expected for proteins with center‐to‐center separation of 12bp along the DNA contour. A second interesting feature is the DNA length‐dependent increase of ΔG°ω ,long. This may reflect the ∼7 degree/protein unwinding that AGT imposes on relaxed‐form DNAs.42 Calculations show that as complexes increase in length, torsional free energy accumulates until it is of the same magnitude but opposite sign to that of binding cooperativity (ΔG°twist = ‐ΔG°ω ,ave). Under temperature and ionic conditions similar to those used here, this effect was found to be large enough to limit the size of cooperative clusters to 6–8 proteins.41 This limiting cluster size coincides well with a residual ΔG°ω ,long of only −1.2 kcal/mol for complexes containing 7 AGT molecules (Figure 6).
Mutation of AGT residues in the n‐to‐n+3 interaction interface reduces the enzyme's ability to protect cells from DNA‐alkylating agent methylnitronitrosoguanidine (MNNG).58 This result suggests that cooperativity plays an important role in lesion search in vivo. In that context, the results described here prompt several testable predictions. First, cooperative interactions require unoccupied stretches of DNA. Thus, in vivo, we expect AGT to distribute in favor of inter‐nucleosomal spacer regions and regions in which chromatin remodeling is active. This would place AGT activities within nucleosome‐free DNA sites. These unprotected locations are relatively‐susceptible to DNA‐alkylation, so the concentration of alkyltransferase activity in these regions may contribute to the efficient repair of alkylated bases. Replication forks are also located in regions of chromatin remodeling. Co‐localization of AGT with replication machinery has the potential to prevent the mutagenic consequences of base mis‐pairing with O6‐alkylguanines during DNA synthesis. Second, the long‐range interaction depends on protein‐protein contacts that appear to be optimal when the DNA is torsionally‐relaxed (Figure 1). This characteristic supports predictions that AGT activities will depend on topoisomerase activities in vivo, and that AGT and topoisomerase activities will co‐segregate within chromosomal domains. A related and exciting possibility is that inhibition of one or more topoisomerases may also inhibit repair by AGT and thus potentiate the effects of chemotherapeutic alkylating agents. These predictions call strongly for further investigation.
This article is dedicated to Don Crothers, an extraordinary teacher and mentor. The authors also acknowledge valuable discussions with Drs. Donald Rau and James Cole. Dr. Sambit Kar did preliminary work on the binding of 20bp and 28bp DNAs.
This article was originally published online as an accepted preprint. The “Published Online” date corresponds to the preprint version. You can request a copy of any preprints from the past two calendar years by emailing the Biopolymers editorial office at biopolymers@wiley.com.
REFERENCES
- 1. Saxe, S. A. ; Revzin, A. Biochemistry 1979, 18, 255–263. [DOI] [PubMed] [Google Scholar]
- 2. Takahashi, M. ; Blazy, B. ; Baudras, A. Nucl. Acids Res. 1979, 7, 1699–1712. [DOI] [PMC free article] [PubMed] [Google Scholar]
- 3. Hard, T. ; Dahlman, K. ; Carlstedt‐Duke, J. ; Gustafsson, J.‐A. ; Rigler, R. Biochemistry 1990, 29, 5358–5364. [DOI] [PubMed] [Google Scholar]
- 4. Phelps, C. B. ; Sengchanthalangsy, L. L. ; Shiva Malek, S. ; Ghosh, G. J. Biol. Chem. 2000, 275, 24392–24399. [DOI] [PubMed] [Google Scholar]
- 5. Daly, T. J. ; Wu, C. W. J. Biol. Chem. 1989, 264, 20394–20402. [PubMed] [Google Scholar]
- 6. Watanabe, F. Nucl. Acids Res. 1986, 14, 3573–3585. [DOI] [PMC free article] [PubMed] [Google Scholar]
- 7. Bouffartigues, E. ; Buckle, M. ; Badaut, C. ; Travers, A. ; Rimsky, S. Nat Struct Mol Biol. 2007, 14, 441–448. [DOI] [PubMed] [Google Scholar]
- 8. Peterson, S. N. ; Dahlquist, F. W. ; Reich, N. O. J. Mol .Biol. 2007, 369, 1307–1317. [DOI] [PubMed] [Google Scholar]
- 9. Lee, C. Y. ; Bai, H. ; Houle, R. ; Wilson, G. M. ; Lu, A. L. J. Biol. Chem. 2004, 279, 52653–52663. [DOI] [PubMed] [Google Scholar]
- 10. Rasimas, J. J. ; Kar, S. R. ; Pegg, A. E. ; Fried, M. G. J. Biol. Chem. 2007, 282, 3357–3366. [DOI] [PMC free article] [PubMed] [Google Scholar]
- 11. Villemain, J. L. ; Giedroc, D. P. Biochemistry 1993, 32, 11235–11246. [DOI] [PubMed] [Google Scholar]
- 12. Ferrari, M. E. ; Bujalowski, W. ; Lohman, T. M. J Mol Biol. 1994, 236, 106–123. [DOI] [PubMed] [Google Scholar]
- 13. Latt, S. A. ; Sober, H. A. Biochemistry 1967, 6, 3293–3230. [DOI] [PubMed] [Google Scholar]
- 14. Crothers, D. M. Biopolymers 1968, 6, 575–584. [DOI] [PubMed] [Google Scholar]
- 15. Crothers, D. M. Biopolymers 1971, 10, 2147–2160. [DOI] [PubMed] [Google Scholar]
- 16. McGhee, J. ; von Hippel, P. H. J. Mol. Biol. 1974, 86, 469–489. [DOI] [PubMed] [Google Scholar]
- 17. Epstein, I. R. Biophys. Chem. 1978, 8, 327–339. [DOI] [PubMed] [Google Scholar]
- 18. Nechipurenko, Y. D. ; Gursky, G. V. Biophys. Chem. 1986, 24, 195–209. [DOI] [PubMed] [Google Scholar]
- 19. Bujalowski, W. ; Lohman, T. M. ; Anderson, C. F. Biopolymers 1989, 28, 1637–1643. [DOI] [PubMed] [Google Scholar]
- 20. Wolfe, A. R. ; Meehan, T. J Mol Biol. 1992, 223, 1063–1087. [DOI] [PubMed] [Google Scholar]
- 21. Tsodikov, O. V. ; Holbrook, J. A. ; Shkel, I. A. ; Record, M. T., Jr. Biophys. J. 2001, 81, 1960–1969. [DOI] [PMC free article] [PubMed] [Google Scholar]
- 22. Ucci, J. W. ; Cole, J. L. Biophys. Chem. 2004, 108, 127–140. [DOI] [PMC free article] [PubMed] [Google Scholar]
- 23. Kowalczykowski, S. C. ; Paul, L. S. ; Lonberg, N. ; Newport, J. W. ; McSwiggen, J. A. ; von Hippel, P. H. Biochemistry 1986, 25, 1226–1240. [DOI] [PubMed] [Google Scholar]
- 24. Schwarz, G. ; Stankowski, S. Biophys. Chem. 1979, 10, 173–181;. [DOI] [PubMed] [Google Scholar]
- 25. Rajendran, S. ; Jezewska, M. J. ; Bujalowski, W. J. Biol. Chem. 1998, 47, 31021–31031. [DOI] [PubMed] [Google Scholar]
- 26. Dattagupta, N. ; Hogan, M. ; Crothers, D. M. Biochemistry 1980, 19, 5998–6005. [DOI] [PubMed] [Google Scholar]
- 27. Koh, J. ; Saecker, R. M. ; Record, M. T. J. J. Mol. Biol. 2008, 383, 324–346. [DOI] [PMC free article] [PubMed] [Google Scholar]
- 28. Roy, R. ; Kozlov, A. G. ; T. M. L.; Ha, T. J. Mol. Biol. 2007, 369, 1244–1257. [DOI] [PMC free article] [PubMed] [Google Scholar]
- 29. Kumaran, S. ; Kozlov, A. G. ; Lohman, T. M. Biochemistry 2006, 45, 11958–119573. [DOI] [PMC free article] [PubMed] [Google Scholar]
- 30. McCauley, M. ; Hardwidge, P. R. ; Maher, L. J. r. ; Williams, M. C. Biophys J. 2005, 89, 353–364. [DOI] [PMC free article] [PubMed] [Google Scholar]
- 31. Margison, G. P. ; Santibáñez‐Koref, M. F. BioEssays 2002, 24, 255–266. [DOI] [PubMed] [Google Scholar]
- 32. Pegg, A. E. Chem Res Toxicol. 2011, 24, 618–669. [DOI] [PMC free article] [PubMed] [Google Scholar]
- 33. Gerson, S. L. J. Clin. Oncol. 2002, 20, 2388–2399. [DOI] [PubMed] [Google Scholar]
- 34. Pegg, A. E. Mutat Res. 2000, 462, 83–100. [DOI] [PubMed] [Google Scholar]
- 35. Blumenthal, D. T. ; Rankin, C. ; Stelzer, K. J. ; Spence, A. M. ; Sloan, A. E. ; Moore, D. F., Jr. ; Padula, G. D. ; Schulman, S. B. ; Wade, M. L. ; Rushing, E. J. International journal of clinical oncology 2014. [DOI] [PMC free article] [PubMed] [Google Scholar]
- 36. Ugur, H. C. ; Taspinar, M. ; Ilgaz, S. ; Sert, F. ; Canpinar, H. ; Rey, J. A. ; Castresana, J. S. ; Sunguroglu, A. Molecular biology reports 2014, 41, 697–703. [DOI] [PubMed] [Google Scholar]
- 37. Daniels, D. S. ; Woo, T. T. ; Luu, K. X. ; Noll, D. M. ; Clarke, N. D. ; Pegg, A. E. ; Tainer, J. A. Nat. Struct. Mol. Biol. 2004, 11, 714–720. [DOI] [PubMed] [Google Scholar]
- 38. Duguid, E. M. ; Rice, P. A. ; He, C. J. Mol. Biol. 2005, 350, 657–666. [DOI] [PubMed] [Google Scholar]
- 39. Fried, M. G. ; Kanugula, S. ; Bromberg, J. L. ; Pegg, A. E. Biochemistry 1996, 35, 15295–15301. [DOI] [PubMed] [Google Scholar]
- 40. Melikishvili, M. ; Rasimas, J. J. ; Pegg, A. E. ; Fried, M. G. Biochemistry 2008, 47, 13754–13763. [DOI] [PMC free article] [PubMed] [Google Scholar]
- 41. Tessmer, I. ; Melikishvili, M. ; Fried, M. G. Nucleic Acids Res 2012. [DOI] [PMC free article] [PubMed] [Google Scholar]
- 42. Adams, C. A. ; Melikishvili, M. ; Rodgers, D. W. ; Rasimas, J. J. ; Pegg, A. E. ; Fried, M. G. J. Mol. Biol. 2009, 389, 248–263. [DOI] [PMC free article] [PubMed] [Google Scholar]
- 43. Laemmli, U. K. Nature 1970, 227, 680–685. [DOI] [PubMed] [Google Scholar]
- 44. Kanugula, S. ; Goodtzova, K. ; Edara, S. ; Pegg, A. E. Biochemistry 1995, 34, 7113–7119. [DOI] [PubMed] [Google Scholar]
- 45. Rasimas, J. J. ; Kanugula, S. ; Dalessio, P. M. ; Ropson, I. J. ; Fried, M. G. ; Pegg, A. E. Biochemistry 2003, 42, 980–990. [DOI] [PubMed] [Google Scholar]
- 46. Cantor, C. R. ; Tinoco, I., Jr. J. Mol. Biol. 1965, 13, 65–77. [DOI] [PubMed] [Google Scholar]
- 47. Cavaluzzi, M. J. ; Borer, P. N. Nucl. Acids Res. 2004, 32, e13. [DOI] [PMC free article] [PubMed] [Google Scholar]
- 48. Maxam, A. ; Gilbert, W. S. Proc. Natl. Acad. Sci. U.S.A. 1977, 74, 560–565. [DOI] [PMC free article] [PubMed] [Google Scholar]
- 49. Maniatis, T. ; Efstratiadis, A. Method Enzymol. 1980, 65, 299–305. [DOI] [PubMed] [Google Scholar]
- 50. Cohn, E. J. ; Edsall, J. T. Proteins, Amino Acids and Peptides as Ions and Dipolar Ions In Proteins, Amino Acids and Peptides as Ions and Dipolar Ions, Cohn E. J.; Edsall J. T., Eds. Reinhold: New York, 1943; pp 370–381 and 428–431. [Google Scholar]
- 51. Laue, T. M. ; Shah, B. D. ; Ridgeway, T. M. ; Pelletier, S. L. , Computer‐Aided Interpretation of Analytical Sedimentation Data For Proteins In Analytical Ultracentrifugation in Biochemistry and Polymer Science, Harding S. E.; Rowe A. J.; Horton J. C., Eds. The Royal Society of Chemistry: Cambridge, England, 1992; pp 90–125. [Google Scholar]
- 52. Cohen, G. ; Eisenberg, H. Biopolymers 1968, 6, 1077–1100. [DOI] [PubMed] [Google Scholar]
- 53. Rasimas, J. J. ; Pegg, A. E. ; Fried, M. G. J. Biol. Chem. 2003, 278, 7973–7980. [DOI] [PubMed] [Google Scholar]
- 54. Correia, J. J. ; Chaires, J. Methods Enzymol. 1994, 240, 593–614. [DOI] [PubMed] [Google Scholar]
- 55. Dill, K. A. J. Biol. Chem. 1997, 272, 701–704. [DOI] [PubMed] [Google Scholar]
- 56. Ackers, G. ; Johnson, A. ; Shea, M. Proc. Natl. Acad. Sci. USA 1982, 79, 1129–1133. [DOI] [PMC free article] [PubMed] [Google Scholar]
- 57. Tubbs, J. L. ; Pegg, A. E. ; Tainer, J. A. DNA Repair (Amst) 2007, 6, 1100–1115. [DOI] [PMC free article] [PubMed] [Google Scholar]
- 58. Adams, C. A. ; Fried, M. G. Biochemistry 2011, 50, 1590–1598. [DOI] [PMC free article] [PubMed] [Google Scholar]