

Summary
Animal group size distributions are often right‐skewed, whereby most groups are small, but most individuals occur in larger groups that may also disproportionately affect ecology and policy. In this case, examining covariates associated with upper quantiles of the group size distribution could facilitate better understanding and management of large animal groups.
We studied wintering elk groups in Wyoming, where group sizes span several orders of magnitude, and issues of disease, predation and property damage are affected by larger group sizes. We used quantile regression to evaluate relationships between the group size distribution and variables of land use, habitat, elk density and wolf abundance to identify conditions important to larger elk groups.
We recorded 1263 groups ranging from 1 to 1952 elk and found that across all quantiles of group size, group sizes were larger in open habitat and on private land, but the largest effect occurred between irrigated and non‐irrigated land [e.g. the 90th quantile group size increased by 135 elk (95% CI = 42, 227) on irrigation].
Only upper quantile group sizes were positively related to broad‐scale measures of elk density and wolf abundance. For wolf abundance, this effect was greater on elk groups found in open habitats and private land than those in closed habitats or public land. If we had limited our analysis to mean or median group sizes, we would not have detected these effects.
Synthesis and applications. Our analysis of elk group size distributions using quantile regression suggests that private land, irrigation, open habitat, elk density and wolf abundance can affect large elk group sizes. Thus, to manage larger groups by removal or dispersal of individuals, we recommend incentivizing hunting on private land (particularly if irrigated) during the regular and late hunting seasons, promoting tolerance of wolves on private land (if elk aggregate in these areas to avoid wolves) and creating more winter range and varied habitats. Relationships to the variables of interest also differed by quantile, highlighting the importance of using quantile regression to examine response variables more completely to uncover relationships important to conservation and management.
Keywords: group living, group size trade‐offs, habitat openness, predation refugia, predation risk, sociality, ungulate behaviour, wildlife disease
Short abstract
Our analysis of elk group size distributions using quantile regression suggests that private land, irrigation, open habitat, elk density and wolf abundance can affect large elk group sizes. Thus, to manage larger groups by removal or dispersal of individuals, we recommend incentivizing hunting on private land (particularly if irrigated) during the regular and late hunting seasons, promoting tolerance of wolves on private land (if elk aggregate in these areas to avoid wolves) and creating more winter range and varied habitats. Relationships to the variables of interest also differed by quantile, highlighting the importance of using quantile regression to examine response variables more completely to uncover relationships important to conservation and management.
Introduction
Ecological studies often use regression to estimate changes in the mean of a response variable as a function of covariates, but for some conservation and management problems, it may be more important to estimate changes in other parts of the response distribution using quantile regression. Quantile regression is a statistical method for modelling linear relationships at quantiles of the response variable (Koenker & Bassett 1978) and has been particularly useful for examining how the edges of response distributions change as a function of covariates (e.g. for understanding how an ecological response such as species abundance is constrained by particular habitat variables; Cade, Terrell & Schroeder 1999; Cade & Noon 2003). Quantile regression does not assume equal variances across covariate values nor does it make assumptions about the distribution of errors. Therefore, it is also useful for models with unevenly distributed observations, and where more than one slope can describe how the response and explanatory variables are related (Cade & Noon 2003). We used quantile regression to examine elk Cervus canadensis group size distributions in western Wyoming where issues of disease, predation and damage to private property are affected by larger group sizes.
Understanding the causes and consequences of group formation is a fundamental aspect of animal ecology (Parrish & Edelstein‐keshet 1999; Krause & Ruxton 2002). Studies of grouping, however, typically use linear models to understand changes in mean group size as a function of covariates, while overlooking changes to upper quantiles of the group size distribution (but see Proffitt et al. 2012). This is an important information gap for many animals with right‐skewed group size distributions (Reiczigel et al. 2008), because in these cases, upper quantile group sizes may change with covariates at substantially higher rates than mean group sizes and have disproportionate effects on ecology and policy (e.g. higher risk of spreading diseases). Using quantile regression to examine relationships with upper quantile group sizes could help identify areas or conditions where management could have the greatest impact on larger groups (e.g. where harvest could be used to disperse animals or reduce numbers, to in turn decrease contact rates and pathogen transmission). Large animal aggregations can also be beneficial to individuals (e.g. dilute predation risk, Krause & Ruxton 2002) and critical to ecosystem function (e.g. by modifying vegetation distribution and quality, McNaughton 1984), emphasizing the need to focus on more than mean group size in ecological and behavioural analyses.
Elk in the Greater Yellowstone Area (GYA) are often managed at high numbers for their environmental, economic and cultural value, but they are also an important reservoir of Brucella abortus and have been linked to brucellosis outbreaks in cattle (Beja‐Pereira et al. 2009). Understanding the conditions important to large elk groups is of particular relevance to regional brucellosis management because evidence suggests that recent brucellosis increases in elk are positively related to elk group size (Brennan et al. 2014; Proffitt et al. 2015). Elk are also important prey for predators such as grey wolves Canis lupus, and large elk groups occurring near human settlements could attract predators to areas with livestock. Though high availability of native prey typically reduces the likelihood of predation on livestock, previous research suggests that wolf–livestock conflicts may increase where elk and cattle comingle (Bradley & Pletscher 2005; Nelson et al. 2012). Large aggregations of elk could also damage private property (e.g. crop depredation or fence damage) when elk move to these areas as a way to obtain refuge from hunters on nearby public land (Burcham, Edge & Marcum 1999) or because they seek higher quality forage on irrigated pastures (as hypothesized by Wilmers & Levi 2013). Most of these issues peak during the winter months when elk aggregate on low elevation, low snow areas near humans and livestock. Thus, we studied elk group size distributions on the winter range to inform management of large wintering elk groups.
We measured elk group sizes across three winters and 10 elk management units (referred to as hunt areas) and used linear quantile regression to evaluate relationships between quantiles of the group size distribution and variables of land management (public land, private land and management closures), irrigation, habitat, snowpack, elk density and wolf abundance. We considered relationships with land management because elk have been shown to aggregate on private land to avoid hunters on public land, and these aggregations may persist after the hunting season closes (Burcham, Edge & Marcum 1999). We examined elk winter range closed to human use (management closures), because as these closures are important tools for protecting wintering elk, they may be places where larger groups and higher rates of disease occur. The effect of irrigation was also considered because large aggregations may occur on irrigated pastures where forage can be more accessible or higher in quality.
Other variables in our analysis have been shown by others to be important to elk grouping behaviour, including slope of the landscape and distance to road (Fortin et al. 2005), habitat diversity (Boyce, Mao & Merrill 2003), habitat openness (e.g. Creel & Winnie 2005; Proffitt et al. 2009), snowpack and elk density (e.g. Gower et al. 2009; Proffitt et al. 2015), and predation risk from wolves (e.g. Creel & Winnie 2005; Gower et al. 2009). Wolf effects on elk group size, however, can be highly context‐dependent. For example, elk may form smaller groups when exposed to wolf predation risk in relatively closed habitats (Creel & Winnie 2005), but form larger groups in open habitats where wolf densities are higher (Gower et al. 2009). We also suggest that wolves may target elk on private land if elk aggregate in these areas to avoid human hunters on public land. In this case, elk on private land may form larger groups to dilute wolf predation risk. Therefore, we evaluated two interaction terms (wolf abundance by habitat openness and wolf abundance by land management) to further investigate the effect of wolves on elk group size distributions. We used quantile regression to understand how the effects of these covariates differed across the elk group size distribution and to identify strategies for managing large wintering elk groups.
Materials and methods
Study area
We measured elk group size and environmental variables in 10 elk hunt areas in western Wyoming (Fig. 1) from January through May in 2010, 2011 and 2012. These months encompass the period when B. abortus is most likely to be transmitted among elk (Roffe et al. 2004) and when most elk have moved to mountain foothills and valley bottoms to avoid snow at higher elevations. The hunt areas in our study were selected because their annual elk densities, wolf numbers and brucellosis seroprevalence in elk spanned the range of values found across the broader GYA region. Elk densities ranged from 0·2 to 3·0 elk km−2 [Wyoming Game and Fish Department (WGFD) (2011)], wolf numbers ranged from 0 to 18 wolves per year (USFWS et al. 2011), and brucellosis seroprevalence ranged from 0 to 25% (Cross et al. 2010; Scurlock & Edwards 2010). Our study area did not contain feedgrounds where elk are supplementally fed during the winter.
Figure 1.
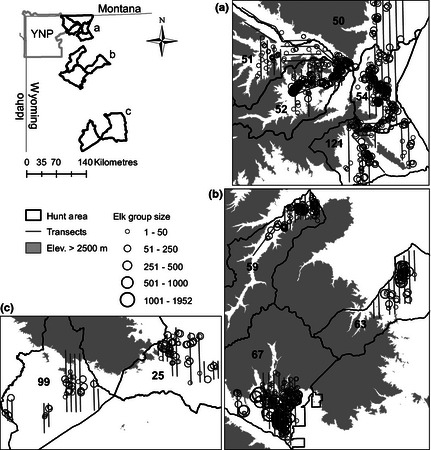
Map of the 10 elk hunt areas, aerial survey transects and elk groups. Hunt areas are labelled as 50, 51, 52, 54, 121, 59, 63, 67, 25 and 99. Panels a–c correspond to labelled areas in the upper left map. YNP, Yellowstone National Park; Elev, elevation.
The 10 hunt areas ranged in size from 350 to 2600 km2 with elevations of roughly 1200–4000 m. Land ownership was a mixture of private, state, Bureau of Land Management (BLM) and US Forest Service, including two national forests and three wilderness areas. There were also four wildlife habitat management areas (WHMAs) and one BLM winter range closure that were closed to human traffic for most of the study (closed 1 December–15 May). Only three hunt areas (67, 54 and 52) in our study contained management closures.
Elk are the preferred prey of wolves in the region (Smith et al. 2004) and may also be preferred by mountain lion Puma concolor in some areas of the GYA (Elbroch et al. 2013), but to our knowledge, there are no estimates of mountain lion densities in our study area. Other predators are black bear Ursus americanus, grizzly bear Ursus arctos horribilis and human hunters. However, bears rarely hunt adult elk and hibernate throughout most of the study period; also during our study, there were no hunting seasons later than December.
Elk group size
Within the 10 hunt areas, we recorded elk group sizes and locations from fixed‐wing aerial surveys during each month of the study. The surveys were conducted over fixed transects with 1‐km viewing widths and an above‐ground level of approximately 240 m, and were restricted to predetermined elk winter range within each hunt area to reduce flying time and avoid areas with very few elk. We defined these winter ranges as the area containing all elk sightings recorded by the WGFD during the months of January–May, 2005–2009. The methods used to conduct aerial surveys, identify group locations and assess sightability bias are outlined in Appendix S1 in Supporting Information.
Explanatory variables
We used group locations and data layers in a GIS to obtain values of landscape and habitat explanatory variables at one of three scales: fine (group scale), medium (buffer scale) and coarse (hunt area scale). The finest scale refers to variables extracted from a 30 × 30 m pixel at the centre of each elk group (fine scale = 0·0009 km2). The medium scale refers to variables estimated within a circular buffer with a 500‐m radius around the centre of each group (medium scale = 0·78 km2), and the coarsest scale refers to variables estimated for each hunt area (coarse scale average = 1107 km2).
To examine the effects of land management on elk group size, we used land ownership data (BLM 2012; WGFD 2012) to classify the centre of each group as being located on private land, public land or management closure. We used spatial irrigation data (WWDO 2007) to classify groups as located on irrigated or non‐irrigated land and confirmed this assignment using National Agriculture Imagery Program aerial imagery (USDA 2009), changing assignment where necessary (two groups were reassigned to irrigated land in this process). Also at the group scale, we obtained elevation (m) and slope of the landscape (degrees) from a 30‐m digital elevation model (DEM) of the study area, and we calculated linear distance to the nearest maintained road (km) from road locations obtained from the Wyoming Geographic Information Science Center.
At the buffer scale, we extracted variables of land‐cover class diversity and habitat openness by reclassifying 2011 30‐m National GAP Land Cover data (USGS‐GAP 2010) into 12 land‐cover classes representing major vegetation types (e.g. grassland meadows, mixed forest) and three ‘other’ classes (developed land, water and rock). With these 15 classes, we constructed an index of habitat diversity by summing the number of classes found in each buffer (similar to the vegetation richness variable used in Boyce, Mao & Merrill 2003). We further reclassified the 15 classes into open, closed and mixed habitat types and then constructed a measure of habitat openness by calculating the proportion of open habitat within each buffer (Boyce, Mao & Merrill 2003).
Finally, at the hunt area scale, we obtained measurements of winter severity, winter elk density and wolf abundance. For winter severity, we averaged daily snow water equivalents (SWE) in centimetre recorded from 1 January through 30 May from the one or two SNOTEL stations nearest to the hunt area for each year of the study (average distance between hunt areas and nearest SNOTEL = 13 km; range = 0–27 km). We used two stations only if their distances to the hunt area differed by less than 2 km, and we used average daily SWE because SWE has been shown to be a good predictor of snow effects on ungulate movement (Farnes, Heydon & Hansen 1999) and behaviour (Liley & Creel 2007).
We calculated winter range elk density per hunt area using the most recent aerial elk trend counts up to 2011, divided by winter range area. Elk trend counts are population counts conducted within each hunt area by WGFD from fixed‐wing aircraft or helicopters, usually between January and March after recent snowfall (WGFD 2011). We did not calculate winter elk density for each year of our study because trend counts were not obtained every year.
We calculated the number of wolves thought to have used each hunt area, using December wolf pack size and home range estimates for 2009, 2010 and 2011 (USFWS et al. 2011). For each year, we calculated the percentage of each wolf pack's home range that overlapped each hunt area, multiplied the percentage overlap by pack size and summed across packs. We then averaged across years to get average annual wolf abundance for each hunt area, because estimates of annual abundance were not independent (i.e. 2011 wolf abundance depended on 2010 abundance).
Statistical analysis
We predicted that elk group sizes would be (i) larger on private land and management closures than on public land; (ii) larger on irrigated land; (iii) negatively related to slope of the landscape, habitat diversity and snowpack; and (iv) positively related to habitat openness, elk density, wolf abundance and distance to maintained roads. We evaluated these predictions at the 0·10, 0·20,…, 0·90 quantiles using linear quantile regression models of elk group size (response variable) and four specific subsets of the group‐, buffer‐, and hunt area‐scale explanatory variables (Table 1). These subsets allowed us to test certain relationships while controlling for other variables.
Table 1.
List of linear quantile regression models of elk group size
| Model | Explanatory variables |
|---|---|
| 1 | Land + Road + Slope + Open + Habitat + HA |
| 2 | Irrigated + Density + Winter |
| 3 | Density + Winter |
| 4 | Winter + Density + Wolf × Open |
| 5 | Wolf × Land + Open + Elevation |
Land, public, private or management closure; Road, distance to road (km); Slope, slope of landscape (degrees); Open, habitat openness; Habitat, habitat diversity; HA, hunt area; Irrigated, irrigated vs. non‐irrigated land; Density, winter elk density (elk km−2); Winter, average daily snow water equivalents (cm); Wolf, average wolf abundance. Unit of elevation was m. 0·10, 0·20,…, 0·90 linear quantile relationships were examined for all models.
We included hunt area as a categorical explanatory variable in model 1 to account for dependence among groups recorded in the same hunt area. Models 2–5, however, included hunt area‐scale covariates, and therefore, we did not explicitly include hunt area to avoid collinearity effects. We also did not examine hunt area as a random effect in this case, because hunt areas in our study were not a random sample of management units across the GYA. Thus, for these models, we assumed hunt area differences were largely captured by the hunt area‐scale covariates (see Fig. S1), but we acknowledge that there may be residual dependence among group sizes from the same hunt area. To assess sensitivity of coefficient estimates to hunt area, we removed each hunt area, one at a time, from the 0·90 quantile regression analysis (i.e. dropped all data from a hunt area, then analysed the remaining nine hunt areas).
We did not account for temporal correlation in group sizes recorded from 1 month to the next because elk group membership is relatively fluid over the course of several days (Cross et al. 2013). We also did not use negative binomial regression because not all subsets of the data fit a negative binomial distribution. As quantile regression does not assume normally distributed errors, log transformations to normalize the group size data were unnecessary. Moreover, we did not fit models to log group size because we expected additive rather than multiplicative effects.
Prior to running the models, we centred covariates (except land management, irrigation and hunt area) by subtracting their average values. We examined relationships among covariates using pairwise scatterplots and Pearson's correlation coefficient to quantify correlation for linear relationships, and based on this, estimated collinearity among variables was relatively low (Table S1). We conducted all analyses using R environment for statistical computation (R Core Development Team 2013) with the quantreg package version 5.05 for linear quantile regression and bootstrapping to obtain 95% confidence intervals for estimated coefficients (Koenker 2013; example code provided in Appendix S2).
Results
We recorded 1263 elk groups ranging in size from 1 to 1952 elk, with the largest groups in hunt areas 67 and 63 (Fig. 1). Group size distributions for each hunt area were right‐skewed, as expected (Fig. S2), with median (0·50 quantile) and 0·90 quantile group sizes ranging from 6 to 51 elk and from 34 to 385 elk, respectively. We classified few groups on irrigated land (n = 18), and more groups on public land (n = 644) than on private land (n = 454) or management closures (n = 165). See Fig. S1 for comparison of hunt area‐scale variables and Table S2 for the range of all covariate values.
Quantile regression
As expected, most quantile group sizes from models 1 and 2 were larger on private land and management closures (than on public land), larger on irrigated land (than on non‐irrigated), positively related to habitat openness, and negatively related to habitat diversity, slope of the landscape and winter severity, while holding other covariates fixed (Figs 2 and 3). Coefficient estimates for distance to road were near zero for all quantile group sizes, but uncertainty was high at upper quantiles (Fig. S3). Uncertainty was high at upper quantiles for other variables as well (Figs 2 and 3), but this was expected due to the larger sampling variation in the tails of the group size distributions (Cade & Noon 2003). Differences between irrigated and non‐irrigated land caused the largest effect on group size (while holding winter severity and winter elk density constant). For this model, median and 0·90 quantile group sizes were estimated to be larger on irrigated land by 61 elk (95% CI = 6, 116) and 135 elk (95% CI = 42, 227), respectively.
Figure 2.
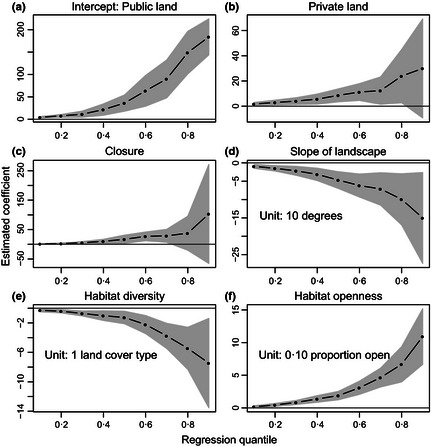
Estimated coefficients from model 1 for each quantile of interest. Panel a shows the estimated group size for each quantile on public land, at average values of the other covariates. In panels b and c, coefficients describe the estimated change in group size between private and public land and between management closures and public land, respectively, at average values of the other covariates. In panels d–f, coefficients describe the estimated rate of change in group size for every unit change in the explanatory variable, while holding all other variables constant. Shaded area indicates bootstrapped 95% confidence intervals.
Figure 3.
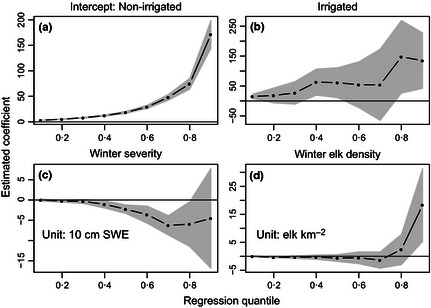
Estimated coefficients from model 2 for each quantile of interest. Panel a shows the estimated group size for each quantile on non‐irrigated land, at average values of the other covariates. In panel b, coefficients describe the estimated change in group size between irrigated and non‐irrigated land, at average values of the other covariates. In panels c–d, coefficients describe the estimated rate of change in group size for every unit change in the explanatory variable, while holding the other variables constant. Shaded area indicates bootstrapped 95% confidence intervals. SWE, snow water equivalents.
Estimated coefficients for winter elk density from models 2 and 3 were near zero for all but the 0·90 quantiles (Fig. 3 and S4). For both models, 0·90 quantile group sizes were estimated to increase by 18 elk (95% CI = 4, 32) for every 1 elk km−2 increase in winter elk density, while holding the other variables constant. These coefficients changed sign in model 4 (Fig. S5), probably because winter elk density and wolf abundance were moderately collinear (r = 0·78; Table S1).
Estimated coefficients for wolf abundance and the wolf by openness interaction term in model 4 were near zero for median and lower quantile group sizes, but estimates for upper quantile group sizes suggest that in open habitat larger elk groups increased in size with increasing broad‐scale wolf abundance (Figs 4 and 5). These coefficients were estimated while holding winter elk density and winter severity constant. Inferences regarding effects of wolf abundance were not affected by removal of the interaction term from the model.
Figure 4.
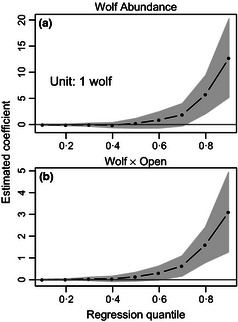
Estimated coefficients for wolf covariates from model 4 for each quantile of interest. Other coefficients from this model are shown in Fig. S4. Coefficients in panel a describe the estimated rate of change in group size for every unit change in wolf abundance, while holding the other variables constant. In panel b, coefficients describe the estimated rate of change in the coefficient for wolf abundance for every 0·10 increase in the proportion of habitat openness. Shaded area indicates bootstrapped 95% confidence intervals.
Figure 5.
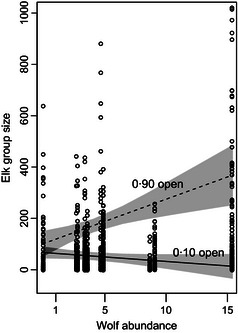
Relationships between 0·90 quantile group sizes and wolf abundance in open and closed habitats. Shaded area indicates 95% confidence intervals. Along the x‐axis, group size data are clustered by hunt area. From left to right, hunt areas are 25 (far left), 99, 121, 54, 59, 63, 52, 51, 50 and 67 (far right).
Similarly for the wolf by land management interaction term in model 5, estimated coefficients were near zero for median and lower quantile group sizes, while estimates for upper quantile group sizes suggest that on private land larger elk groups increased in size with increasing broad‐scale wolf abundance (Fig. 6 and S6). This interaction term was estimated while holding habitat openness and elevation constant.
Figure 6.
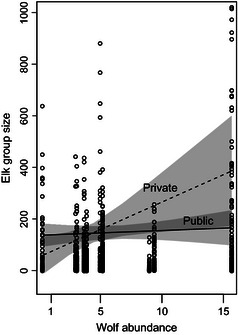
Relationships between 0·90 quantile group sizes and wolf abundance on private and public land. Shaded area indicates 95% confidence intervals. Along the x‐axis, group size data are clustered by hunt area. From left to right, hunt areas are 25 (far left), 99, 121, 54, 59, 63, 52, 51, 50 and 67 (far right).
Evidence from the tests of sensitivity to hunt area suggest that effects of winter elk density, wolf abundance and the wolf by openness interaction on 0·90 quantile group sizes were influenced by high elk densities, high wolf numbers and large elk groups in hunt area 67. These tests also suggest that effects of irrigation and the wolf by private land interaction were moderately influenced by data obtained from hunt area 50 (Fig. S7).
Discussion
Across 10 elk winter ranges in western Wyoming, we found that most quantiles of the elk group size distribution were related to land management type, irrigation, habitat covariates and winter severity, but that the magnitude of these relationships was often greater for upper quantile group sizes (Figs 2 and 3). Though this may be expected for right‐skewed distributions, the practical implications of large elk groups getting larger may be increases in the prevalence of brucellosis in elk, a greater number of brucellosis outbreaks in livestock and a higher frequency of landowner conflicts (due to crop damage, or predators concentrating near homes and livestock). Reducing or dispersing large elk groups may address these issues, and therefore, we evaluated relationships with upper quantile group sizes to understand how (e.g. harvest or habitat enhancements) or where (e.g. private or public land) management would have the greatest impact on large elk groups.
We provide evidence that most quantiles of group size were larger on private property and management closures, and substantially larger on irrigated land (Figs 2 and 3). Elk may aggregate on private land to avoid hunters on public land (Burcham, Edge & Marcum 1999), and as a result, these elk may be largely out of management control (Haggerty & Travis 2006). Therefore, communicating the importance of hunting on private land (for direct removal and dispersal of individuals from these properties) and creating incentives for private landowners to allow hunting could help to reduce the number of private land refuges, and in turn reduce large group sizes where these groups have negative impacts. We found that large elk groups were larger on irrigated land, and though we found few groups (n = 18) on irrigation overall, they may contribute disproportionately to crop depredation and inter and intraspecific disease transmission. Also, as irrigated land covered only 101 km2 across our study area, irrigation could be more important to elk in other regions where it is more common. As for management closures, hunting is permitted during the regular hunting season, but during the brucellosis transmission period (February–May), closures are not subject to late hunts or other human‐related activities that could disperse large elk groups and reduce intraspecific infectious contacts. Opening these areas to the public earlier in the spring (e.g. mid‐April rather than mid‐May) could help to disperse individuals during the riskiest period for transmission (Cross et al. 2015), but it could also increase the risk of elk‐to‐cattle brucellosis transmission if elk move from closures to private land. Careful monitoring would be necessary to determine the effects of changing closure dates and to limit elk–cattle comingling.
We also provide evidence that only upper quantile group sizes were positively related to winter elk density, wolf abundance, and the wolf by openness and wolf by private land interactions (Figs 3, 4, 5, 6). This suggests that if we focused solely on median quantiles, we would have mistakenly concluded that elk group size was not associated with these variables. It also suggests that upper quantile group sizes could be reduced by reducing elk and wolf numbers. We caution, however, that by measuring wolves at broad spatial and temporal scales, we were unable to assess whether elk group sizes responded to wolf abundance (e.g. elk formed larger groups to dilute predation risk) or wolf abundance responded to elk group sizes (e.g. wolf numbers increased where there were more elk). If the latter process occurred, reducing wolf numbers could have little effect on elk group sizes. Studies conducted at finer scales could help to elucidate the relative importance of these relationships in our study area, because other finer‐scale studies have shown that elk group size directly responds to variation in predation risk from wolves (Creel & Winnie 2005).
The relationship between upper quantile group sizes and broad‐scale wolf abundance also likely depends on habitat openness and land management type. In mostly open habitats, the 90th quantile group size was estimated to increase by roughly 17 elk with every one wolf increase in wolf abundance (Fig. 5). In this case, elk may form larger groups in open habitats to dilute predation risk (Hamilton 1971) or increase their ability to detect or deter predators (Pulliam 1973). We point out that the coefficients for wolf abundance, wolf by openness interaction and winter elk density were influenced by high wolf and elk numbers, and large elk groups in hunt area 67 (Figs. S7). Though this is important to note in our study, this area has attributes that are not unusual elsewhere in the region. In fact, the Gardner Basin and Madison Valley areas in the northern GYA also have high wolf numbers, wintering group sizes in excess of 1000 elk, and widely open habitats (personal communication, Montana Fish Wildlife and Parks; Proffitt et al. 2015), like hunt area 67. Therefore, these, and similar, elk management units may be areas to focus on for brucellosis surveillance and implementation of late elk hunts to reduce and disperse animals during the brucellosis transmission period.
On private land, the 90th quantile group size was estimated to increase by roughly 20 elk with every one wolf increase in broad‐scale wolf abundance (Fig. 6). As an explanation, we suggested that wolves use private land more than public land in the winter to target elk seeking refuge from hunters. In this case, elk on private land may form larger groups to dilute predation risk, and management should work towards incentivizing hunting on private land to reduce elk numbers and disperse individuals. Alternatively, however, wolves may be avoiding private land because there is a high risk of persecution and mortality in these areas. Wolves have been shown to avoid heavily used roads and human activity (Hebblewhite & Merrill 2008; Theuerkauf et al. 2010; Nelson et al. 2012), and thus, human use may create areas of refuge from wolf predation (Hebblewhite et al. 2005; Hebblewhite & Merrill 2007). Therefore, elk may aggregate on private land to avoid hunters and wolves (but this requires further study at finer spatial and temporal scales to understand how private land alters wolf behaviour), and working with landowners to build tolerance to hunters and wolves could reduce the extent of predation refugia and number of large elk groups.
Others have suggested reducing elk densities to reduce group sizes and brucellosis seroprevalence in elk, but they predict that this may be effective only with substantial reductions in density (Proffitt et al. 2015). In our study, the 90th quantile group size was estimated to be 25% smaller in a hunt area with 4·5 elk km−2 compared to an area with 7·7 elk km−2. Reducing elk densities by this amount (roughly 40%) by removing animals is unrealistic given current elk management objectives and not likely to be socially acceptable. However, elk densities could be reduced using a combination of harvest, to remove and disperse animals, and creation of additional winter range through conservation easements and fee‐title purchases.
To our knowledge we are the first to show that upper quantile elk group sizes increased with increasing openness at higher rates than median group sizes (Fig. 2). Elk may form larger groups in open areas in response to predation risk, but also because individuals are connecting visually as they search for similar grazing opportunities (Gerard et al. 2002). Conversely, groups may disaggregate when landscape features break the line of sight between individuals. Thus, habitat enhancements on elk winter range could be used to break up groups or attract animals away from open grasslands, an approach similar to enhancement projects used to draw elk away from supplemental feeding areas (Clause et al. 2002). We also provide some evidence that elk group sizes were larger in less severe winters (Fig. 3), suggesting that climate change may increase the size and frequency of large elk groups.
In conclusion, we were able to evaluate relationships with upper quantile elk group sizes and highlight potential management strategies to target these groups, such as incentivizing hunting on private land during the regular and late hunting seasons, promoting tolerance of wolves on private land (if elk aggregate in these areas to avoid wolves) and creating more winter range and varied habitats. With this analysis, extreme quantiles may be based on sparsely distributed data, and therefore, we caution that these relationships may be data set‐dependent. Additionally, estimated coefficients differed by quantile, and so examining any one quantile in isolation could be misleading regarding inferences across the group size distribution. Therefore, our study highlights the importance of focusing on more than one part of the group size distribution to inform management and understand animal ecology.
Data accessibility
R script: uploaded as online supporting information. Group sizes and covariate values: DRYAD entry 10.5061/dryad.589p0 (Brennan, Cross & Creel 2015).
Supporting information
Fig. S1. Hunt area‐scale covariates.
Fig. S2. Frequency distributions of elk group sizes.
Fig. S3. Estimated coefficients for distance to road.
Fig. S4. Estimated coefficients from model 3.
Fig. S5. Estimated coefficients for remaining covariates from model 4.
Fig. S6. Estimated coefficients from model 5.
Fig. S7. Tests of sensitivity to hunt area.
Table S1. Correlation matrix of explanatory variables.
Table S2. Range of covariate values.
Appendix S1. Methods used to conduct aerial surveys, identify elk group locations, and assess sightability bias.
Appendix S2. Example R code of a quantile regression model.
Acknowledgements
We are grateful to pilots D. Stinson, K. Overfield and S. Ard, and our technician C. Butler. We thank M. Higgs and B. Scurlock for commenting on previous drafts, and we thank the two anonymous reviewers. This work was supported by the National Science Foundation and National Institutes of Health Ecology of Infectious Disease (grant number DEB‐1067129) and the US Geological Survey. Any mention of trade, product or firm names is for descriptive purposes only and does not imply endorsement by the US Government.
References
- Beja‐Pereira, A. , Bricker, B. , Chen, S. , Almendra, C. , White, P.J. & Luikart, G. (2009) DNA genotyping suggests that recent brucellosis outbreaks in the Greater Yellowstone Area originated from elk. Journal of Wildlife Diseases, 45, 1174–1177. [DOI] [PubMed] [Google Scholar]
- BLM (Bureau of Land Management) . (2012) Wyoming surface and mineral status. Available: http://www.blm.gov/wy/st/en/resources/public_room/gis/datagis/state/state-own.html. Accessed: 01 February 2012.
- Boyce, M.S. , Mao, J.S. & Merrill, E.H. (2003) Scale and heterogeneity in habitat selection by elk in Yellowstone National Park. Ecoscience, 10, 421–431. [Google Scholar]
- Bradley, E.H. & Pletscher, D.H. (2005) Assessing factors related to wolf depredation of cattle in fenced pastures in Montana and Idaho. Wildlife Society Bulletin, 33, 1256–1265. [Google Scholar]
- Brennan, A. , Cross, P.C. & Creel, S. (2015) Data from: managing more than the mean: using quantile regression to identify factors related to large elk groups. Dryad Digital Repository, 10.5061/dryad.589p0. [DOI] [PMC free article] [PubMed] [Google Scholar]
- Brennan, A. , Cross, P.C. , Higgs, M. , Edwards, W.H. , Scurlock, B.M. & Creel, S. (2014) A multi‐scale assessment of animal aggregation patterns to understand increasing pathogen seroprevalence. Ecosphere, 5, 1–16. [Google Scholar]
- Burcham, M. , Edge, W.D. & Marcum, C.L. (1999) Elk use of private land refuges. Wildlife Society Bulletin, 27, 833–839. [Google Scholar]
- Cade, B.S. & Noon, B.R. (2003) A gentle introduction to quantile regression for ecologists. Frontiers in Ecology and the Environment, 1, 412–420. [Google Scholar]
- Cade, B.S. , Terrell, J.W. & Schroeder, R.L. (1999) Estimating effects of limiting factors with regression quantiles. Ecology, 80, 311–323. [Google Scholar]
- Clause, D. , Kilpatrick, S. , Dean, R. & Smith, B. (2002) Brucellosis‐feedground‐habitat program: an integrated approach to brucellosis in elk in Wyoming Brucellosis in Elk and Bison in the Greater Yellowstone Area (ed. Kreeger T.J.), pp. 80–96. Wyoming Game and Fish Department, Cheyenne, WY. [Google Scholar]
- Creel, S. & Winnie, J.A. (2005) Responses of elk herd size to fine‐scale spatial and temporal variation in the risk of predation by wolves. Animal Behaviour, 69, 1181–1189. [Google Scholar]
- Cross, P.C. , Cole, E.K. , Dobson, A.P. , Edwards, W.H. , Hamlin, K.L. , Luikart, G. , Middleton, A.D. , Scurlock, B.M. & White, P.J. (2010) Probable causes of increasing brucellosis in free‐ranging elk of the Greater Yellowstone Ecosystem. Ecological Applications, 20, 278–288. [DOI] [PubMed] [Google Scholar]
- Cross, P.C. , Creech, T.G. , Ebinger, M.R. , Manlove, K. , Irvine, K. , Henningsen, J. , Rogerson, J. , Scurlock, B.M. & Creel, S. (2013) Female elk contacts are neither frequency nor density dependent. Ecology, 94, 2076–2086. [DOI] [PubMed] [Google Scholar]
- Cross, P.C. , Maichak, E.J. , Rogerson, J.D. , Irvine, K.M. , Jones, J.D. , Heisey, D.M. , Edwards, W.H. & Scurlock, B.M. (2015) Estimating the phenology of elk brucellosis transmission with hierarchical models of cause‐specific and baseline hazards. Journal of Wildlife Management, 79, 739–748. [Google Scholar]
- Elbroch, L.M. , Lendrum, P.E. , Newby, J. , Quigley, H. & Craighead, D. (2013) Seasonal foraging ecology of non‐migratory cougars in a system with migrating prey. PLoS ONE, 8, e83375. [DOI] [PMC free article] [PubMed] [Google Scholar]
- Farnes, P. , Heydon, C. & Hansen, K. (1999) Snowpack Distribution across Yellowstone National Park. Montana State University, Bozeman, MT. [Google Scholar]
- Fortin, D. , Beyer, H.L. , Boyce, M.S. & Smith, D.W. (2005) Wolves influence elk movements: behavior shapes a trophic cascade in Yellowstone National Park. Ecology, 86, 1320–1330. [Google Scholar]
- Gerard, J. , Bideau, E. , Maublanc, M. , Loisel, P. & Marchal, C. (2002) Herd size in large herbivores: encoded in the individual or emergent? Biological Bulletin, 202, 275–282. [DOI] [PubMed] [Google Scholar]
- Gower, C.N. , Garrott, R.A. , White, P.J. , Cherry, S. & Yoccoz, N. (2009) Elk group size and predation: a flexible strategy when faced with variable risk The Ecology of Large Mammals in Central Yellowstone: Sixteen Years of Integrated Field Studies (eds Garrott R.A., White P.J. & Watson F.G.R.), pp. 401–422. Academic Press, San Diego, CA. [Google Scholar]
- Haggerty, J.H. & Travis, W.R. (2006) Out of administrative control: absentee owners, resident elk and the shifting nature of wildlife management in southwestern Montana. Geoforum, 37, 816–830. [Google Scholar]
- Hamilton, W.D. (1971) Geometry for the selfish herd. Journal of Theoretical Biology, 31, 295–311. [DOI] [PubMed] [Google Scholar]
- Hebblewhite, M. & Merrill, E.H. (2007) Multiscale wolf predation risk for elk: does migration reduce risk? Oecologia, 152, 377–387. [DOI] [PubMed] [Google Scholar]
- Hebblewhite, M. & Merrill, E. (2008) Modelling wildlife‐human relationships for social species with mixed‐effects resource selection models. Journal of Applied Ecology, 45, 834–844. [Google Scholar]
- Hebblewhite, M. , White, C.A. , Nietvelt, C.G. , McKenzie, J.A. , Hurd, T.E. , Fryxell, J.M. , Bayley, S.E. & Paquet, P.C. (2005) Human activity mediates a trophic cascade caused by wolves. Ecology, 86, 2135–2144. [Google Scholar]
- Koenker, R. (2013) quantreg: Quantile Regression. R Package Version 5.05. Available: http://CRAN.R-project.org/package=quantreg. Accessed: 01 June 2013 [Google Scholar]
- Koenker, R. & Bassett, G.J. (1978) Regression quantiles. Econometrica, 46, 33–50. [Google Scholar]
- Krause, J. & Ruxton, G.D. (2002) Living in Groups. Oxford University Press, Oxford. [Google Scholar]
- Liley, S. & Creel, S. (2007) What best explains vigilance in elk: characteristics of prey, predators, or the environment? Behavioral Ecology, 19, 245–254. [Google Scholar]
- McNaughton, S. (1984) Grazing lawns: animals in herds, plant form, and coevolution. American Naturalist, 124, 863–886. [Google Scholar]
- Nelson, A. , Kauffman, M.J. , Middleton, A.D. , Jimenez, M. , McWhirter, D. , Barber, J. & Gerow, K. (2012) Elk migration patterns and human activity influence wolf habitat use in the Greater Yellowstone Ecosystem. Ecological Applications, 22, 2293–2307. [DOI] [PubMed] [Google Scholar]
- Parrish, J.K. & Edelstein‐keshet, L. (1999) Complexity, pattern and evolutionary trade‐offs in animal aggregation. Science, 284, 99–101. [DOI] [PubMed] [Google Scholar]
- Proffitt, K.M. , Grigg, J.L. , Hamlin, K.L. & Garrott, R.A. (2009) Contrasting effects of wolves and human hunters on elk behavioral responses to predation risk. Journal of Wildlife Management, 73, 345–356. [Google Scholar]
- Proffitt, K.M. , Gude, J.A. , Shamhart, J. & King, F. (2012) Variations in elk aggregation patterns across a range of elk population sizes at Wall Creek, Montana. Journal of Wildlife Management, 76, 847–856. [Google Scholar]
- Proffitt, K.M. , Anderson, N. , Lukacs, P. , Riordan, M.M. , Gude, J.A. & Shamhart, J. (2015) Effects of elk density on elk aggregation patterns and exposure to brucellosis. Journal of Wildlife Management, 79, 373–383. [Google Scholar]
- Pulliam, H. (1973) On the advantages of flocking. Journal of Theoretical Biology, 38, 419–422. [DOI] [PubMed] [Google Scholar]
- R Core Development Team . (2013) R: A Language and Environment for Statistical Computing. R Foundation for Statistical Computing, Vienna, Austria. [Google Scholar]
- Reiczigel, J. , Lang, Z. , Rózsa, L. & Tóthmérész, B. (2008) Measures of sociality: two different views of group size. Animal Behaviour, 75, 715–721. [Google Scholar]
- Roffe, T.J. , Jones, L.C. , Coffin, K. , Drew, M.L. , Sweeney, S.J. , Hagius, S.D. , Elzer, P.H. & Davis, D. (2004) Efficacy of single calfhood vaccination of elk with Brucella abortus strain 19. Journal of Wildlife Management, 68, 830–836. [Google Scholar]
- Scurlock, B.M. & Edwards, W.H. (2010) Status of brucellosis in free‐ranging elk and bison in Wyoming. Journal of Wildllife Diseases, 46, 442–449. [DOI] [PubMed] [Google Scholar]
- Smith, D.W. , Drummer, T.D. , Murphy, K.M. , Guernsey, D.S. & Evans, S.B. (2004) Winter prey selection and estimation of wolf kill rates in Yellowstone National Park, 1995–2000. Journal of Wildlife Management, 68, 153–166. [Google Scholar]
- Theuerkauf, J. , Jȩdrzejewski, W. , Schmidt, K. & Gula, R. (2010) Spatiotemporal Segregation of Wolves segregation from humans in the Bialowieza. Journal of Wildlife Management, 67, 706–716. [Google Scholar]
- USDA (U.S. Department of Agriculture) . (2009) National Agriculture Imagery Program: Aerial imagery for Wyoming. Available: http://datagateway.nrcs.usda.gov/. Accessed: 01 February 2012.
- USFWS (U.S. Fish and Wildlife Service), Montana Fish Wildlife & Parks, Nez Perce, National Park Service, Blackfeet Nation, Confederated Salish and Kootenai Tribes, Wind River Tribes, Washington Department of Wildlife, Oregon Department of Wildlife, Utah Department of Natural Resources & U.S. Department of Agriculture Wildlife Services. (2011) Rocky Mountain Wolf Recovery 2010 Interagency Annual Report. Helena, MT.
- USGS‐GAP (U.S. Geological Survey‐GAP Analysis Program). (2010) National GAP Land Cover, Version 1. Available: http://gapanalysis.usgs.gov. Accessed: 01 February 2012.
- WGFD (Wyoming Game and Fish Department) . (2011) Annual Big Game Job Completion Reports. Cheyenne, WY.
- WGFD (Wyoming Game and Fish Department) . (2012) Wildlife habitat management areas. Available: https://wgfd.wyo.gov/accessto/whmas.asp. Accessed: 01 February 2012.
- Wilmers, C.C. & Levi, T. (2013) Do irrigation and predator control reduce the productivity of migratory ungulate herds? Ecology, 94, 1264–1270. [DOI] [PubMed] [Google Scholar]
- WWDO (Wyoming Water Development Office) . (2007) Wyoming irrigated land data. Available: http://waterplan.state.wy.us/plan/statewide/gis/gis.html. Accessed: 01 February 2012.
Associated Data
This section collects any data citations, data availability statements, or supplementary materials included in this article.
Supplementary Materials
Fig. S1. Hunt area‐scale covariates.
Fig. S2. Frequency distributions of elk group sizes.
Fig. S3. Estimated coefficients for distance to road.
Fig. S4. Estimated coefficients from model 3.
Fig. S5. Estimated coefficients for remaining covariates from model 4.
Fig. S6. Estimated coefficients from model 5.
Fig. S7. Tests of sensitivity to hunt area.
Table S1. Correlation matrix of explanatory variables.
Table S2. Range of covariate values.
Appendix S1. Methods used to conduct aerial surveys, identify elk group locations, and assess sightability bias.
Appendix S2. Example R code of a quantile regression model.
Data Availability Statement
R script: uploaded as online supporting information. Group sizes and covariate values: DRYAD entry 10.5061/dryad.589p0 (Brennan, Cross & Creel 2015).