Summary
The Clinical Proteomic Tumor Analysis Consortium (CPTAC) of the National Cancer Institute (NCI) has launched an Assay Portal (http://assays.cancer.gov) to serve as an open-source repository of well-characterized targeted proteomic assays. The portal is designed to curate and disseminate highly characterized, targeted mass spectrometry (MS)-based assays by providing detailed assay performance characterization data, standard operating procedures, and access to reagents. Assay content is accessed via the portal through queries to find assays targeting proteins associated with specific cellular pathways, protein complexes, or specific chromosomal regions. The position of the peptide analytes for which there are available assays are mapped relative to other features of interest in the protein, such as sequence domains, isoforms, single nucleotide polymorphisms, and post-translational modifications. The overarching goals are to enable robust quantification of all human proteins and to standardize the quantification of targeted MS-based assays to ultimately enable harmonization of results over time and across laboratories.
Keywords: multiple reaction monitoring, selected reaction monitoring, MRM, SRM, PRM, quantitative proteomics, targeted mass spectrometry, quantitative assay database, harmonization, standardization
1. Introduction
The CPTAC Assay Portal, developed in conjunction with the US National Cancer Institute (NCI) (http://assays.cancer.gov/), serves as a public repository of well-characterized, quantitative MS-based, targeted proteomic assays [1]. The goal of the CPTAC Assay Portal is to disseminate assays to the scientific community at-large, including standard operating protocols, reagents, and assay characterization data associated with targeted mass spectrometry-based assays. A primary aim of the portal is to facilitate the widespread adoption of targeted MS-based assays by bringing together clinicians or biologists and analytical chemists, enabling investigators to find assays to proteins relevant to their areas of interest, evaluate the performance of the assays, obtain information and materials pertinent to implementing assays in their own laboratories, and share characterization data from existing and newly-developed assays with the public.
There are several public databases containing lists or libraries of peptide analytes and transitions (e.g. SRMAtlas [2], PASSEL [3], GPMDB/MRM [4], QuAD [5], cancer peptide library [6]). The CPTAC Assay Portal distinguishes itself in that it contains characterization data to provide researchers with performance data for assays in real-world applications and matrices and provides standard operating protocols (SOPs) for download. In the context of the “Tiers” of targeted protein assays that were recently described [7], the experiments described in the portal are intended to provide preliminary validation data for assays to be used in Tier 2 applications.
This chapter details the structure and functions of the CPTAC Assay Portal, giving users instructions and guidelines for getting the most out of the portal. First, the overall structure is presented, followed by methods for utilizing the various features built into the portal. Finally, ongoing and future developments will be discussed.
2. Overview of portal pages and data structures
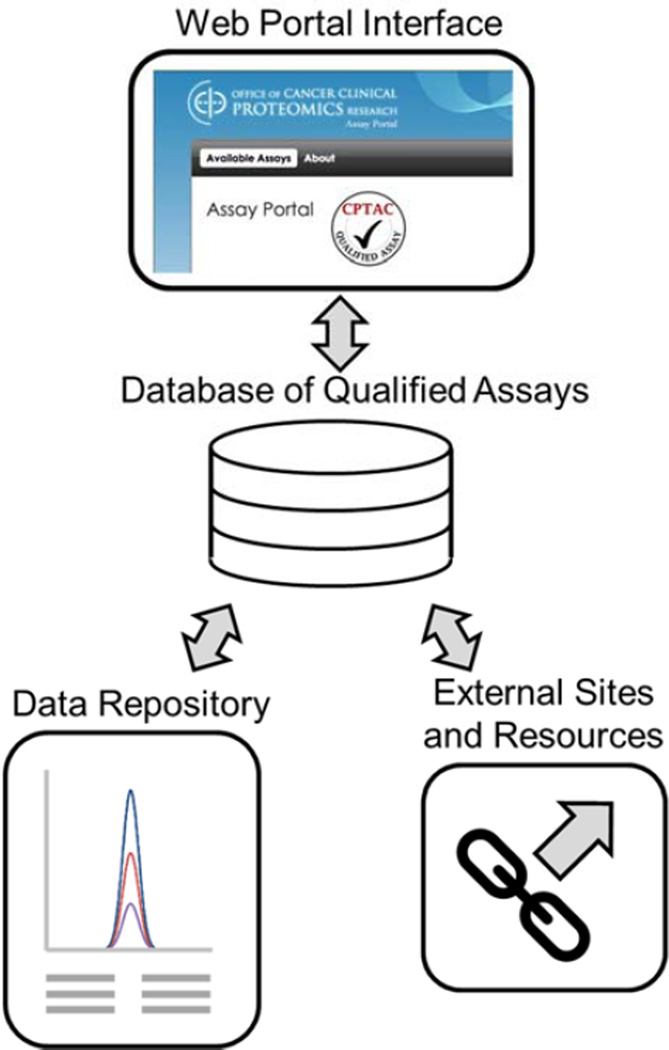
The overall structure of the portal is divided into four components (Fig. 1):
Database of qualified assays
Repository of characterization data and processing scripts
Links to external information and resources
Web-based interaction tool for exploring, visualization, and features
Figure 1.
The primary structure of the CPTAC Assay Portal consists of four elements: a database of qualified assays, a repository of targeted mass spectrometry data, links to external sites and resources, and a user interface for accessing records.
2.1 Assay Database
The database of qualified assays contains all information pertaining to characterized assays. Users interact with the database through the portal pages and the links provided therein. Upon addition to the database, each assay is assigned a unique identifying number (e.g. CPTAC-ID#). This number is used to reference specific assays within the portal and outside of the portal. For example, researchers using an assay from the portal in a publication are asked to reference the CPTAC-ID# in the Methods section of their manuscript. Information stored in the database is collected from three primary sources, i) a web-based metadata collection form, ii) a repository of characterization data (described below), and iii) links with external bioinformatics sites (also described below). The web-based metadata collection form is completed by contributing laboratories when uploading new assays. The form captures details that are displayed on the portal (e.g. instrument type, matrix type, method parameters, publications, etc.). In addition to capturing these experimental details, the metadata form allows users to upload detailed standard operating procedures (SOPs) into the database.
2.2 Repository of characterization data
Targeted mass spectrometry data are analyzed and manipulated via Skyline [8], an open-source tool for targeted proteomics experiments. Characterization data are stored in a vendor-neutral public repository called Panorama [9]. Panorama is an open-source repository server application for targeted proteomics that houses the assay data in the form of Skyline documents. Data in Panorama are organized using a directory structure. Each submitting laboratory has a folder. Within a laboratory, separate folders are made for different assay types, assays characterized in different matrices, or assays developed on different instruments. Within each assay type folder, subfolders are divided into assay characterization experiments. The subfolders for the assay characterization experiments contain the data files for a given assay. Note: these subfolders can contain data from multiple assays, given that the assays fit the characterized matrix, instrument, and assay type (i.e. the subfolder can contain multiple Skyline document uploads, but a peptide cannot be duplicated). The directory structure is designed as follows:
>Submitting Laboratory (ExampleU_PILab)

     >Matrix/Instrument/AssayType (CellLysate_Instrument_directMRM)

           >ResponseCurves

           >ValidationSamples

           >Selectivity

           >Stability

           >EndogenousAnalyte

           >ChromatogramLibrary
Customized data processing scripts implemented as Panorama plug-ins analyze the characterization data and produce the graphics and data tables that are displayed on the portal. The portal assay database interacts with Panorama to gather the images and information needed for display on the portal.
2.3 External links
The database also uses links to external sites to obtain information related to assays. Upon uploading assays, users are required to specify the target protein. This information is used by the database to collect information from several external bioinformatics websites. The portal uses bioDBnet [10] to collect biological information, as well as Uniprot, PhosphositePlus [11], KEGG, BioGRID, and GeneCards. The protein is also mapped to known pathways using KEGG and known protein-protein interactions through BioGRID. Finally, the chromosomal location is collected from GeneCards.
2.4 Web-based user interface
Information contained in the assay database is accessed through the portal user interface. The interface contains a main page which allows users to query and filter the available assays to identify interesting or desired targets. From there, users navigate to individual assay pages which describe in more detail the parameters associated with each assay, the validation data showing the performance of the assay, and downloadable content including raw data and SOPs. The following sections describe the features of the interface in more detail along with the methodology for using the interface.
3. Assay Portal features
There are four main views associated with the assay portal: the database access page, the protein information panel, the assay details and parameters panel, and the assay resources and comments section.
3.1 The database access page
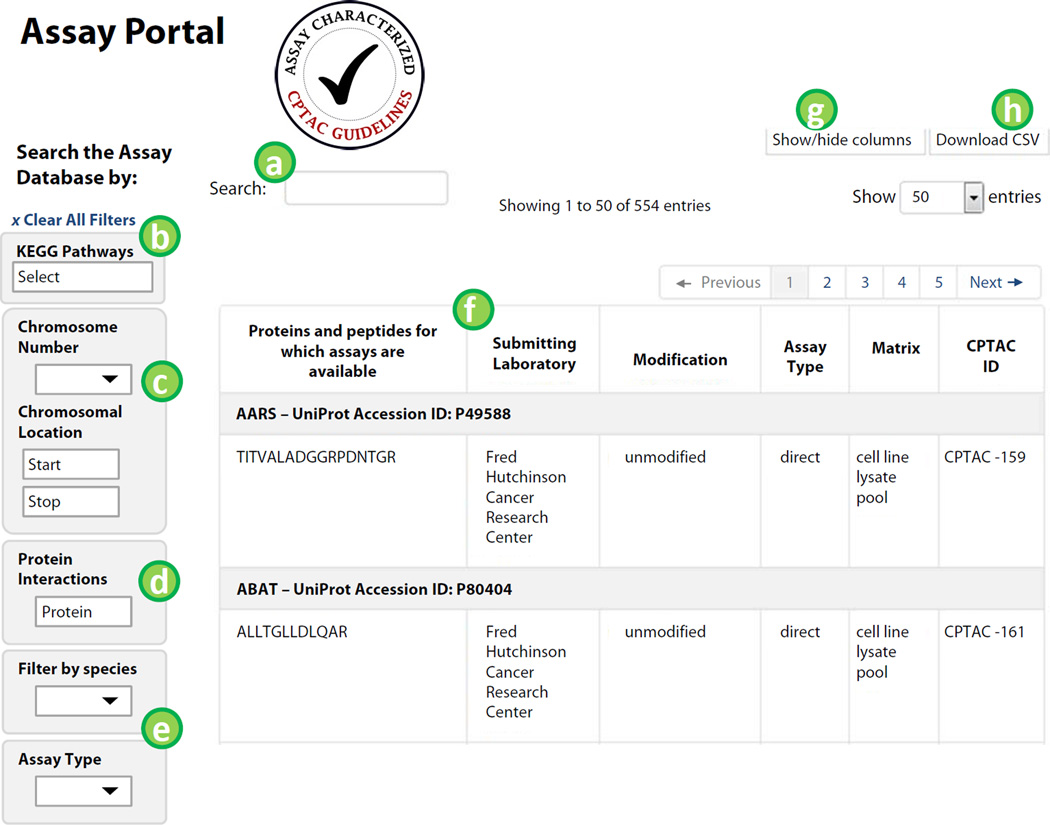
The database access page is the main page for browsing assays. It is designed to be friendly to a wide array of researchers, allowing users to search the database for relevant assays based on biological interests. Query features are built into the portal to allow biologists to query the database for available assays according to a set of criteria (e.g. pathway, protein complex, chromosomal location). The table view displays currently available entries in the portal database, and is updated according to the filters applied through the queries. Figure 2 is a modified screenshot of the database access page. Labels in Fig. 2 correspond to the following feature descriptions.
The “Search” bar, located above the table to the left, can be used to search for a specific gene symbol or peptide sequence, as well as searching for fields contained in the table.
To search for assays to proteins within a specific pathway, use the KEGG pathways search box. KEGG pathways are grouped by category and listed as a drop-down menu. Selecting a pathway will limit the display table to those proteins/peptides in the assay database mapping to the selection.
To search by chromosomal location, select the chromosome number and input the start and/or stop coordinates, as the number of base pairs from the pter or qter (terminus of the short arm or long arm, respectively).
To search for assays in the database to proteins that interact with a specific protein, enter the gene symbol of the desired protein in the interaction form on the left of the table. Protein-protein interactions are collected from BioGRID database.
Pull-down menus on the left of the table are also provided for filtering the data by species and assay type. Assay type refers to the combination of sample preparation (e.g. enrichment required, fraction required, or direct LC-MS) and data type used in characterizing the assays (e.g. MRM – multiple reaction monitoring, PRM – parallel reaction monitoring). For example, direct-MRM refers to targeted MRM-MS assays with no enrichment prior to analysis.
A table of available assays is displayed according to protein target. The displayed table will change as filters or searchers are applied. Selecting an assay from the table for browsing in more detail is performed by clicking a peptide sequence in the table.
The table view can be re-configured by selecting “Show/hide columns” in the upper right of the display table. Place a check next to fields you would like to display.
At any time, a table can be downloaded as a CSV file by selecting the “Download CSV” button.
Figure 2.
The database access page is the main landing page for the portal. Labels in the figure correspond to features described in the text.
3.2 The protein information panel
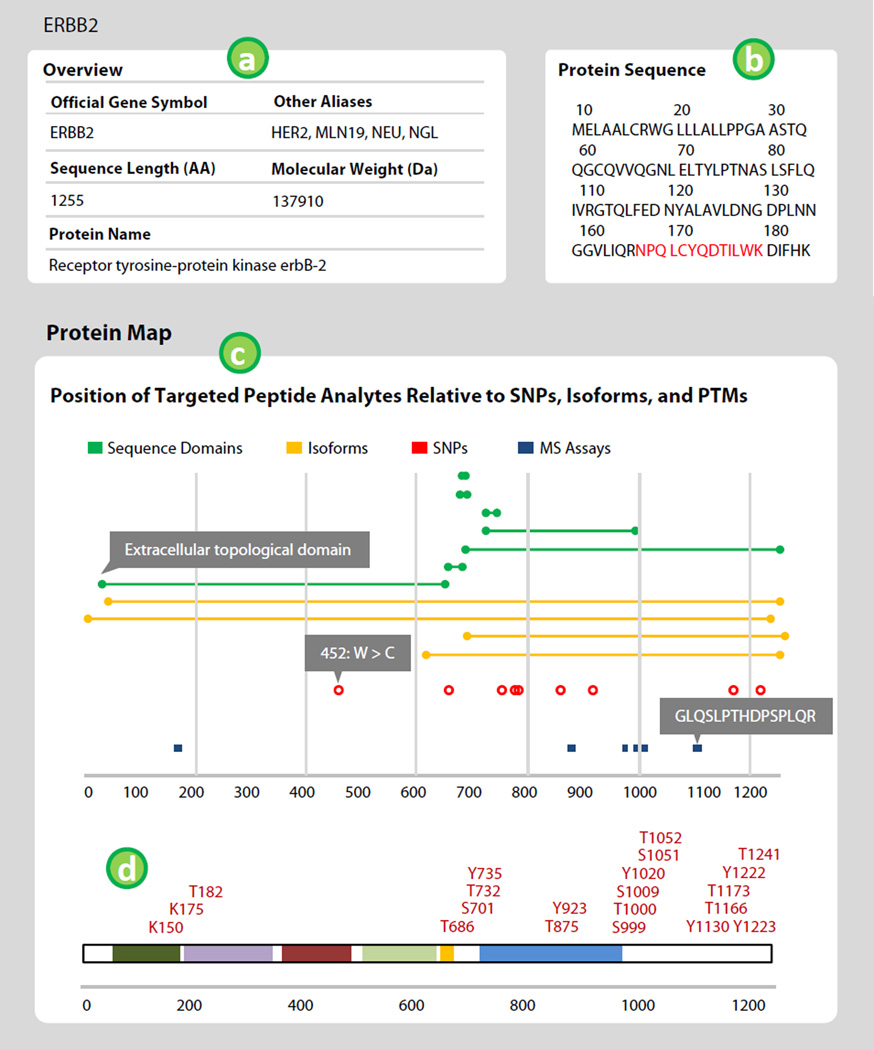
Once an assay is selected, the portal displays a page with details about the target gene and the selected peptide assay. The top portion of the page displays protein-level information along with links to external sites. The availability of other peptide assays mapping to the selected protein is indicated in the protein sequence image and map. Figure 3 shows the protein information panel and protein map. Labels in Fig. 3 refer to the following features.
The top section of the assay details page shows the gene symbol, aliases, protein length, molecular mass, protein sequence, and protein description. Information is collected from external sites with links to the described protein provided within the panel.
The Protein Sequence window is provided to visualize the location of available assays (highlighted in red) in relation to the entire protein sequence. For long proteins, hovering over the window expands the display to reveal the entire sequence. Clicking the highlighted peptide sequences displays the details pertaining to available assays.
The Protein Map is a visual representation of the location of available assays in relation to other protein features. The top portion of the map shows sequence domains, isoforms, and SNPs (from Uniprot) in relation to targeted assays (peptide location is mapped as a blue line). Hovering over the nodes (i.e. circles) of features in the map will display further details, whereas clicking on the nodes of the features will link to more information.
Additional PTMs, mapped by the PhosphositePlus (phosphosite.org) database, are displayed below the protein map. Additional information for individual site modifications can be obtained by clicking the modification label.
Figure 3.
The protein information panel shows information about the targeted protein. The Protein Map displays the location of available peptide assays relative to other prominent features in the protein of interest. The x-axis indicates amino acid location. Green bars indicate sequence domains, yellow isoforms, red dots single nucleotide polymorphisms, and blue lines are available peptide assays. Hovering over features displays more detail (shown in gray boxes). Post-translational modifications are mapped to the protein sequence by the PhosphositePlus database. Labels in the figure correspond to features described in the text.
3.3 The assay details and parameters panel
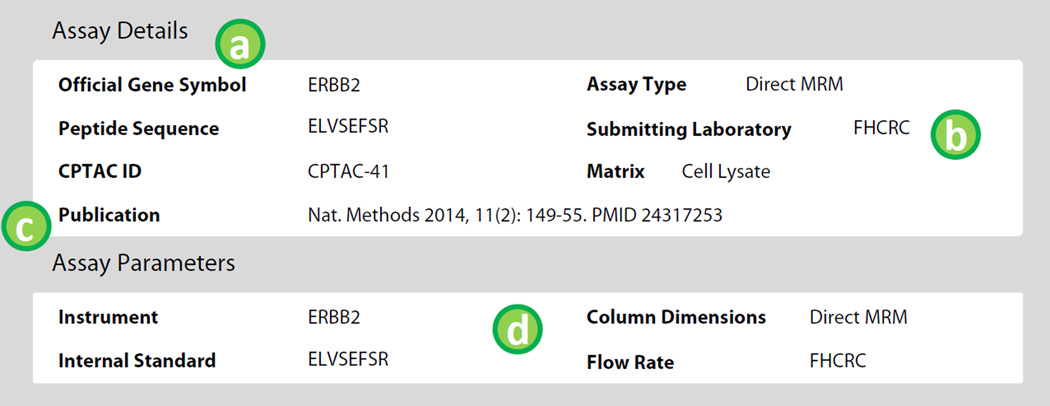
The bottom portion of the assay page allows users to browse details associated with the assay method and characterization data. The targeted assay information is reported under the ‘Assay Details’ section and analytical parameters are reported in the ‘Assay Parameters’ section. The Assay Details and Assay Parameters are depicted in Figure 4 with labels referring to the following features.
Details pertaining to the peptide sequence are displayed under ‘Assay Details.’ The CPTAD ID#, a unique identifier in the assay database, is used for referencing assays in the database. The CPTAC ID# should be used when referring to assays from outside sources (for example, when reporting on assays in the portal in publications). Additional fields in the details panel related to the peptide include modifications in the peptide sequence, the location of any modifications, the peptide molecular mass, and the relative start and stop location of the peptide within its native protein.
Conditions under which the assay was characterized by the submitting laboratory are also displayed. Assay type briefly describes the sample preparation protocol and data collection technique used in characterizing the assay. The matrix describes the background sample used to characterize the assay.
Publications associated with the assay are displayed.
Details pertaining to the instrumental parameters for assay characterization are displayed in the ‘Assay Parameters’ panel. The specific mass spectrometry and liquid chromatography system along with column conditions are displayed. The type of peptide or protein standard (including purity and isotopic label type) used in the characterization experiments is also displayed.
Figure 4.
Select details pertaining to the peptide assay and conditions for characterization are displayed for each assay. Labels in the figure correspond to features described in the text.
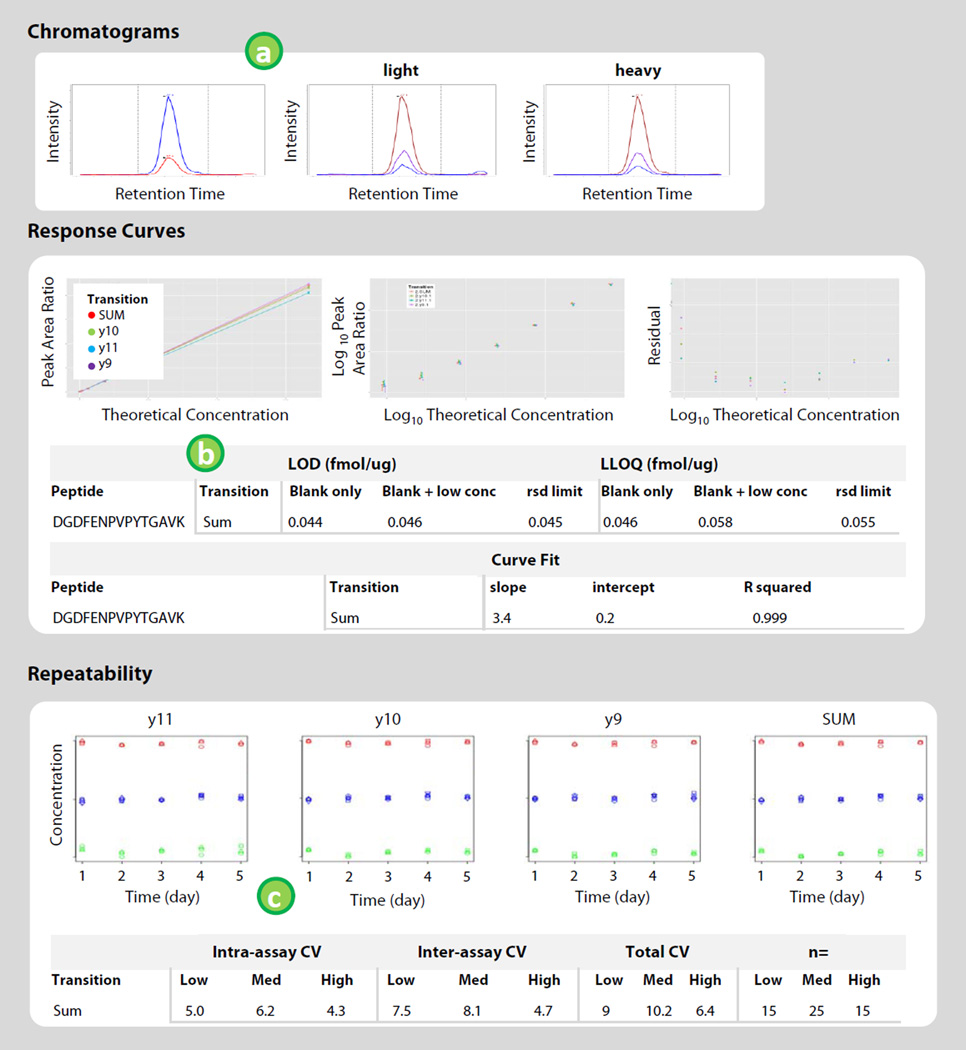
A summary of characterization data from the submitting laboratory is displayed in the bottom portion of the page. This is intended to provide users with performance data related to the selected assays in the reported matrix. Results will help potential downstream users of assays feel more confident that investing time, money, and energy into adopting and deploying the assays will be beneficial. An ‘Assay Characterization Guidance Document’ is posted on the portal (https://assays.cancer.gov/guidance-document/), with assay validation requirements and instructions for conducting the experiments. There are five experiments outlined (Response curve, Mini-validation of repeatability, Selectivity, Stability, and Reproducible detection of endogenous analyte). Chromatograms, response curves, and repeatability experiments are required for all assays uploaded to the Portal. Additional data evaluating the specificity, stability, and reproducibility of endogenous analyte measurement are encouraged; these data (when available) are found in the data repository. Figure 5 shows the layout of the data display.
The first panel of characterization data shows example chromatograms for the characterized assays. Chromatograms for the light and heavy channels of the assays are chosen by the submitting laboratory as being most representative of the assay. Chromatographic traces are compiled in a Chromatogram Library in Panorama.
Response curves images are shown in the section below the chromatograms. A processing script in Panorama analyzes the data by performing a robust linear regression on the data points [12]. The display shows three plots, i) the response curve plotted in linear space, ii) the curve plotted in log10 space, iii) residuals from the curve fit for each point. The limit of detection (LOD) and lower limit of quantification (LLOQ) are determined three different ways. First, the LOD is determined from blank samples, using the average plus 3 times the standard deviation of the blank peak area ratio (“blank only”). The LLOQ is the average plus 10 times the standard deviation. Second, the LOD is calculated using the standard deviation of the peak area ratios observed for the blank samples and for the samples with the lowest concentration in the response curve (“blank+low conc”). Again, the LLOQ uses 10 times the standard deviation. Third, the LLOQ is determined based on values of the variability (i.e. RSD, relative standard deviation) measured in the curve (“rsd limit”) [12]. The LOD for the RSD limit method is LLOQ/3. Calculations for assays characterized using unpurified (“crude”) peptides as standards are performed in the same matter, substituting the estimated concentration of the peptide standards. Unpurified standards are denoted on the portal by asterisk and highlighting the axes labels in red. Note the peptide purity is also reported in the ‘Assay Details’ section. Curve fit parameters are also displayed in the table.
The repeatability of assay measurement is displayed below the response curve data. Scripts in Panorama analyze the data automatically and produce the results for display on the portal. The repeatability image shows the peak area ratio (analyte:standard) measured in multiple replicates (minimum 3) for three different concentrations over five days. First, the intra-assay variability is calculated at each concentration as the CV of the three replicates on each of the five days. The CVs determined for each of the five days is averaged (this is the average intra-assay CV). Second, the inter-assay variability is calculated at each concentration by determining the CV of the first injection of each concentration across the five days, then the second injection, and then the third (if run in triplicate each day, continue this process for the fourth replicate and so on if more replicates are injected each day). These three (or more) CVs are averaged, and reported as the average inter-assay CV. The total CV is calculated as the square root of the sum of the (average intra-assay CV)2 and the (average inter-assay CV)2. The number of replicates at each concentration is reported in the column labeled “n=.” It is possible that the repeatability of the assays over multiple days is not as good as the response curves which are prepared on one day. Assays with repeatability data showing a total CV greater than 20% in any concentration sample are highlighted in red.
Curve fit parameters and performance figures of merit are displayed in a table below each plot on the portal.
Figure 5.
Overview of the display for assay characterization data for available assays. Example chromatograms contain separate traces for light peptides, heavy peptides, and the combined trace. Response curves are plotted on a linear and log-scale, along with residuals for the curve fit. Curve fit parameters and performance figures of merit are displayed in a table below each plot on the portal. Repeatability of the assay is plotted for measuring three concentrations of analyte (denoted by green, blue, and red points) in triplicate over five separate days with a table reporting the intra-assay (within day), inter-assay (between day), and total CV.
3.4 The assay resources and comments section
At the bottom of the Details page, there are links for more information about an assay, as well as a discussion board to allow users to share experiences and comments pertaining to individual assays.
Detailed standard operating protocols (SOPs) are associated with each assay. The documents are written by the submitting laboratory and available for download via links at the bottom of the assay details page. SOPs include descriptions of sample preparation, liquid chromatography, mass spectrometry, and the design of characterization experiments (e.g. run order, preparation of process replicates, etc.).
Links are also provided to the assay characterization data in Panorama. From Panorama, users can visualize any element of the data and download the associated Skyline documents, which can be used to generate transition lists and methods for laboratories desiring to implement the assays.
For assays using specialized reagents (like antibodies or peptide standards), links are provided to the source of the reagents (if available, for example at antibodies.cancer.gov).
Users can also share information, brief results, or experience with assays in a discussion board. This allows the community to exchange information about how specific assays behave in their laboratories or in previously uncharacterized matrices.
4. Ongoing and Future Development
Ongoing development is primarily focused on three areas: expanding search options, adding capabilities for processing characterization data, and increasing assay content. Incorporating additional search criteria (e.g. Gene Ontology and additional pathway databases) will further leverage biological information for identifying assays of interest. Scripts to collect, process, and display additional characterization experiments will allow further evaluation of the performance of assays. Finally, an interface for allowing any laboratory to contribute appropriately characterized assays to the portal is under development; an ‘Assay Characterization Guidance Document’ is posted on the portal (https://assays.cancer.gov/about/), with assay validation requirements and instructions for designing characterization experiments. We highly encourage user feedback for suggestions in the development of improved design and usability of the portal. Feedback can be provided by clicking the “Contact Us” link from the About page (https://assays.cancer.gov/about/).
5. Availability and requirements
The website is best viewed with the following browsers: Internet Explorer (Version 9 or higher), Firefox, Chrome, or Safari. To fully experience the site, we recommend using the latest version of any modern browser listed at BrowseHappy.com.
6. Resources for help
The About page contains a list of resources that may be helpful for laboratories interested in targeted mass spectrometry-based assays. A FAQ page is also available to address common questions regarding the portal. Documents describing assay characterization guidelines are available for download from the About page. Finally, a guided tour of the portal features is available from the main landing page.
Acknowledgments
This work was funded by the Clinical Proteomic Tumor Analysis Consortium (CPTAC) of the US National Cancer Institute (U24CA160034, U24CA160036, U24CA160019, U24CA159988, and U24CA160035), R01 GM103551, and U01 CA164186.
References
- 1.Whiteaker JR, Halusa GN, Hoofnagle AN, et al. CPTAC Assay Portal: a repository of targeted proteomic assays. Nat Methods. 2014;11:703–704. doi: 10.1038/nmeth.3002. [DOI] [PMC free article] [PubMed] [Google Scholar]
- 2.Picotti P, Lam H, Campbell D, et al. A database of mass spectrometric assays for the yeast proteome. Nat Methods. 2008;5:913–914. doi: 10.1038/nmeth1108-913. [DOI] [PMC free article] [PubMed] [Google Scholar]
- 3.Farrah T, Deutsch EW, Kreisberg R, et al. PASSEL: the Peptide Atlas SRM experiment library. Proteomics. 2012;12:1170–1175. doi: 10.1002/pmic.201100515. [DOI] [PMC free article] [PubMed] [Google Scholar]
- 4.Craig R, Beavis RC. TANDEM: matching proteins with tandem mass spectra. Bioinformatics. 2004;20:1466–1467. doi: 10.1093/bioinformatics/bth092. [DOI] [PubMed] [Google Scholar]
- 5.Remily-Wood ER, Liu RZ, Xiang Y, et al. A database of reaction monitoring mass spectrometry assays for elucidating therapeutic response in cancer. Proteomics Clinical Appl. 2011;5:383–396. doi: 10.1002/prca.201000115. [DOI] [PMC free article] [PubMed] [Google Scholar]
- 6.Yang X, Lazar IM. MRM screening/biomarker discovery with linear ion trap MS: a library of human cancer-specific peptides. BMC Cancer. 2009;9:96. doi: 10.1186/1471-2407-9-96. [DOI] [PMC free article] [PubMed] [Google Scholar]
- 7.Carr SA, Abbatiello SE, Ackermann BL, et al. Targeted peptide measurements in biology and medicine: best practices for mass spectrometry-based assay development using a fit-for-purpose approach. Mol Cell Proteomics MCP. 2014;13:907–917. doi: 10.1074/mcp.M113.036095. [DOI] [PMC free article] [PubMed] [Google Scholar]
- 8.MacLean B, Tomazela DM, Shulman N, et al. Skyline: an open source document editor for creating and analyzing targeted proteomics experiments. Bioinforma Oxf Engl. 2010;26:966–968. doi: 10.1093/bioinformatics/btq054. [DOI] [PMC free article] [PubMed] [Google Scholar]
- 9.Sharma V, Eckels J, Taylor GK, et al. Panorama: a targeted proteomics knowledge base. J Proteome Res. 2014;13:4205–4210. doi: 10.1021/pr5006636. [DOI] [PMC free article] [PubMed] [Google Scholar]
- 10.Mudunuri U, Che A, Yi M, Stephens RM. bioDBnet: the biological database network. Bioinforma Oxf Engl. 2009;25:555–556. doi: 10.1093/bioinformatics/btn654. [DOI] [PMC free article] [PubMed] [Google Scholar]
- 11.Hornbeck PV, Kornhauser JM, Tkachev S, et al. PhosphoSitePlus: a comprehensive resource for investigating the structure and function of experimentally determined post-translational modifications in man and mouse. Nucleic Acids Res. 2012;40:D261–D270. doi: 10.1093/nar/gkr1122. [DOI] [PMC free article] [PubMed] [Google Scholar]
- 12.Mani DR, Abbatiello SE, Carr SA. Statistical characterization of multiple-reaction monitoring mass spectrometry (MRM-MS) assays for quantitative proteomics. BMC Bioinformatics. 2012;13(Suppl 16):S9. doi: 10.1186/1471-2105-13-S16-S9. [DOI] [PMC free article] [PubMed] [Google Scholar]


