Abstract
Purpose
This study examined the peripapillary choroidal thickness (PCT) in nonarteritic ischemic optic neuropathy (NAION) in comparison to contralateral eyes and normal eyes.
Methods
We used enhanced depth imaging spectral-domain optical coherence tomography to image the optic nerve head of 20 NAION, 10 contralateral eyes, and 102 normal eyes. Following compensation, the scans were manually delineated to identify relevant surfaces including Bruch's membrane opening (BMO), Bruch's membrane, and anterior sclera. The PCT was defined as the measurement between Bruch's membrane and the anterior sclera and was measured at increasing distance from BMO. Models adjusted for age, BMO area, and axial length were used to compare the mean PCT between NAION and normal eyes, and contralateral eyes and normal eyes. Paired t-tests were used to compare the PCT between NAION and contralateral eyes.
Results
The mean PCT was thicker in NAION and contralateral eyes when compared with normal eyes at all distances from BMO (P < 0.001). The PCT was not significantly thicker in contralateral eyes when compared with affected NAION eyes. Choroidal thickness was thinnest in the inferior quadrant in all eyes regardless of the group.
Conclusions
Increased peripapillary choroidal thickness was noted in both NAION and contralateral eyes. The thicker choroid may be an associated feature or a result of the disorder. Although further longitudinal study is required to determine causation, these findings may suggest that a thickened peripapillary choroid may be a component of the disk-at-risk clinical phenotype.
Keywords: choroid, ischemic, NAION, peripapillary
Nonarteritic anterior ischemic optic neuropathy (NAION) presents with sudden, painless visual loss with associated optic disc edema. It is the most common acute optic neuropathy in older adults, resulting in decreased vision and visual field loss. It has been historically associated with a small, crowded appearing, and cupless optic disc, termed the disc at risk.1 Although the pathogenesis and exact location of the insult in NAION remains uncertain, the prevailing theory is that of vascular insufficiency to the optic nerve head.2,3 It remains uncertain what role, if any, the peripapillary choroid has in the pathogenesis of NAION despite some of the shared circulation from the posterior ciliary arteries.
The advancement of spectral-domain optical coherence tomography (SDOCT) imaging technology has allowed us visualization and reproducible quantification of the optic nerve head and choroidal structures.4–7 With enhanced depth imaging (EDI) it has become possible to visualize the deeper layers of the retina, optic nerve, and choroid. The purpose of the current study was to compare the peripapillary choroidal thickness (PCT) of eyes with NAION, contralateral eyes, and normal eyes without ocular disease.
Methods
Participant Recruitment
Between March 2014 and January 2015, we recruited patients who had a history of unilateral or bilateral NAION from referral-based neuro-ophthalmology clinics in the Department of Ophthalmology at the University of Alabama at Birmingham (UAB). All patients provided informed consent, and the study was approved by the Institutional Review Board of UAB and followed the principals of the Declaration of Helsinki.
Inclusion criteria consisted of age > 19 years, NAION in at least one eye for longer than 6 weeks, and at least 3 months of available follow-up. NAION was identified clinically by at least one of the three fellowship trained neuro-ophthalmologist based on clinical presentation of acute painless visual loss, presence of disc edema with or without peripapillary splinter hemorrhages, visual field (VF) deficit, spontaneous resolution of the disc edema within 6 to 8 weeks, a normal erythrocyte sedimentation rate for age, and the absence of any other identifiable cause for disc edema. Exclusion criteria included a diagnosis of open angle glaucoma, intraocular pressure (IOP) greater than 22 mm Hg, spherical refraction greater than ± 6.0 D, the presence of other ocular pathology requiring active treatment, and previous intraocular surgery except for routine cataract surgery.
Comparative data from healthy participants was obtained from individuals in the African Descent and Glaucoma Evaluation Study (ADAGES)8 and the Alabama Study on Early Age-Related Macular Degeneration (ALSTAR),9 which are two National Institute of Health–funded studies conducted at UAB. These participants were recruited from general eye clinics seeking routine eye examinations, had no ocular diseases, and had reliable and normal Swedish interactive threshold algorithm standard perimetry.
Measures
The following variables were collected during the patients' single imaging visit: age recorded in years, gender, month and year of NAION onset for involved eyes, visual acuity, color vision, contrast sensitivity, automated perimetry 24-2 Swedish interactive threshold algorithm, axial length, and color fundus photography. Applanation tonometry was recorded for the NAION group either from the chart if done within 6 months of the imaging visit or obtained the day of the imaging visit. In the healthy group, IOP was obtained from the last recorded IOP on chart abstraction in the ALSTAR group and measured during the imaging visit in the ADAGES group. In addition, SDOCT imaging using EDI technology (Heidelberg Engineering, Heidelberg, Germany) was obtained on all participants using 48 radial volume scans (20°) centered on the optic nerve head. The operator assessed the SDOCT images during acquisition to ensure good quality. The healthy participants from ADAGES and ALSTAR studies had undergone identical imaging procedures.
To enhance the visibility of deeper tissues, SDOCT B-scan volumes were then processed using a customized adaptive compensation algorithm, with contrast and threshold exponents of 2.10,11 This step allowed for better visualization and more reliable delineation of the anterior sclera and Bruch's membrane. The compensated SDOCT volumes were then loaded and aligned in custom software (based on the Visualization Toolkit; Kitware, Inc., Clifton Park, NY, USA) that has been developed for the three-dimensional (3D) delineation of histologic and SDOCT data.12,13 This technology has been shown to quantify principal surfaces of the optic nerve with a high degree of reproducibility. One trained, masked observer manually delineated 12 equally spaced radial sections of each volume. A second masked, trained observer then checked the delineations for accuracy, and any necessary corrections were made. Two observers resolved any discrepancies in the delineations. A previous analysis of the within- and between-person variance of the manual delineation with the 3D approach showed a very high interrater agreement between the two observers, with an intraclass correlation coefficient of >0.75 at all locations.14 The delineated surfaces included internal limiting membrane, posterior retinal ganglion cell layer, BMO, Bruch's membrane (BM), anterior lamina surface, anterior scleral canal opening, and anterior sclera surface (AS; Fig. 1). The PCT was defined as the distance between the BM and the AS, and it was measured at different distances from the BMO (0–250 μm, 250–500 μm, 500–1000 μm, 1000–1500 μm, and 1500–2000 μm; Fig. 1e).
Figure 1.
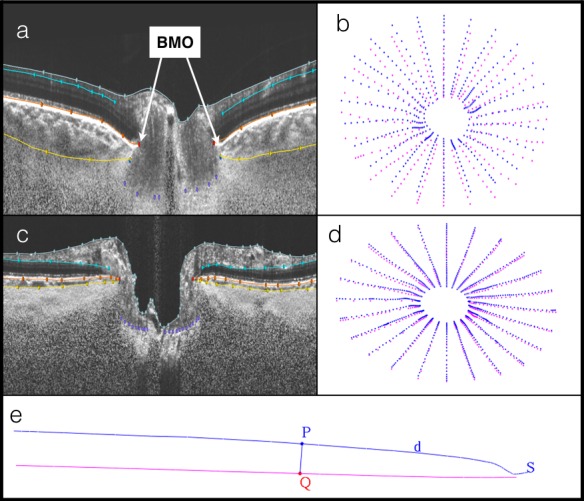
Compensated spectral-domain optical coherence tomography (SDOCT) volumes with delineated surfaces and corresponding point clouds. (a) Delineated SDOCT from a contralateral eye: Bruch's membrane (BM; orange), anterior sclera (AS; yellow). (b) Corresponding point cloud of peripapillary choroidal thickness (PCT) measurements between BM (blue) and AS (pink). (c) Delineated SDOCT from normal eye. (d) Corresponding point cloud. (e) Quantification of PCT: point P is d μm distance from Bruch's membrane opening; line from BM (blue) to AS (pink) intersecting at Q; PCT of section S.
Statistical Analysis
Demographic and ocular characteristics were compared between NAION versus normal eyes and contralateral versus normal eyes using generalized estimating equations with an independent working correlation matrix. Adjusted models were used to compare the mean PCT overall, PCT at different distances from the BMO, and PCT by quadrant (superior, inferior, nasal, temporal) between NAION versus normal eyes and contralateral versus normal eyes. An interaction term between group and distance from the BMO (0–250 μm vs. 2500–3000 μm) was added to the model with a log link function. Matching between NAION and normal eyes was not used. Models were adjusted for age, area BMO, and axial length. To assess the relationship between the IOP and PCT, a generalized estimating equation model was used while adjusting for disease status, age, area BMO, and axial length. For all models, normal eyes were coded as the referent group. Paired t-tests were used to compare the PCT overall, PCT at different distances from the BMO, and PCT by quadrant between NAION versus contralateral eyes. The correlation between disease duration and the PCT among NAION and contralateral eyes was calculated using a Spearman correlation coefficient. Finally, Spearman correlation coefficients were used to assess the association between the PCT in the inferior hemifield with the VF threshold in the superior hemifield. Similarly, correlations were generated for the PCT in the superior hemifield with the VF threshold in the inferior hemifield.
Results
There were 18 patients recruited into the NAION study arm, 13 with unilateral disease and 5 with bilateral disease. We excluded eyes with inadequate or incomplete SDOCT data following delineation. One diseased eye was additionally excluded because it was the sole eye in the African descent group and the sample was so small that meaningful analyses were impossible. After exclusions, the final study group had a total of 20 NAION eyes, 10 contralateral eyes, and 102 normal eyes, all of European descent. As shown in Table 1, participants in the NAION group ranged in age from 36 to 80 years with a mean age of 63.9 (standard deviation [SD] 11.7) years. They had mean disease duration of 1243 days (SD 1151; minimum 47/maximum 3848). Participants in the healthy group ranged in age from 29 to 92 years with a mean age of 63.4 (SD 15.6) years. The mean area of the BMO in NAION eyes was 1.656 μm2 × 106, compared to 1.708 μm2 × 106 in normal eyes (P = 0.5793). Average axial length was 22.8 mm (SD 1.5) in NAION, 23.5 mm (SD 1.2) in contralateral, and 23.8 mm (SD 1.1) in normal eyes. The mean PCT value, adjusted for age, axial length, and area BMO, was greater at all distances from the BMO in both the NAION and contralateral eyes when compared with the normal cohort (Table 2). As illustrated in Figure 2, contralateral eyes had a slightly thicker PCT than NAION eyes; however, these differences were not statistically significant (Table 3).
Table 1.
Demographic and Ocular Characteristics Among NAION Eyes, Contralateral Eyes, and Normal Eyes
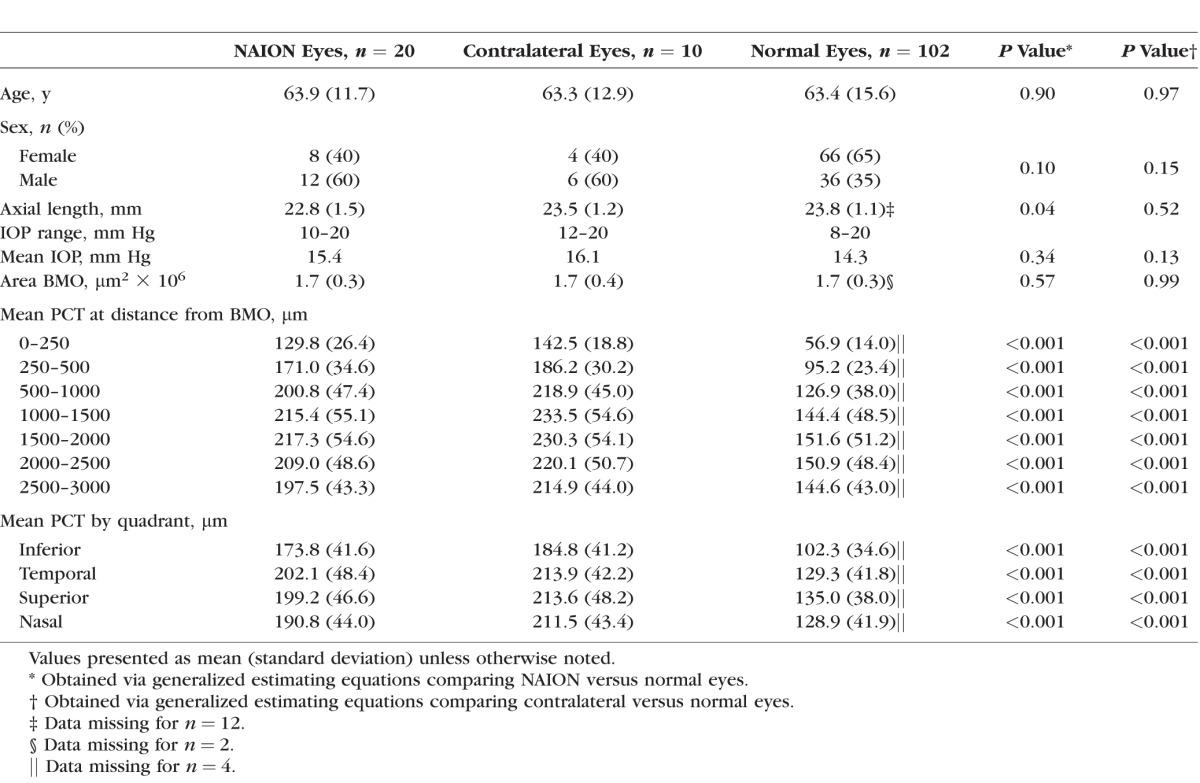
Table 2.
Adjusted Association Between NAION Versus Normal Eyes and Contralateral Versus Normal Eyes, Stratified by Distance From the BMO and by Quadrant
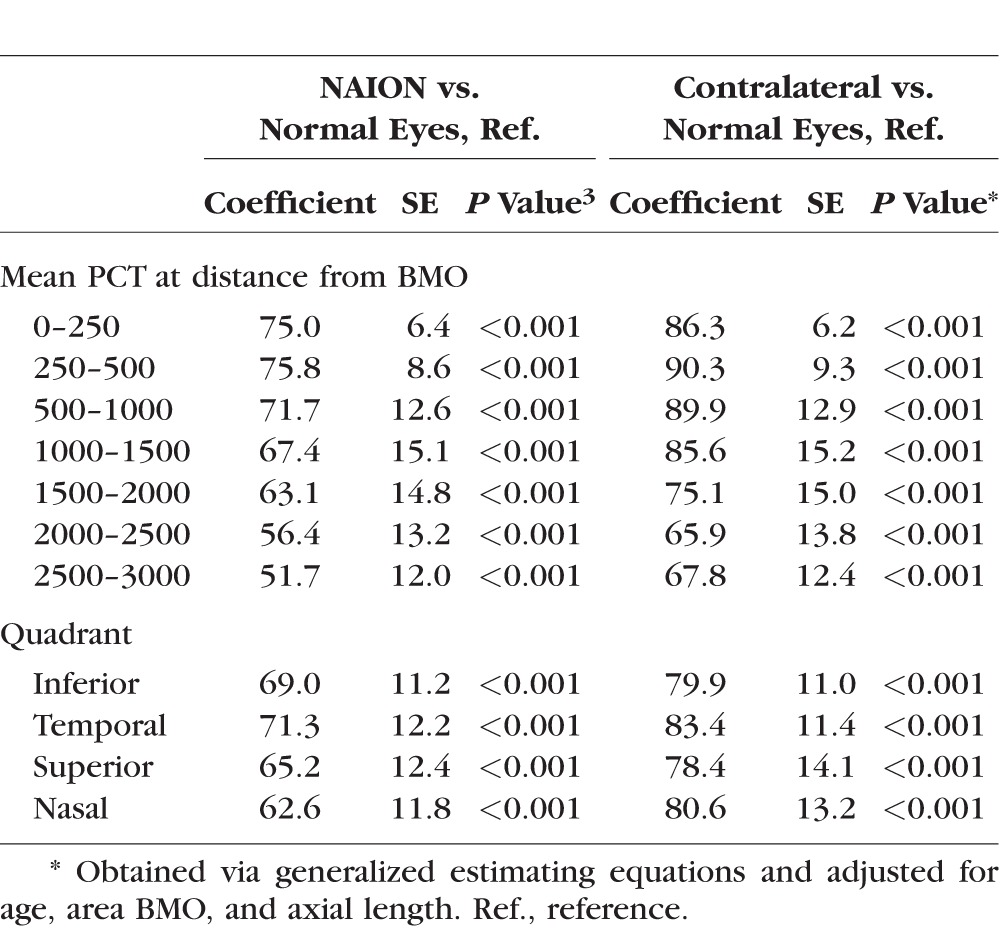
Figure 2.
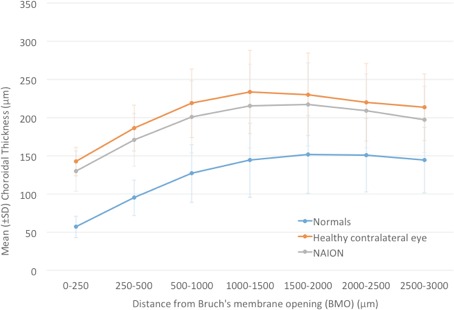
Line graph of mean choroidal thickness at various distances from BMO in NAION, contralateral, and normal eyes.
Table 3.
Mean Choroidal Thickness by Distance From the BMO and by Quadrant Between NAION and Contralateral Eyes
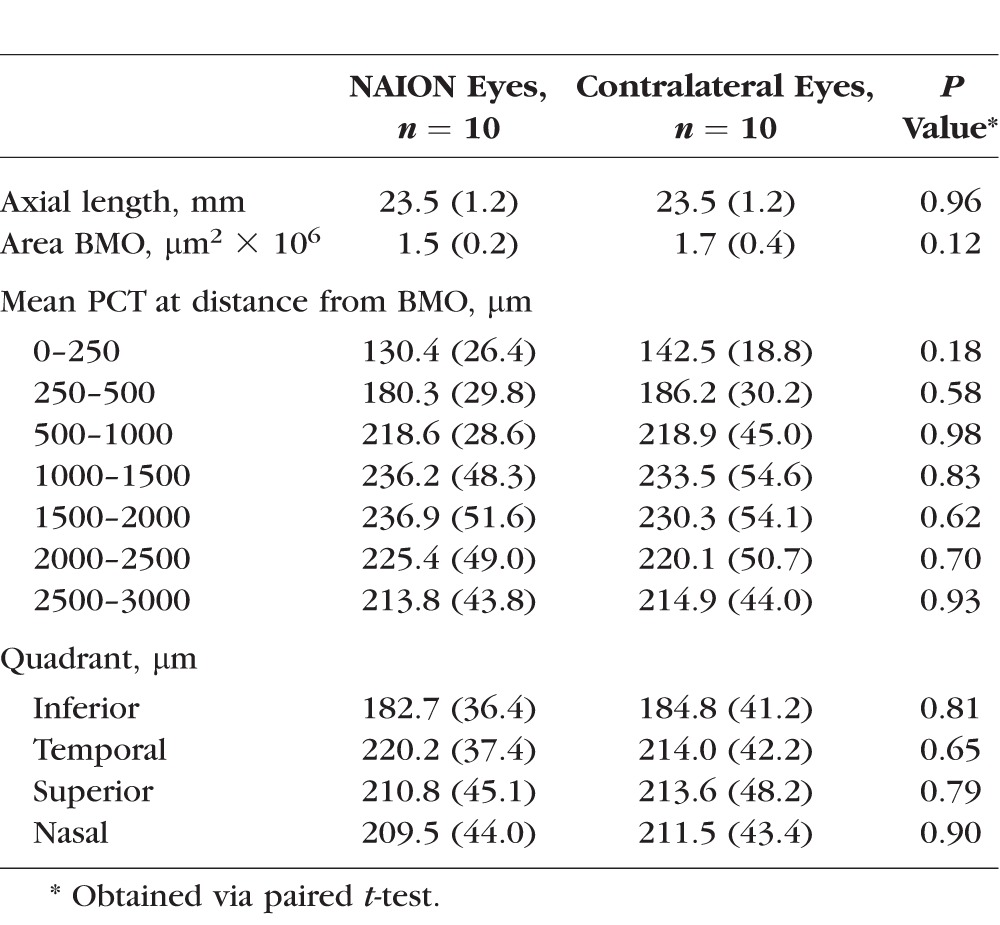
The mean PCT was thinnest at a distance closest to BMO regardless of the group, and it increased in thickness reaching its maximum at 1000 to 1500 μm from BMO. Beyond 1500 μm, the mean PCT of the normal group leveled off, and the NAION and contralateral eyes showed a slight decrease in thickness (Fig. 2). The relative differences in mean PCT between the NAION, contralateral, and normal eyes were closer (0–250 μm) to the optic nerve rather than farther away (2500–3000 μm; P < 0.0001). There was a weak negative correlation between disease duration and mean PCT thickness, which was not statistically significant (P = 0.34). An analysis of the PCT by quadrant (superior, inferior, nasal, temporal) showed the inferior quadrant to be the thinnest in both the NAION (diseased and contralateral eyes) and normal cohorts (Table 1). There was a weak negative correlation between PCT and VF function in the NAION diseased eyes (superior hemifield PCT and inferior hemifield threshold P = −0.24, P = 0.34; inferior hemifield PCT and superior hemifield threshold P = −0.19, P = 0.45). As noted previously, IOP was recorded for the NAION and healthy participants, although not necessarily immediately prior to imaging. There was no statistically significant correlation between the IOP and mean PCT in the model (P = 0.13) after adjusting for disease status, age, area BMO, and axial length.
Discussion
The current study showed a significantly thicker peripapillary choroid in both the diseased and unaffected contralateral eyes of patients with NAION when compared with normal eyes. The PCT was not significantly thicker in the contralateral eyes when compared with the affected NAION eyes. These differences were most pronounced immediately adjacent to the border of the optic disc between 0 and 250 μm from BMO (Fig. 2). These findings suggest that a thicker choroid might be a predisposing factor for NAION. The exact mechanism by which this occurs will need further investigation.
The results of the current study are consistent with a previously published study by Fard et al.15 that found similar differences in PCT measured using a single circular B-scan of 3.4 mm in diameter centered on the optic nerve, which corresponds to approximately 700 to 1000 microns from BMO in our data. They had 30 NAION and unaffected fellow eyes and 25 normal eyes. The mean PCT in the NAION eyes in their study was 201.6 (SD 42.4) μm. The methods in our current study were able to more fully quantify the 3D regional morphometry of the peripapillary choroid up to the disc margin defined by BMO and found profound differences between groups adjacent to the BMO, with the PCT exhibiting an almost complete separation between the NAION and normal groups (Fig. 3) and complete separation between the contralateral eyes of the patients with unilateral NAION and normal eyes.
Figure 3.
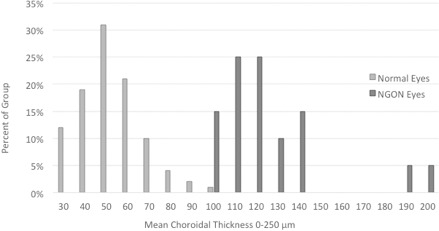
Histogram comparing mean choroidal thickness at 0–250 μm between NAION and normal eyes.
In contrast, another recently published study found that the PCT was thinner in NAION and contralateral healthy eyes when compared with their control group.16 They had 37 NAION, 19 unaffected, and 38 normal eyes. In this study, a horizontal and vertical a-scan centered on the optic nerve were obtained using SDOCT with EDI, and the PCT was measured from the posterior RPE edge to choroid–scleral junction at 500 μm intervals. Several differences in the methods were present between these studies in that measurements were obtained from noncompensated SDOCT volumes, which can make visualization of the sclera more difficult, and the method used was a two-dimensional sampling instead of the 3D approach used in our study. In addition, the healthy controls in the prior study were significantly more hyperopic than the NAION eyes, which could account for the greater PCT in the control group.
Previous studies of the choroid in NAION have focused on the macular PCT and have provided conflicting reports about subfoveal PCT in NAION. Dias-Santos et al.17 reported a thicker subfoveal choroid and hypothesized that the finding of a thicker choroid was a marker that supported a dysfunction of the vascular auto regulation mechanism theory for NAION. However, Schuster et al.18 found a thinner subfoveal PCT in both NAION and contralateral eyes when compared with normal eyes and hypothesized that a thinner subfoveal PCT is a potential risk factor for developing NAION.
Regarding the IOP and PCT, previous studies have shown the mean PCT to increase with a decrease in IOP.19,20 Saeedi et al.19 noted that for every 1 mm Hg decrease in IOP, there was a mean increase of 3.4 μm in PCT. Although this was significant, the magnitude of the effect could not have played a role in the significant differences in the PCT noted in our study. There was no significant correlation in our data between the IOP and PCT thickness. Moreover, we included IOP in the full models, but it was not significantly related to the PCT (adjusted P value = 0.216), so it was not included in the final model.
Interestingly, the BMO area was not significantly smaller when compared with the normal eyes in our study. Given that prior studies using photographic21 and confocal scanning laser ophthalmoscopy22 have demonstrated a small disc area and cup-to-disc ratio in NAION eyes,1,23–27 one would have expected the area BMO to be significantly smaller. Our findings, however, were consistent with other SDOCT studies examining the BMO area in NAION patients.28–30 Contreras et al.28 evaluated the characteristic of optic nerve in NAION when compared with controls using stratus SDOCT and found no significant difference in the disc area between the two groups. Chan et al.29 evaluated optic nerve morphology of NAION when compared with controls using stratus SDOCT and HRT in participants of Chinese ethnicity and found no significant difference in the disc areas as measured by the SDOCT and the HRT. Yang et al.30 compared optic nerve morphology in eyes with glaucoma, NAION, and controls using Fourier-domain OCT and found no significant difference in disc area between the control eyes and the NAION eyes. These findings suggest that the morphology of the disc at risk in NAION may not be well understood and it is not simply a small optic nerve head.
The exact vasculature affected in NAION has not been well defined, and therefore the pathophysiology remains uncertain. Most of the evidence is based on fluorescein studies and indirect evidence from other atypical forms of ischemic optic neuropathy.3,31–37 Arnold et al.3 used fluorescein studies in NAION to demonstrate delayed filling in the prelaminar optic disc without significant delay in the parapapillary choroidal filling. This seemed to suggest that the compromise is to the paraoptic branches of the short posterior ciliary arteries. In addition, in histologic studies of ischemic optic neuropathy, Knox et al.36 found the site of infarction to be located predominantly in the retrolaminar optic nerve, with occasional extension into the laminar and prelaminar area. A compartment-like syndrome has also been proposed in the pathophysiology of NAION, presumably from the crowding of the optic nerve fibers.1,21,27,38
Although longitudinal data are needed, the fact that the PCT in the contralateral eye is also thick when compared with normal eyes is suggestive that the thicker PCT may be a morphologic feature associated with an elevated risk for NAION. The role of the significantly thicker choroid in NAION eyes is unclear. Unfortunately, there are no methods to comprehensively examine blood flow within the deeper layers of the optic nerve, the surrounding intrascleral vasculature, or choroid.
Interestingly, NAION is more often seen on waking from sleep after a patient has been supine39 and is possibly associated with sildenafil treatment.40 Both of these situations can increase PCT.41,42 This supports an interesting hypothesis that a thicker choroid could create a compartment syndrome within the optic nerve head (Fig. 4) in which the axons and their blood supply are strained with fluctuations in choroidal volume within the narrow central cup. Regardless of the mechanism, additional longitudinal studies are needed to determine if the PCT is a risk factor for NAION and what role it plays in the pathogenesis of the disease.
Figure 4.
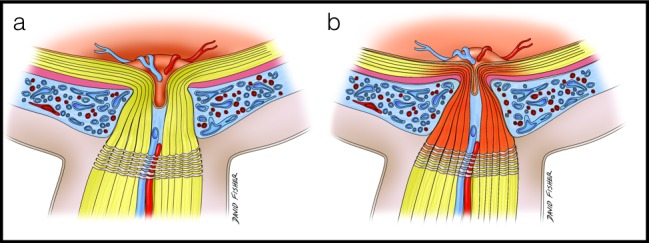
Conceptual images illustrating the hypothesis of compartment syndrome as a result of alterations in choroidal volume in an eye with thick peripapillary choroid. (a) Thick peripapillary choroid in an eye predisposed to nonarteritic optic neuropathy. (b) Expansion of the peripapillary choroid in this eye in response to positional changes, causing a compartment syndrome in the laminar, prelaminar, and retrolaminar optic nerve with resultant ischemia.
Our study had several limitations. Our sample size in the NAION and contralateral eyes was small, yet despite that, the results are still quite clinically important and provide a strong rationale for both larger and longitudinal studies. Our participants were all of European descent, which may limit generalizability beyond this group. The data for the healthy group was collected prior to the NAION group, therefore all data were not collected concurrently. Thus there is a possibility of unmeasured confounding. However, identical protocols were used and the measurements are relatively stable over time, so this is unlikely to explain these significant findings. We did not control for time of imaging, and PCT has been noted to change with time of day.43,44 In addition, the IOP was not measured immediately prior to imaging, which may have introduced some random error. Although the delineations were manually performed, the quantifications have been shown to be highly reproducible.14 Regardless, these random effects would lower estimates of association and thus could not have played a role in the highly significant differences seen in this analysis. Finally, as a cross-sectional comparison, it is uncertain whether a thicker choroid preceded NAION or occurred as a result of the injury. Results from the contralateral eye suggest that the thicker choroid may have existed prior to the NAION and thus may be a risk factor for the development of the condition, although further prospective studies are needed.
In summary, the present study suggests that a thicker peripapillary choroid may be an important anatomical and physiological feature in eyes of patients with NAION, including the fellow eye. Our results may represent a new component of the disk-at-risk clinical phenotype.
Acknowledgments
The authors thank Claude Burgoyne, MD, and the Optic Nerve Head Research Laboratory of the Devers Eye Institute (Portland, OR, USA) for providing the Multiview delineation software.
Supported by the National Eye Institute (R01 EY018926, U10 EY14267, EY019869; Bethesda, MD, USA), the National Institute on Aging (R01 AG04212; Bethesda, MD, USA), the Eyesight Foundation of Alabama (Birmingham, AL, USA), Research to Prevent Blindness (New York, NY, USA), Alfreda J. Schueler Trust (Chicago, IL, USA), and the National University of Singapore Young Investigator Award (NUSYIA_FY13_P03; Singapore, Singapore).
Disclosure: L. Nagia, None; C. Huisingh, None; J. Johnstone, None; L.B. Kline, None; M. Clark, None; M.J.A. Girard, None; J.M. Mari, None; C.A. Girkin, None
References
- 1. Mansour AM,, Shoch D,, Logani S. Optic disk size in ischemic optic neuropathy. Am J Ophthalmol. 1988; 106: 587–589. [DOI] [PubMed] [Google Scholar]
- 2. Hayreh SS. Management of non-arteritic anterior ischemic optic neuropathy. Graefes Arch Clin Exp Ophthalmol. 2009; 247: 1595–1600. [DOI] [PubMed] [Google Scholar]
- 3. Arnold AC. Pathogenesis of nonarteritic anterior ischemic optic neuropathy. J Neuroophthalmol. 2003; 23: 157–163. [DOI] [PubMed] [Google Scholar]
- 4. Margolis R,, Spaide RF. A pilot study of enhanced depth imaging optical coherence tomography of the choroid in normal eyes. Am J Ophthalmol. 2009; 147: 811–815. [DOI] [PubMed] [Google Scholar]
- 5. Ho J,, Branchini L,, Regatieri C,, et al. Analysis of normal peripapillary choroidal thickness via spectral domain optical coherence tomography. Ophthalmology. 2011; 118: 2001–2007. [DOI] [PMC free article] [PubMed] [Google Scholar]
- 6. Lee EJ,, Kim TW,, Weinreb RN,, et al. Visualization of the lamina cribrosa using enhanced depth imaging spectral-domain optical coherence tomography. Am J Ophthalmol. 2011; 152: 87–95.e1. [DOI] [PubMed] [Google Scholar]
- 7. Lee EJ,, Kim TW,, Weinreb RN,, et al. Three-dimensional evaluation of the lamina cribrosa using spectral-domain optical coherence tomography in glaucoma. Invest Ophthalmol Vis Sci. 2012; 53: 198–204. [DOI] [PubMed] [Google Scholar]
- 8. Sample PA,, Girkin CA,, Zangwill LM,, et al. The African Descent and Glaucoma Evaluation Study (ADAGES): design and baseline data. Arch Ophthalmol. 2009; 127: 1136–1145. [DOI] [PMC free article] [PubMed] [Google Scholar]
- 9. Owsley C,, Huisingh C,, Jackson GR,, et al. Associations between abnormal rod-mediated dark adaptation and health and functioning in older adults with normal macular health. Invest Ophthalmol Vis Sci. 2014; 55: 4776–4789. [DOI] [PMC free article] [PubMed] [Google Scholar]
- 10. Mari JM,, Strouthidis NG,, Park SC,, Girard MJ. Enhancement of lamina cribrosa visibility in optical coherence tomography images using adaptive compensation. Invest Ophthalmol Vis Sci. 2013; 54: 2238–2247. [DOI] [PubMed] [Google Scholar]
- 11. Johnstone J,, Fazio M,, Rojananuangnit K,, et al. Variation of the axial location of Bruch's membrane opening with age, choroidal thickness, and race. Invest Ophthalmol Vis Sci. 2014; 55: 2004–2009. [DOI] [PMC free article] [PubMed] [Google Scholar]
- 12. Downs JC,, Yang H,, Girkin C,, et al. Three-dimensional histomorphometry of the normal and early glaucomatous monkey optic nerve head: neural canal and subarachnoid space architecture. Invest Ophthalmol Vis Sci. 2007; 48: 3195–3208. [DOI] [PMC free article] [PubMed] [Google Scholar]
- 13. Strouthidis NG,, Yang H,, Downs JC,, Burgoyne CF. Comparison of clinical and three-dimensional histomorphometric optic disc margin anatomy. Invest Ophthalmol Vis Sci. 2009; 50: 2165–2174. [DOI] [PMC free article] [PubMed] [Google Scholar]
- 14. Rhodes LA,, Huisingh C,, Johnstone J,, et al. Peripapillary choroidal thickness variation with age and race in normal eyes. Invest Ophthalmol Vis Sci. 2015; 56: 1872–1879. [DOI] [PMC free article] [PubMed] [Google Scholar]
- 15. Fard MA,, Abdi P,, Kasaei A,, et al. Peripapillary choroidal thickness in nonarteritic anterior ischemic optic neuropathy. Invest Ophthalmol Vis Sci. 2015; 56: 3027–3033. [DOI] [PubMed] [Google Scholar]
- 16. Garcia-Basterra I,, Lahrach I. MorilloSanchez MJ,, et al. Analysis of peripapillary choroidal thickness in non-arteritic anterior ischaemic optic neuropathy [published online ahead of print October 9, 2015] Br J Ophthalmol. doi:http://dx.doi.org/10.1136/bjophthalmol-2015-307526. [DOI] [PubMed]
- 17. Dias-Santos AF,, Ferreira J,, Pinto L,, et al. Choroidal thickness in nonarteritic anterior ischaemic optic neuropathy: a study with optical coherence tomography. Neuro-Ophthalmology. 2014; 38: 173–179. [DOI] [PMC free article] [PubMed] [Google Scholar]
- 18. Schuster AK,, Steinmetz P,, Forster TM,, et al. Choroidal thickness in nonarteritic anterior ischemic optic neuropathy. Am J Ophthalmol. 2014; 158: 1342–1347.e1. [DOI] [PubMed] [Google Scholar]
- 19. Saeedi O,, Pillar A,, Jefferys J,, et al. Change in choroidal thickness and axial length with change in intraocular pressure after trabeculectomy. Br J Ophthalmol. 2014; 98: 976–979. [DOI] [PubMed] [Google Scholar]
- 20. Usui S,, Ikuno Y,, Uematsu S,, et al. Changes in axial length and choroidal thickness after intraocular pressure reduction resulting from trabeculectomy. Clin Ophthalmol. 2013; 7: 1155–1161. [DOI] [PMC free article] [PubMed] [Google Scholar]
- 21. Beck RW,, Savino PJ,, Repka MX,, et al. Optic disc structure in anterior ischemic optic neuropathy. Ophthalmology. 1984; 91: 1334–1337. [DOI] [PubMed] [Google Scholar]
- 22. Danesh-Meyer HV,, Boland MV,, Savino PJ,, et al. Optic disc morphology in open-angle glaucoma compared with anterior ischemic optic neuropathies. Invest Ophthalmol Vis Sci. 2010; 51: 2003–2010. [DOI] [PMC free article] [PubMed] [Google Scholar]
- 23. Monteiro ML. Anterior ischemic optic neuropathy: a comparison of the optic disc area of patients with the arteritic and non-arteritic forms of the disease and that of normal controls. Arq Bras Oftalmol. 2006; 69: 805–810. [DOI] [PubMed] [Google Scholar]
- 24. Jonas JB,, Gusek GC,, Naumann GO. Anterior ischemic optic neuropathy: nonarteritic form in small and giant cell arteritis in normal sized optic discs. Int Ophthalmol. 1988; 12: 119–125. [DOI] [PubMed] [Google Scholar]
- 25. Tsai RK,, Liu YT,, Su MY. Risk factors of non-arteritic anterior ischemic optic neuropathy (NAION): ocular or systemic. Kaohsiung J Med Sci. 1998; 14: 221–225. [PubMed] [Google Scholar]
- 26. Burde RM. Optic disk risk factors for nonarteritic anterior ischemic optic neuropathy. Am J Ophthalmol. 1993; 116: 759–764. [DOI] [PubMed] [Google Scholar]
- 27. Feit RH,, Tomsak RL,, Ellenberger C., Jr. Structural factors in the pathogenesis of ischemic optic neuropathy. Am J Ophthalmol. 1984; 98: 105–108. [DOI] [PubMed] [Google Scholar]
- 28. Contreras I,, Rebolleda G,, Noval S,, Munoz-Negrete FJ. Optic disc evaluation by optical coherence tomography in nonarteritic anterior ischemic optic neuropathy. Invest Ophthalmol Vis Sci. 2007; 48: 4087–4092. [DOI] [PubMed] [Google Scholar]
- 29. Chan CK,, Cheng AC,, Leung CK,, et al. Quantitative assessment of optic nerve head morphology and retinal nerve fibre layer in non-arteritic anterior ischaemic optic neuropathy with optical coherence tomography and confocal scanning laser ophthalmoloscopy. Br J Ophthalmol. 2009; 93: 731–735. [DOI] [PubMed] [Google Scholar]
- 30. Yang Y,, Zhang H,, Yan Y,, et al. Comparison of optic nerve morphology in eyes with glaucoma and eyes with non-arteritic anterior ischemic optic neuropathy by Fourier domain optical coherence tomography. Exp Ther Med. 2013; 6: 268–274. [DOI] [PMC free article] [PubMed] [Google Scholar]
- 31. Hayreh SS,, Baines JA. Occlusion of the posterior ciliary artery. 3. Effects on the optic nerve head. Br J Ophthalmol. 1972; 56: 754–764. [DOI] [PMC free article] [PubMed] [Google Scholar]
- 32. Arnold AC,, Hepler RS. Fluorescein angiography in acute nonarteritic anterior ischemic optic neuropathy. Am J Ophthalmol. 1994; 117: 222–230. [DOI] [PubMed] [Google Scholar]
- 33. Rootman J,, Butler D. Ischaemic optic neuropathy—a combined mechanism. Br J Ophthalmol. 1980; 64: 826–831. [DOI] [PMC free article] [PubMed] [Google Scholar]
- 34. Lieberman MF,, Shahi A,, Green WR. Embolic ischemic optic neuropathy. Am J Ophthalmol. 1978; 86: 206–210. [DOI] [PubMed] [Google Scholar]
- 35. Quigley HA,, Miller NR,, Green WR. The pattern of optic nerve fiber loss in anterior ischemic optic neuropathy. Am J Ophthalmol. 1985; 100: 769–776. [DOI] [PubMed] [Google Scholar]
- 36. Knox DL,, Kerrison JB,, Green WR. Histopathologic studies of ischemic optic neuropathy. Trans Am Ophthalmol Soc. 2000; 98: 203–220. 220; discussion 21–22. [PMC free article] [PubMed] [Google Scholar]
- 37. Tesser RA,, Niendorf ER,, Levin LA. The morphology of an infarct in nonarteritic anterior ischemic optic neuropathy. Ophthalmology. 2003; 110: 2031–2035. [DOI] [PubMed] [Google Scholar]
- 38. Beck RW,, Servais GE,, Hayreh SS. Anterior ischemic optic neuropathy. IX. Cup-to-disc ratio and its role in pathogenesis. Ophthalmology. 1987; 94: 1503–1508. [PubMed] [Google Scholar]
- 39. Hayreh SS,, Podhajsky PA,, Zimmerman B. Nonarteritic anterior ischemic optic neuropathy: time of onset of visual loss. Am J Ophthalmol. 1997; 124: 641–647. [DOI] [PubMed] [Google Scholar]
- 40. Pomeranz HD,, Smith KH,, Hart WM, Jr,, Egan RA. Sildenafil-associated nonarteritic anterior ischemic optic neuropathy. Ophthalmology. 2002; 109: 584–587. [DOI] [PubMed] [Google Scholar]
- 41. Kim DY,, Silverman RH,, Chan RV,, et al. Measurement of choroidal perfusion and thickness following systemic sildenafil (Viagra®). Acta Ophthalmol. 2013; 91: 183–188. [DOI] [PMC free article] [PubMed] [Google Scholar]
- 42. Grant GP,, Szirth BC,, Bennett HL,, et al. Effects of prone and reverse trendelenburg positioning on ocular parameters. Anesthesiology. 2010; 112: 57–65. [DOI] [PubMed] [Google Scholar]
- 43. Brown JS,, Flitcroft DI,, Ying GS,, et al. In vivo human choroidal thickness measurements: evidence for diurnal fluctuations. Invest Ophthalmol Vis Sci. 2009; 50: 5–12. [DOI] [PMC free article] [PubMed] [Google Scholar]
- 44. Tan CS,, Ouyang Y,, Ruiz H,, Sadda SR. Diurnal variation of choroidal thickness in normal, healthy subjects measured by spectral domain optical coherence tomography. Invest Ophthalmol Vis Sci. 2012; 53: 261–266. [DOI] [PubMed] [Google Scholar]


