

Abstract
Physiological studies have shown that noise-induced sensorineural hearing loss (SNHL) enhances the amplitude of envelope coding in auditory-nerve fibers. As pitch coding of unresolved complex tones is assumed to rely on temporal envelope coding mechanisms, this study investigated pitch-discrimination performance in listeners with SNHL. Pitch-discrimination thresholds were obtained for 14 normal-hearing (NH) and 10 hearing-impaired (HI) listeners for sine-phase (SP) and random-phase (RP) complex tones. When all harmonics were unresolved, the HI listeners performed, on average, worse than NH listeners in the RP condition but similarly to NH listeners in the SP condition. The increase in pitch-discrimination performance for the SP relative to the RP condition (F0DL ratio) was significantly larger in the HI as compared with the NH listeners. Cochlear compression and auditory-filter bandwidths were estimated in the same listeners. The estimated reduction of cochlear compression was significantly correlated with the increase in the F0DL ratio, while no correlation was found with filter bandwidth. The effects of degraded frequency selectivity and loss of compression were considered in a simplified peripheral model as potential factors in envelope enhancement. The model revealed that reducing cochlear compression significantly enhanced the envelope of an unresolved SP complex tone, while not affecting the envelope of a RP complex tone. This envelope enhancement in the SP condition was significantly correlated with the increased pitch-discrimination performance for the SP relative to the RP condition in the HI listeners.
Keywords: envelope enhancement, sensorineural hearing loss, unresolved harmonics, cochlear compression, frequency selectivity
Introduction
Pitch perception and its underlying coding mechanisms have been investigated for decades to understand what information is necessary for the human auditory system to extract pitch (for a review, see de Cheveigné, 2005). Although some studies favored either a place-based (e.g., Goldstein, 1973; Ohm, 1843; Terhardt, 1974; von Helmholtz, 1877; Wightman, 1973) or a temporal approach (e.g., Licklider, 1951; Rutherford, 1886), more recent investigations suggested that both types of cues may be important for pitch coding (e.g., Cedolin & Delgutte, 2005; Heinz, Colburn, & Carney, 2001; Moore, 2003; Shamma & Klein, 2000; Oxenham, Bernstein, & Penagos, 2004).
Numerous studies have focused on the pitch coding mechanisms underlying pitch perception of complex tones (Bernstein & Oxenham, 2003, 2006a, 2008; Carlyon & Shackleton, 1994; Hoekstra & Ritsma, 1977; Houtsma & Smurzynski, 1990; Kaernbach & Bering, 2001; Moore, Glasberg, Flanagan, & Adams, 2006, Moore, Glasberg, & Hopkins, 2006; Moore & Glasberg, 2011; Shackleton & Carlyon, 1994). Different coding mechanisms were suggested for complex tones containing either low-numbered resolved harmonics or high-numbered unresolved components. While resolved components are processed by separate auditory filters and produce distinct ripples in the excitation pattern, neighboring unresolved components are processed within the same auditory filter and their interaction gives rise to a smooth excitation pattern which does not convey place information from which the frequency of individual harmonics can be retrieved (Plack, 2005). As a result, the pitch of resolved complex tones may be retrieved by fine spectral or temporal cues, while the pitch of unresolved complex tones can only be retrieved by the temporal information conveyed by envelope coding (Moore and Moore, 2003).
Sensorineural hearing loss (SNHL) is commonly associated with reduced frequency selectivity (Glasberg & Moore, 1986) and a reduced ability to extract temporal fine structure information (Hopkins & Moore, 2007; Moore, Glasberg, & Hopkins, 2006). However, recent physiological studies in animals showed that noise-induced SNHL increases the temporal precision and the amplitude of envelope coding in single auditory-nerve fibers (Henry, Kale, & Heinz, 2014; Kale & Heinz, 2010). These findings were ascribed to a variety of factors, such as broader auditory filters, a reduction of cochlear compression due to outer hair cell damage, and altered auditory-nerve response temporal dynamics (Scheidt, Kale, & Heinz, 2010). Thus, while fine spectro-temporal cues are disrupted, temporal envelope cues may be enhanced and the relative importance of spectral and temporal cues for pitch processing may be altered in listeners with SNHL. Although several studies reported that hearing-impaired (HI) listeners have disrupted abilities in pitch discrimination of complex tones (Arehart, 1994; Arehart & Burns, 1999; Bernstein & Oxenham, 2006b; Hoekstra & Ritsma, 1977; Moore & Glasberg, 1988; Moore & Peters, 1992; Moore & Moore, 2003), it has been found that the performance of HI listeners is not always disrupted as compared with NH listeners (Moore, 1998).
In fact, while most studies reported a degraded performance of HI listeners in pitch discrimination of stimuli containing low-order harmonics (Arehart, 1994; Bernstein & Oxenham, 2006b; Hoekstra, 1979; Hoekstra & Ritsma, 1977; Moore & Glasberg, 1990; Moore & Peters, 1992), which may be related to a reduced frequency selectivity (Bernstein & Oxenham, 2006b; Moore & Glasberg, 2011), some studies showed a similar performance of HI versus NH listeners for pitch discrimination of unresolved complex tones and also a comparable performance of HI listeners for pitch discrimination of resolved versus unresolved stimuli (Arehart, 1994; Bernstein & Oxenham, 2006b). Since the broadening of auditory filters in HI listeners leads to an increased number of unresolved harmonics as compared with NH listeners, it seems plausible that HI listeners rely more on the temporal information conveyed by the unresolved harmonics, rather than on the fine spectro-temporal information conveyed by the resolved harmonics (Moore & Carlyon, 2005). It is still unclear whether the altered importance of temporal versus spectral cues for pitch discrimination may be additionally due to the suggested enhancement of temporal envelope coding with SNHL (Henry et al., 2014; Kale & Heinz, 2010).
The aim of the present behavioral study was to clarify: (a) whether human listeners with SNHL show an enhancement of temporal envelope coding, (b) if this enhancement is related to the broadening of auditory filters and/or to the reduction of cochlear compression, and (c) how this enhancement affects pitch discrimination of complex tones. Pitch discrimination of complex tones was investigated behaviorally as a function of the fundamental frequency (F0) in NH listeners and listeners with SNHL (Experiment I). Additionally, an amplitude-modulation detection experiment (Experiment II) was performed in the same listeners to assess temporal envelope coding abilities and to estimate individual auditory-filter bandwidths based on detectability of the modulation sidebands. Furthermore, the basilar-membrane input/output function (BM I/O) was estimated for the HI listeners using a forward-masking task (Experiment III), to assess the role of degraded cochlear compression for pitch discrimination of unresolved complex tones. Finally, a simplified peripheral model, adjusted according to the auditory-filter bandwidth and cochlear-compression estimates obtained in Experiments II and III, was used to clarify the role of degraded cochlear compression and filter broadening for pitch-discrimination performance based on the envelope peakiness of the unresolved complexes at the output of the filter.
While in previous studies (e.g., Bernstein & Oxenham, 2006b; Glasberg & Moore, 1989; Hoekstra, 1979; Moore & Glasberg, 1990; Moore & Glasberg, 2011; Moore & Peters, 1992) the individual performance in pitch discrimination was correlated with individual measures of frequency selectivity, the novelty of the current study is that pitch discrimination was further investigated as a potential indicator of temporal envelope processing, on which pitch coding of unresolved complex tones is assumed to rely.
Methods
Listeners and Experimental Setup
Fourteen NH listeners (6 females), aged from 22 to 28 years, and 10 HI listeners (4 females), aged from 65 to 81 years, participated in this study. All NH listeners had hearing thresholds of less than 20 dB hearing level (HL) at all audiometric frequencies between 125 Hz and 8 kHz. The HI listeners had hearing thresholds between 25 and 65 dB HL at the audiometric frequencies between 1 and 4 kHz. The individual hearing thresholds of the HI listeners are reported in Figure 1 and the hearing thresholds at 2 kHz are listed in Table 1. All experiments were carried out monaurally, whereby the NH listeners were tested at their right ear and the HI listeners at their best ear matching the inclusion criteria. All experiments were approved by the Science-Ethics Committee for the Capital Region of Denmark.
Figure 1.
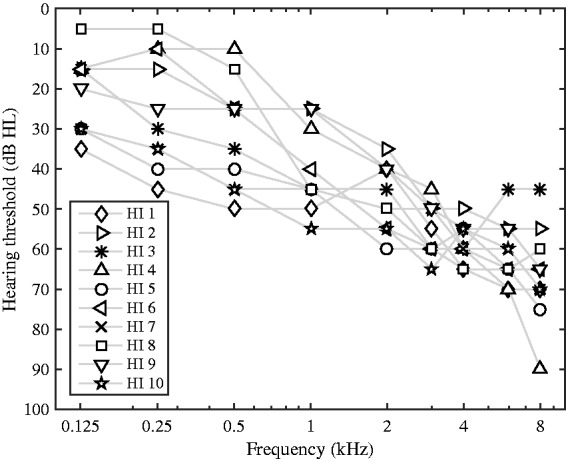
Hearing thresholds in the test ear for the 10 HI listeners who participated in this study. The thresholds were obtained via conventional audiometry.
Table 1.
Summary of Stimulus Levels and Auditory Profiling Measures Estimated for the Mean of NH Listeners and 10 Individual Hearing-Impaired Listeners.
| Listener | Hearing level at 2 kHz (dB HL) | Component level (dB SPL) | Auditory filter bandwidth (Hz) | Compression ratio (CR) |
|---|---|---|---|---|
| Mean NH | <20 | 65 | 325 | 6.0 (*) |
| HI 1 | 40 | 71.2 | 898 | 1.3 |
| HI 2 | 35 | 68.5 | 646 | 2.0 |
| HI 3 | 45 | 73.8 | 753 | 1.7 |
| HI 4 | 40 | 71 | 587 | 2.9 |
| HI 5 | 60 | 80 | 979 | 1.4 |
| HI 6 | 55 | 73 | 915 | 0.8 |
| HI 7 | 50 | 72 | 1,390 | N/A |
| HI 8 | 50 | 77.2 | 968 | 1.4 |
| HI 9 | 40 | 70 | 577 | 2.3 |
| HI 10 | 55 | 80 | 778 | 1.0 |
Experiment I: Pitch-Discrimination of Complex Tones
The ability to discriminate the pitch of resolved and unresolved complex tones was assessed via difference limens for fundamental frequency (F0DLs) as a function of F0.
Procedure
A three-alternative forced choice (3-AFC) paradigm was used in combination with a weighted up-down method (Kaernbach, 1991) to measure the 75% point on the psychometric function. For each trial, two intervals contained a reference complex tone with a fixed fundamental frequency (F0,ref: 100, 125, 150, 175, 200, 250, 300, 400, 500 Hz) and one interval contained a deviant complex tone with a larger F0 (F0,ct). The initial difference in F0 between reference and deviant, ΔF0, (F0,ct − F0,ref)/F0,ref, was set to 20% and was then decreased by a varying step size every second reversal. After each correct answer, ΔF0 was decreased by a factor of 2.23 until the first reversal, by a factor of 1.7 until the third reversal and by a factor of 1.16 for the following seven reversals. For each run, F0,ref was roved from trial to trial from a ±5% uniform distribution around the nominal value. A random level perturbation of ±2.5 dB was applied to each interval, to reduce potential loudness cues. The listener’s task was to select the interval containing the tone with the highest pitch. The threshold for each run was obtained as the geometric mean of the last six reversals. Before the actual test, the listeners performed three repetitions as training. The final value of F0DL was calculated from the mean of three repetitions.
Stimuli
All signals were generated digitally in MATLAB at a sampling rate of 48 kHz and consisted of 300-ms complex tones embedded in threshold equalizing noise (TEN, Moore et al., 2000). For the NH listeners, the sound pressure level (SPL) of the TEN was set to 55 dB per equivalent rectangular bandwidth (ERB, Glasberg & Moore, 1990) to mask the combination tones. For the HI listeners, pure tone detection in quiet was performed at 1.5, 2, and 3 kHz (two repetitions per frequency), and the level of the TEN was set at the maximum threshold measured in this range. The complex tones were created by summing harmonic components either in sine phase (SP) or random phase (RP) to vary the envelope peakiness. Summing the harmonics in SP yields to a peaky signal envelope, while summing the harmonics in RP yields to a much flatter envelope. All HI listeners were tested in the SP and RP conditions, whereas only 9 out of the 14 NH listeners completed the measurements for both conditions. Conditions of varying resolvability were achieved by bandpass filtering the complexes in a high-frequency region (HF, 1500–3500 Hz), with 50 dB/octave slopes, and by varying the F0 (Bernstein & Oxenham, 2006a). To keep the sensation level (SL) of the complex tones approximately constant across listeners, pure tone detection in TEN background was performed at 1.5, 2, and 3 kHz (three repetitions per frequency). For each listener, the mean detection threshold was calculated across the three frequencies, and the level of each component of the complex tone was set at 12.5 dB SL re the mean threshold (obtained levels for each listener are presented in Table 1). The sound stimuli were delivered through headphones (Sennheiser HDA 200).
Experiment Ii: Amplitude-Modulation Detection
The temporal modulation transfer function (TMTF), i.e., the amplitude-modulation (AM) detection threshold as a function of the modulation frequency (fm), was estimated for a 2-kHz carrier. This measure yielded estimates of two quantities: AM detection and auditory-filter bandwidth at 2 kHz. For each listener, the auditory-filter bandwidth was estimated as the fm for which the sidebands became resolved. Five out of the 14 NH and all 10 HI listeners participated in this experiment.
Procedure
A 3-AFC paradigm, in combination with a weighted up-down rule, was used to measure modulation detection thresholds at the 75% point of the psychometric function. For each trial, two intervals contained a pure tone at 2 kHz and one interval contained a sinusoidally amplitude-modulated 2-kHz sinusoid modulated at fm = 25, 50, 100, 150, 200, 300, 400, 500, 800, 1000, or 1500 Hz. The initial modulation depth (20 log m) was set to −10 dB and was then adaptively varied in dB steps with starting and ending values of 5 and 1 dB, respectively. For each interval, the carrier frequency was roved from a ±3% uniform distribution around 2 kHz. A random level perturbation of ±1.5 dB was applied to each interval to minimize loudness cues. The listener’s task was to select the interval containing the modulated tone. The threshold for each run was obtained as the geometric mean of the last six reversals. Before the actual test, the listeners performed one repetition as training. The final threshold was calculated from the mean of three repetitions.
For each listener, the auditory filter bandwidth was estimated as the fm leading to a modulation threshold that was 10.5 dB below the maximum point of the TMTF. This point was selected since it led to an estimated filter bandwidth of 325 Hz at 2 kHz for NH listeners, which corresponds to the mean ERB estimated via the notched-noise method by Bernstein and Oxenham (2006a).
Stimuli
All signals were generated digitally in MATLAB at a sampling rate of 48 kHz and consisted of 300-ms pure tones. The carrier level was set to the same level as the nominal components of the complex tones in the pitch discrimination experiment (i.e., at 12.5 dB SL re the TEN level used in experiment I, see Table 1). No background noise was used. The stimuli were presented via Sennheiser HDA 200 headphones.
Experiment III: Estimates of BM I/O Function and Cochlear Compression
The residual peripheral compression was estimated in 9 out of the 10 HI listeners (all except HI 7) by estimating the individual BM I/O functions at 2 kHz. The BM I/O functions were derived from the temporal masking curves (TMCs) measured via a forward masking experiment for the nine listeners.
Procedure
Masker thresholds were measured as a function of the temporal gap between a 2-kHz probe and a masker tone, either “on-frequency” at 2 kHz or “off-frequency” at 0.6 times the probe frequency. The thresholds were tracked using the Grid method (Fereczkowski, 2015), which reduces the duration of the forward-masking experiment. After three repetitions of the measurement, the on-frequency thresholds were fitted for each listener with either two or single sections, depending on the estimated value of the Bayesian Information Criterion (Schwarz, 1978). This criterion was used to avoid model overfitting. Off-frequency thresholds were fitted with single sections in all cases. The fits were used to infer BM I/O functions following the paradigm of Nelson et al., (2001). The inverse slope of the section comprising the input stimulus level was taken as an estimate of the compression ratio (CR) at 2 kHz.
Stimuli
The masker tone duration was 200 ms, and the probe tone duration was 16 ms. Both were gated with 4-ms raised-cosine onset and offset ramps, hence the lengths of the steady state portions were 192 and 8 ms, respectively. The probe level was set at 10 dB above the absolute probe threshold. The stimuli were generated in MATLAB (44100 Hz sampling rate, 24-bit rate) and presented via Sennheiser HDA 200 headphones.
Modeling the Effects of Cochlear Compression and Frequency Selectivity on Envelope Peakiness
HF-filtered complex tones (F0 = 100 Hz) with harmonics added either in SP or RP were passed through a single fourth-order gammatone filter centred at 2 kHz, which was adjusted in bandwidth to an “average NH listener” as well as to the individual HI listeners according to the estimates from Experiment II (listed in Table 1). The signal at the output of the filter was then compressed according to , where CR denotes the individual compression ratios estimated from Experiment III (see Table 1). The Hilbert envelope of the compressed signal was obtained and band-limited using a first-order low-pass filter with a cut-off frequency of 150 Hz (Ewert & Dau, 2000; Kohlrausch et al., 2000). As a descriptor of the peakiness of the resulting envelope E, the modulation power of the output signal was calculated as the ratio between the envelope power and the envelope DC,
where N denotes the number of samples. The simulations for the RP condition were iterated 100 times in order for the random process to converge. The obtained values were then averaged across iterations. As a result, values were obtained for a NH profile and the individual HI profiles except for HI 7 (cf. Table 1). For each auditory profile, the modulation power was obtained for the SP and RP complex tones. Finally, the modulation power ratio, , was calculated.
Results
Experiment I: Pitch-Discrimination of Complex Tones
Figure 2 (top panels) depicts the mean pitch-discrimination thresholds for NH listeners (black solid symbols), as well as the individual thresholds for HI listeners (open symbols), for the SP condition (left panel), the RP condition (middle panel) and the ratio between the RP and the SP thresholds (right panel). The thresholds for the SP and RP conditions showed similar trends for the NH listeners, whereby F0DLs decreased with increasing F0. A mixed-model ANOVA on the log-transformed F0DLs with F0 and phase as fixed effects and subjects as a random effect confirmed a significant effect of F0 for the NH listeners, F(8, 176) = 55.61, p < .001, as well as a significant interaction of F0 and phase, F(8, 176) = 3.05, p = .003. These findings are in agreement with previously reported pitch-discrimination thresholds (e.g., Bernstein & Oxenham, 2006b), where the improvement in performance with increasing F0 was thought to reflect the progressive increase of the resolvability of the harmonics or the increase in the effectiveness of temporal fine-structure cues (Moore et al., 2006a). Additionally, the SP condition yielded lower thresholds as compared with the RP condition at low F0s (i.e., in the presence of unresolved harmonics). This benefit in performance for the SP condition relative to the RP condition (referred to as F0DL ratio, right panels in Figure 2) was, on average, of about a factor of 1.4 for F0s below 200 Hz for the nine NH listeners who completed both measurements. No significant phase effects were found for F0s equal or larger than 200 Hz (mean F0DL ratio of 0.95), consistent with the presence of resolved harmonics in the NH listeners above this F0 for complex tones filtered between 1.5 and 3.5 kHz (e.g., Bernstein & Oxenham 2006a, Bianchi et al., 2016).
Figure 2.

Pitch-discrimination thresholds for the SP condition (left panels) and RP condition (middle panels). The right panels depict the ratio of the RP and SP thresholds (F0DL ratio). The solid symbols depict the mean results for 14 NH listeners in the left panels and 9 NH listeners in the middle and right panels. The open symbols depict the individual results (top panels, same symbols as in Figure 1) and the mean results (bottom panels) for the 10 HI listeners. Error bars depict the standard error of the mean. The gray-shaded region highlights the conditions (at F0s of 100 and 125 Hz) for which the harmonics are considered to be unresolved.
The mean performance of the 10 HI listeners was generally worse than that of the NH listeners. In fact, although some HI listeners showed a better performance than the NH listeners at low F0s, the thresholds for the HI listeners were, on average, larger than the thresholds for NH listeners (see Figure 2, left and middle bottom panels). A mixed-model ANOVA with F0, group and phase as fixed factors and listeners as a random factor nested in group confirmed a significant effect of the fixed factors, (F0: F(8,335) = 29.18, p < .001; group: F(1, 335) = 22.25, p < .001; phase: F(1, 335) = 42.11, p < .001), as well as a significant interaction of group and phase, F(1, 335) = 39.22, p < .001, and of group and F0, F(8, 335) = 10.46, p < .001). The gray-shaded area in Figure 2 depicts the two conditions (at F0s of 100 and 125 Hz) for which the harmonics could be considered completely unresolved, that is, when the lowest harmonic number was larger than or equal to 12 (Moore & Moore, 2003). For these two unresolved conditions, a mixed-model ANOVA (fixed factors: group and F0; listeners as a random factor nested in group) revealed no significant difference between the thresholds of the NH versus the HI listeners for the SP condition (group effect: F(1, 47) = 1.53, p = .23), while a significant difference was present for the RP condition (group effect: F(1, 37) = 9.44, p = .007). Two post hoc one-tailed t tests using Bonferroni-adjusted alpha levels of 0.025 revealed significantly larger thresholds for the HI versus the NH listeners for both unresolved RP conditions (100 Hz: p = .002; 125 Hz: p = .02). Thus, these findings revealed that HI listeners performed similarly to NH listeners in pitch discrimination of unresolved complex tones for the SP condition and worse than NH listeners for the RP condition. Additionally, while NH listeners showed a moderate benefit in performance for the SP condition relative to the RP condition (mean F0DL ratio of 1.3 for the two unresolved conditions, Figure 2 right panels), HI listeners showed a larger benefit, on average, of about a factor of 2.6 for the unresolved conditions.
Experiment II: Amplitude-Modulation Detection
Figure 3(a) depicts the amplitude-modulation detection thresholds for the individual HI listeners (open symbols), as well as the mean modulation thresholds for the five NH listeners who completed Experiment II (filled squares). The modulation thresholds for the NH listeners were independent of fm up to a modulation rate of 200 Hz. At modulation rates above 200 Hz, the thresholds decreased with increasing fm, due to detection of the resolved sidebands (Ewert & Dau, 2000; Kohlrausch et al., 2000). For the HI listeners, the TMTFs were flat up to modulation rates of about 100 Hz. At these low fms, thresholds for most of the HI listeners were lower than for the NH listeners, indicating a higher sensitivity to detect amplitude modulations. A one-way unbalanced ANOVA on the thresholds up to 100 Hz confirmed a significant group effect, F(1, 44) = 5.98; p = .019, see mean thresholds on Figure 3(b)). Above 100 Hz, thresholds increased up to modulation rates of about 400 Hz (or higher for some HI listeners) due to central limitations of the auditory system to detect fast envelope fluctuations (Ewert & Dau, 2000; Kohlrausch et al., 2000). After the maximum point of the TMTF, the thresholds of the HI listeners decreased at different rates as the sidebands became resolved. The dotted vertical lines in Figure 3(a) depict the individual filter bandwidths, estimated as the fm leading to a modulation threshold (on the fitted curve) that was 10.5 dB below the maximum point of the TMTF. For the HI listeners, the estimated filter bandwidths ranged from 577 Hz (HI 9) to 1390 (HI 7). The individual values are presented in Table 1.
Figure 3.

(a) Amplitude-modulation detection thresholds for a 2-kHz sinusoidal carrier as a function of the modulation frequency for the 10 HI listeners (same open symbols as in Figure 1; error bars depict the standard deviation across the three repetitions of each experimental condition). The mean thresholds for five NH listeners are also depicted in each panel for a comparison purpose (filled squares; error bars depict the standard error of the mean). The dashed vertical lines depict the estimated filter bandwidth as the fm leading to a modulation threshold that was 10.5 dB below the maximum point of the TMTF (the obtained bandwidths are listed in Table 1). (b) Mean thresholds for NH (closed squares) and HI (open diamonds) listeners. Error bars depict the standard error of the mean.
Experiment III: Estimates of BM I/O Function and Cochlear Compression
Figure 4 depicts the TMC thresholds (on-frequency masker: open symbols; off-frequency masker: filled circles) measured in nine HI listeners, together with the corresponding fits. The measured masking thresholds increased with increasing masker-probe gap, consistent with the TMC data reported in the literature (e.g., Nelson et al., 2001). For most listeners, the fitted sections to the on-frequency TMCs (solid lines) were steeper than the corresponding off-frequency fits (dashed lines), while for other listeners (HI 6, HI 10), the on- and off-frequency fits showed similar slopes. This is consistent with some residual peripheral compression affecting the on-frequency maskers in case of the former listeners, but not the latter.
Figure 4.

Temporal masking curves (TMCs) for nine HI listeners (HI 7 not measured), together with the corresponding fits. The on- and off-frequency thresholds are depicted with open and filled circles, respectively. The fits to the on-frequency data are shown with a solid line while the single-section fits to the off-frequency data are shown with a dashed line.
Figure 5 depicts the BM I/O functions (solid lines) estimated for the same nine listeners from the TMC fits. The linear reference is indicated by the dashed lines. The portions of the BM I/O functions that are shallower than the linear reference indicate the presence of peripheral compression in a given listener. The BM I/O functions represent the off-frequency TMC threshold on the ordinate (i.e., the BM output level) versus the on-frequency TMC threshold on the abscissa (i.e., the BM input level) for each given masker-probe gap. Thus, as the BM I/O functions were estimated only in the range where both on- and off-frequency TMCs were measured, the obtained BM input-level range differed among listeners (i.e., from 12 dB for HI 3 to 34 dB for HI 1 and HI 4). The individual peripheral compression at 2 kHz was estimated as the inverse of the slope (i.e., the compression ratio, CR, see Table 1) of the fitted section comprising the input stimulus level (depicted by the asterisks in Figure 5). This level was estimated for each listener as the overall level of a HF-filtered complex tone (at F0 = 100 Hz), at the output of an individually adjusted gammatone filter centered at 2 kHz.
Figure 5.

BM I/O functions (solid lines) estimated from the TMCs for nine HI listeners (HI 7 not measured). The dashed line depicts the linear reference, that is, the BM I/O function assuming absent peripheral compression. The asterisks show the estimated levels of a HF-filtered complex tone at F0 of 100 Hz at the output of individually adjusted auditory filters at 2 kHz. The peripheral compression was estimated at the levels marked by the asterisks and the individual values are listed in Table I.
Effects of Cochlear Compression and Frequency Selectivity on Pitch Discrimination
As influencing factors such as musical training and individual cognitive resources, as well as individual limitations (e.g., neural synchrony, internal noise level) are likely to affect the overall pitch-discrimination performance, the ratio between the RP and SP thresholds (F0DL ratio) was calculated for the individual HI listeners as well as for the mean of the NH listeners (Figure 2, right panels). The F0DL ratio quantifies the relative increase in pitch-discrimination performance for the unresolved SP complex tones with respect to their RP counterparts and allows for a comparison across listeners that is unbiased by the individual factors. Figure 6 shows the mean F0DL ratio for the two unresolved conditions (at F0s of 100 and 125 Hz) as a function of the estimated reduction of cochlear compression (1/CR, calculated from Experiment III at the level indicated by the asterisk in Figure 5; left panel in Figure 6) and filter bandwidth (estimates from Experiment II; right panel in Figure 6). The increase of the F0DL ratios for the HI listeners was significantly positively correlated with the estimated loss of cochlear compression (left panel in Figure 6: R2 = 0.56, p = .002). Thus, the lower the residual cochlear compression the larger was the increase in pitch-discrimination performance for the SP relative to the RP complex tones. No significant correlation was found between F0DL ratio and auditory filter bandwidth (R2 = 0.03, p = .645; right panel in Figure 6). Overall, these findings suggest that loss of cochlear compression was the dominant factor increasing the pitch-discrimination performance for the unresolved SP complex tones relative to their RP counterparts.
Figure 6.

Mean F0DL ratios for the two unresolved conditions (at F0s of 100 and 125 Hz) as a function of the estimated loss of cochlear compression (left panel) and filter bandwidth (right panel). Solid symbols depict the mean results for the nine NH listeners that measured both SP and RP conditions. The open symbols (same symbols as in Figure 1) depict the individual results for HI listeners. Error bars depict the standard error of the mean. The correlations were carried out only across the data for the HI listeners.
Modeling the Effects of Cochlear Compression and Frequency Selectivity on Envelope Peakiness
The left panels in Figure 7 depict the modulation power of the SP (open symbols) and RP (closed symbols) complex tones, estimated at the output of a peripheral model individually adjusted according to the auditory profiles of the nine HI and the mean of the NH listeners. In the model, three simulations were run to clarify the relative effect of auditory-filter bandwidth and cochlear compression on the envelope representation of unresolved complex tones. In a first simulation (top panels), auditory-filter bandwidth was varied according to the estimates from Experiment II, while cochlear compression was fixed at a common value for NH listeners (CR = 6, Lopez-Poveda et al., 2003). The simulation revealed no effect of filter bandwidth on the modulation power of either the SP or RP signals. In a second simulation (middle panels), cochlear compression was varied according to the estimates from Experiment III, while filter bandwidth was fixed at the value of 325 Hz estimated for NH listeners (Experiment II). Reducing cochlear compression yielded an increase in the modulation power of the SP complex tone, indicating an increase of the envelope peakiness, while hardly affecting the modulation power of the RP complex tones. In fact, since compression is a non-linear operation, it mainly reduces the modulation depth of peaky signals. Thus, a reduction of compression yielded a much larger enhancement of the modulation depth for the SP than for the RP stimuli. In a third simulation (bottom panels), both filter bandwidth and cochlear compression were varied according to the estimates from Experiments II and III, respectively, yielding qualitatively similar results as for the second simulation. While filter bandwidth had no effect on the first simulation (i.e., when the CR was fixed at a high value), in the third simulation filter bandwidth had a small but consistent effect in increasing the modulation power by about a factor of 1.2 when the CR was close to 1 (i.e., in case of a large loss of compression: diamond, star, left-pointing triangle), as a consequence of more harmonic components passing through the filter.
Figure 7.

Left panels: Envelope modulation power of a complex tone (F0 = 100 Hz) with unresolved harmonics added either in SP (open symbols) or in RP (closed symbols) at the output of a simplified peripheral model. Error bars for the RP condition depict the standard deviations across the 100 iterations. Top panels: the gammatone filter bandwidth was varied according to the individually estimated filter bandwidths from Experiment II, while normal-hearing compression was applied (CR = 6); middle panels: cochlear compression was varied according to the estimates from Experiment III, while filter bandwidth was fixed at 325 Hz; bottom panels: both cochlear compression and filter bandwidth were varied. Right panels: correlations between the modulation power ratio (SP/RP) and the behavioral results of Experiment I (mean F0DL ratio for the unresolved conditions). The correlations were carried out only across the HI data.
Thus, these results demonstrate that the modulation power of the RP complex tones was low (only slightly above 1, which would imply a flat envelope) and almost independent of both filter bandwidth (top left panel in Figure 7) and compression (middle left panel in Figure 7). In contrast, the modulation power of the SP complex tone increased with increasing loss of compression (almost perfectly linear increase, middle left panel) and, to a minor extent, when increasing filter bandwidth (only at CRs close to 1). Thus, the envelope peakiness of the SP complex tone was increased as compared with the RP envelope up to a factor of 3, mostly as a result of reduced compression.
This envelope enhancement was estimated as the ratio of the modulation power for the SP complex versus the RP complex (Pmod ratio). The obtained Pmod ratio was then compared with the behavioral F0DL ratio (right panels of Figure 7). While no correlation was found when only filter bandwidth was varied (top right panel: R2 = 0.19, p = .24), a significant correlation was obtained when the individually adjusted loss of compression was introduced to the model (middle right panel: R2 = 0.57, p = .019). Additionally, adjusting the filter bandwidth did not increase the correlation significantly (bottom right panel: R2 = 0.58, p = .016). Thus, the modeling outcomes suggested that loss of compression was the dominant factor in enhancing the envelope peakiness of an unresolved SP complex tone relative to its RP counterpart. This enhancement was significantly correlated with the benefit in pitch-discrimination performance for the SP relative to the RP condition.
Discussion
Relation Between Behavioral Results and Envelope Representation
The hypothesis of the current study was that if the envelope representation is enhanced for listeners with SNHL (Henry et al., 2014; Kale & Heinz, 2010), pitch cues for unresolved complex tones should also be enhanced if one assumes an envelope coding mechanism for pitch extraction of unresolved harmonics. The pitch-discrimination thresholds measured in the present study (Experiment I) revealed that the HI listeners performed worse than the NH listeners for the RP unresolved conditions (gray-shaded area on middle panels in Figure 2). However, the performance of the HI listeners was similar to that of the NH listeners when the harmonics were added in SP (gray-shaded area on left panels in Figure 2). This finding is in agreement with previous studies showing similar performance of the HI and NH listeners for pitch discrimination of complex tones with unresolved harmonics (Arehart, 1994, Bernstein & Oxenham, 2006b) and with stronger phase effects for the HI than for the NH listeners (e.g., Bernstein & Oxenham, 2006b; Moore & Carlyon, 2005; Moore & Peters, 1992). In fact, in the presence of a peaky envelope (SP condition), the pitch-discrimination performance of NH listeners increased, on average, by a factor of 1.3 relative to the RP condition (for the two unresolved conditions), while the performance of the HI listeners increased, on average, by a factor of 2.6. Thus, although the overall performance of the HI listeners was not better than that of the NH listeners, these findings suggest that HI listeners benefited more from a peaky signal relative to a signal with a flatter envelope in terms of pitch discrimination than NH listeners did. Hence, the behavioral findings of Experiment I do not rule out an enhanced envelope representation following SNHL. In fact, an envelope enhancement at the output of peripheral stages of the auditory system might be counteracted by other factors limiting the behavioral performance of the HI listeners (e.g., disrupted temporal fine-structure cues, degradation of auditory-nerve coding, higher internal noise level, age-related cognitive deficits). In agreement with this hypothesis, the results of Experiment II revealed significantly lower (better) modulation detection thresholds for the HI listeners (up to 100 Hz) as compared with NH listeners, consistent with previous findings (Moore & Glasberg, 2001; Moore et al., 1996). Thus, when amplitude-modulation detection is based on temporal envelope cues (i.e., when the sidebands are not resolved), the HI listeners showed a higher sensitivity in detecting amplitude modulations imposed on a sinusoidal carrier as compared with NH listeners.
While the larger benefit of HI listeners in pitch-discrimination performance for the SP relative to the RP condition might be a consequence of more harmonics being processed within broader than normal auditory filters, the lower thresholds obtained in Experiment II for HI listeners cannot be explained by the larger number of harmonics within the same auditory filter. In fact, since the sinusoidally amplitude-modulated tones of Experiment II contained only three frequency components (fc − fm, fc, fc + fm), broader than normal auditory filters would not lead to additional frequency components passing through the filter. At the very least, the behavioral findings from Experiments I and II suggest that changes in the internal envelope representation that cannot be solely explained by broader auditory filters occurred in listeners with SNHL.
F0DL Ratio and Individual Measures of Cochlear Compression and Filter Bandwidth
To quantify the changes in the internal envelope representation, the increase in pitch-discrimination performance for the SP condition relative to the RP condition (F0DL ratio) was considered for the unresolved conditions as an indicator of envelope coding independent of musical abilities and other individual factors. Nine out of 10 HI listeners exhibited F0DL ratios larger than those observed in the NH listeners for the two unresolved conditions (at F0s of 100 and 125 Hz). An increase of the F0DL ratio alone does not necessarily imply an enhancement of envelope coding following SNHL. The larger ratio represents a difference in the salience of temporal envelope cues between the SP and RP complexes, but whether this is the result of an enhancement of envelope cues in the SP condition or a worsening of envelope cues in the RP condition cannot be clarified solely based on the behavioral data. The correlations between the F0DL ratios and the individual estimates of cochlear compression and filter bandwidth (Figure 6) revealed a significant correlation for the HI listeners between the increase in the F0DL ratio and the reduction of cochlear compression, while no correlation was found with auditory-filter bandwidth. Thus, reducing cochlear compression could account for the increase in performance for the SP condition relative to the RP condition in listeners with SNHL.
Figure 8 depicts the correlation between the estimates of auditory-filter bandwidth and cochlear compression obtained from Experiments II and III, respectively. Although not significant, there was a trend of increasing bandwidth with increasing loss of compression (R2 = 0.44, p = .053). Cochlear compression and auditory-filter bandwidth were found to be physiologically linked and dependent on the cochlear active mechanisms (Ruggero, 1992). Indeed, an earlier psychoacoustic study (Moore et al., 1999) found a significant correlation between filter bandwidth, using the notched-noise method (e.g., Patterson, 1976), and estimated compression, using the growth-of-masking method (Oxenham & Plack, 1997). Thus, the lack of a significant correlation between the two estimates might be due to the use of AM-detection as a measure of frequency selectivity. This is discussed in more detail further later.
Figure 8.
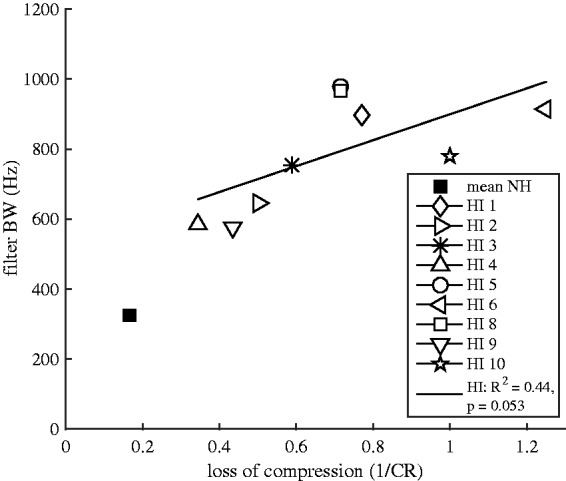
Correlation between the estimated auditory-filter bandwidth and loss of cochlear compression across the nine HI listeners (open symbols) that participated in both Experiments II and III.
Modeling Results and Envelope Enhancement
Although auditory-filter bandwidth and cochlear compression are physiologically linked, they may have different effects on the envelope at the output of the auditory filters. Therefore, a simplified peripheral model that considers auditory-filter bandwidth and cochlear compression as independent factors was used to qualitatively describe the relative effect of one factor versus the other on the envelope representation of the unresolved complex tones.
The modulation power of a complex tone at the output of the model was used as an indicator of the salience of temporal envelope cues for pitch discrimination of unresolved complexes. The assumption was that the higher the modulation power (i.e., the peakier the envelope), the larger was the salience of temporal pitch cues. Thus, a higher modulation power would correspond to an improved performance in pitch discrimination (i.e., a lower behavioral threshold). The simulation outcomes revealed that reducing cochlear compression and, to a minor extent, increasing the filter bandwidth led to an increase in the modulation power for the unresolved SP complex tone, with reduction of compression clearly being the dominant factor (left panels in Figure 7). In contrast, the modulation power for the RP complex did not vary with either reducing compression or increasing filter bandwidth. Thus, the modeling outcomes suggest that the envelope cues for a RP complex tone may be similar for HI and NH listeners at the output of peripheral stages of the auditory system (provided that audibility is compensated for). Assuming similar processes for NH and HI listeners after the cochlear stages and assuming a temporal-envelope pitch coding mechanism for unresolved complex tones, one would predict similar performance for the RP condition in listeners with SNHL as compared with NH listeners. However, the behavioral performance of the HI listeners for the RP condition was, on average, worse than for NH listeners. This finding suggests that other individual factors than outer-hair cell damage might limit the performance of the HI listeners for both SP and RP conditions (e.g., disrupted temporal fine-structure cues, degradation of auditory-nerve coding, internal noise, age-related cognitive deficits). Thus, a possible enhancement of envelope cues following SNHL cannot be revealed based on a comparison of pitch-discrimination thresholds in HI versus NH listeners, but rather on a comparison between SP versus RP thresholds, whereby the RP thresholds represent the baseline condition in each listener.
The ratio between the modulation power (Pmod ratio) for the SP condition (i.e., where an increase in the envelope peakiness occurred) and the modulation power for the RP condition (i.e., where no increase occurred) was used as an estimate of temporal envelope coding enhancement. The significance in the correlation between the F0DL ratio and the Pmod ratio (right panels in Figure 7) suggests that the increase in pitch-discrimination performance for the SP relative to the RP condition (i.e., the F0DL ratio) can be accounted for by the enhanced envelope for the SP complex tone as compared with the RP baseline condition. Thus, the modeling outcomes revealed that the larger the peripheral loss of cochlear compression, the larger was the enhancement of temporal cues for the SP condition at the output of peripheral stages of the auditory system.
AM-Detection as a Measure of Frequency Selectivity
The lack of correlation between the F0DL ratio and the estimates of auditory-filter bandwidth (Figure 6) may be related to the use of an amplitude-modulation detection task to estimate frequency selectivity. Auditory-filter bandwidth was estimated as the fm where the detection of sidebands was the dominant cue. Thus, the threshold at this fm was probably determined by the upper slope of a filter centered near the lower sideband (Kohlrausch et al., 2000; Sek & Moore, 1994), which in some cases was remote from the center frequency of the stimulus. Although these estimates may not provide a direct measure of frequency selectivity at 2 kHz, but possibly at a lower frequency, they were consistent with the estimates of cochlear compression at 2 kHz (see Figure 8). In fact, although not significant, there was a trend of increasing bandwidth with increasing loss of compression. The lack of correlation between the F0DL ratios and the estimates of auditory-filter bandwidth was, nevertheless, supported by the simulation outcomes, where no or little effect of bandwidth on the envelope peakiness was observed for the SP condition (see Figure 7).
Conclusion
Overall, the results of the pitch-discrimination experiment revealed that the performance of the HI listeners was, on average, similar to that of the NH listeners for the SP unresolved complex tones, and worse for the RP complexes. Thus, the increase in performance for the SP condition relative to its RP counterpart (F0DL ratio) was significantly larger in the HI listeners as compared with the NH listeners, indicating larger benefits in the presence of a peaky envelope (i.e., the SP condition). This benefit was significantly correlated with the decrease in residual cochlear compression estimated in the same HI listeners. Moreover, the outcomes of a simplified peripheral model revealed that loss of cochlear compression was the dominant factor in enhancing the envelope peakiness of the SP but not RP unresolved complex tones. This enhancement in the internal envelope representation of unresolved complex tones with harmonics added in SP could account for the increase in pitch-discrimination performance for the SP relative to the RP condition in listeners with SNHL. Overall, the behavioral results of the present study, together with the modeling outcomes, suggest that listeners with SNHL may have enhanced temporal envelope cues at the output of peripheral stages of the auditory system, primarily as a consequence of a reduced cochlear compression.
Acknowledgments
The authors would like to thank Andrew Oxenham and the two anonymous reviewers for their constructive feedback.
Declaration of Conflicting Interests
The authors declared no potential conflicts of interest with respect to the research, authorship, and/or publication of this article.
Funding
The authors disclosed receipt of the following financial support for the research, authorship, and/or publication of this article: This work was supported by the Technical University of Denmark.
References
- Arehart K. H. (1994) Effects of harmonic content on complex-tone fundamental-frequency discrimination in hearing-impaired listeners. Journal of the Acoustical Society of America 95: 3574–3585. [DOI] [PubMed] [Google Scholar]
- Arehart K. H., Burns E. M. (1999) A comparison of monotic and dichotic complex-tone pitch perception in listeners with hearing loss. Journal of the Acoustical Society of America 106: 993–997. [DOI] [PubMed] [Google Scholar]
- Bernstein J. G., Oxenham A. J. (2003) Pitch discrimination of diotic and dichotic tone complexes: Harmonic resolvability or harmonic number? Journal of the Acoustical Society of America 113: 3323–3334. [DOI] [PubMed] [Google Scholar]
- Bernstein J. G., Oxenham A. J. (2006a) The relationship between frequency selectivity and pitch discrimination: Effects of stimulus level. Journal of the Acoustical Society of America 120: 3916–3928. [DOI] [PubMed] [Google Scholar]
- Bernstein J. G., Oxenham A. J. (2006b) The relationship between frequency selectivity and pitch discrimination: Sensorineural hearing loss. Journal of the Acoustical Society of America 120: 3929–3945. [DOI] [PubMed] [Google Scholar]
- Bernstein J. G., Oxenham A. J. (2008) Harmonic segregation through mistuning can improve fundamental frequency discrimination. Journal of the Acoustical Society of America 124: 1653–1667. [DOI] [PMC free article] [PubMed] [Google Scholar]
- Bianchi F., Santurette S., Wendt D., Dau T. (2016) Pitch discrimination in musicians and non-musicians: Effects of harmonic resolvability and processing effort. Journal of the Association for Research in Otolaryngology: JARO 17: 69–79. [DOI] [PMC free article] [PubMed] [Google Scholar]
- Carlyon R. P., Shackleton T. M. (1994) Comparing the fundamental frequencies of resolved and unresolved harmonics: Evidence for two pitch mechanisms. Journal of the Acoustical Society of America 95: 3541–3554. [DOI] [PubMed] [Google Scholar]
- Cedolin L., Delgutte B. (2005) Representations of the pitch of complex tones in the auditory nerve. In: Pressnitzer D., de Cheveigné A., McAdams S., Collet L. (eds) Auditory signal processing: Physiology, psychoacoustics and models, New York, NY: Springer, pp. 107–116. [Google Scholar]
- de Cheveigné A. (2005) Pitch perception models. In: Plack C. J., Oxenham A. J., Fay R., Popper A. N. (eds) Pitch: Neural coding and perception, New York, NY: Springer, pp. 169–233. [Google Scholar]
- Ewert S., Dau T. (2000) Characterizing frequency selectivity for envelope fluctuations. Journal of the Acoustical Society of America 108: 1181–1196. [DOI] [PubMed] [Google Scholar]
- Fereczkowski, M. (2015). Time-efficient behavioral estimates of cochlear compression (Doctoral thesis). Technical University of Denmark, Kongens Lyngby.
- Glasberg B. R., Moore B. C. J. (1986) Auditory filter shapes in subjects with unilateral and bilateral cochlear impairments. Journal of the Acoustical Society of America 79: 1020–1033. [DOI] [PubMed] [Google Scholar]
- Glasberg B. R., Moore B. C. J. (1989) Psychoacoustic abilities of subjects with unilateral and bilateral cochlear hearing impairments and their relationship to the ability to understand speech. Scandinavian Audiology Supplementum 32: 1–25. [PubMed] [Google Scholar]
- Glasberg B. R., Moore B. C. J. (1990) Derivation of auditory filter shapes from notched-noise data. Hearing Research 47: 103–138. [DOI] [PubMed] [Google Scholar]
- Goldstein J. L. (1973) An optimum processor theory for the central formation of the pitch of complex tones. Journal of the Acoustical Society of America 54: 1496–1516. [DOI] [PubMed] [Google Scholar]
- Heinz M. G., Colburn H. S., Carney L. H. (2001) Evaluating auditory performance limits: I. One-parameter discrimination using a computational model for the auditory nerve. Neural Computation 13: 2273–2316. [DOI] [PubMed] [Google Scholar]
- Henry K. S., Kale S., Heinz M. G. (2014) Noise-induced hearing loss increases the temporal precision of complex envelope coding by auditory-nerve fibers. Frontiers in Systems Neuroscience 8: 20. [DOI] [PMC free article] [PubMed] [Google Scholar]
- Hoekstra, A. (1979). Frequency discrimination and frequency analysis in hearing (PhD. Thesis). Institute of Audiology, University Hospital, Groningen, The Netherlands.
- Hoekstra A., Ritsma R. J. (1977) Perceptive hearing loss and frequency selectivity. In: Evans E. F., Wilson J. P. (eds) Psychophysics and physiology of hearing, London, England: Academic, pp. 263–271. [Google Scholar]
- Hopkins K., Moore B. C. J. (2007) Moderate cochlear hearing loss leads to a reduced ability to use temporal fine structure information. Journal of the Acoustical Society of America 122: 1055–1068. [DOI] [PubMed] [Google Scholar]
- Houtsma A. J. M., Smurzynski J. (1990) Pitch identification and discrimination for complex tones with many harmonics. Journal of the Acoustical Society of America 87: 304–310. [Google Scholar]
- Kaernbach C. (1991) Simple adaptive testing with the weighted up-down method. Perception & Psychophysics 49: 227–229. [DOI] [PubMed] [Google Scholar]
- Kaernbach C., Bering C. (2001) Exploring the temporal mechanism involved in the pitch of unresolved harmonics. Journal of the Acoustical Society of America 110: 1039–1048. [DOI] [PubMed] [Google Scholar]
- Kale S., Heinz M. G. (2010) Envelope coding in auditory nerve fibers following noise-induced hearing loss. Journal of the Association for Research in Otolaryngology: JARO 11: 657–673. [DOI] [PMC free article] [PubMed] [Google Scholar]
- Kohlrausch A., Fassel R., Dau T. (2000) The influence of carrier level and frequency on modulation and beat-detection thresholds for sinusoidal carriers. Journal of the Acoustical Society of America 108(2): 723–734. [DOI] [PubMed] [Google Scholar]
- Licklider J. C. R. (1951) A duplex theory of pitch perception. Experientia 7: 128–133. [DOI] [PubMed] [Google Scholar]
- Lopez-Poveda E. A., Plack C. J., Meddis R. (2003) Cochlear nonlinearity between 500 and 8000 Hz in listeners with normal hearing. Journal of the Acoustical Society of America 113(2): 951–960. [DOI] [PubMed] [Google Scholar]
- Moore B. C. J. (1998) Cochlear hearing loss, London, England: Whurr Publisher Ltd. [Google Scholar]
- Moore B. C. J. (2003) An introduction to the psychology of hearing, 5th ed London, England: Academic Press. [Google Scholar]
- Moore B. C. J., Carlyon R. P. (2005) Perception of pitch by people with cochlear hearing loss and by cochlear implant users. In: Plack C. J., Oxenham A. J., Fay R. R., Popper A. N. (eds) Pitch perception, New York, NY: Springer, pp. 234–277. [Google Scholar]
- Moore B. C. J., Glasberg B. R. (1988) Pitch perception and phase sensitivity for subjects with unilateral and bilateral cochlear hearing impairments. In: Quaranta A. (ed.) Clinical audiology, Bari, Italy: Laterzapp, pp. 104–109. [Google Scholar]
- Moore B. C. J., Glasberg B. R. (1990) Frequency discrimination in subjects with cochlear hearing loss and its effects on pitch discrimination and phase sensitivity. In: Grandori F., Cianfrone G., Kemp D. T. (eds) Advances in audiology, Vol. 7. Cochlear mechanisms and otoacoustic emissions, Basel, Switzerland: Karger, pp. 187–200. [Google Scholar]
- Moore B. C. J., Glasberg B. R. (2001) Temporal modulation transfer functions obtained using sinusoidal carriers with normally hearing and hearing-impaired listeners. Journal of the Acoustical Society of America 110(2): 1067–1073. [DOI] [PubMed] [Google Scholar]
- Moore B. C. J., Glasberg B. R. (2011) The effect of hearing loss on the resolution of partials and fundamental frequency discrimination. Journal of the Acoustical Society of America 130(5): 2891–2901. [DOI] [PubMed] [Google Scholar]
- Moore B. C. J., Glasberg B. R., Flanagan H. J., Adams J. (2006) Frequency discrimination of complex tones; assessing the role of component resolvability and temporal fine structure. Journal of the Acoustical Society of America 119: 480–490. [DOI] [PubMed] [Google Scholar]
- Moore B. C. J., Glasberg B. R., Hopkins K. (2006) Frequency discrimination of complex tones by hearing-impaired subjects: Evidence for loss of ability to use temporal fine structure information. Hearing Research 222: 16–27. [DOI] [PubMed] [Google Scholar]
- Moore B. C. J., Huss M., Vickers D. A., Glasberg B. R., Alcantara J. I. (2000) A test for the diagnosis of dead regions in the cochlea. British Journal of Audiology 34: 205–224. [DOI] [PubMed] [Google Scholar]
- Moore B. C. J., Moore G. A. (2003) Discrimination of the fundamental frequency of complex tones with fixed and shifting spectral envelopes by normally hearing and hearing-impaired subjects. Hearing Research 182: 153–163. [DOI] [PubMed] [Google Scholar]
- Moore B. C. J., Peters R. W. (1992) Pitch discrimination and phase sensitivity in young and elderly subjects and its relationship to frequency selectivity. Journal of the Acoustical Society of America 91: 2881–2893. [DOI] [PubMed] [Google Scholar]
- Moore B. C. J., Vickers D. A., Plack C. J., Oxenham A. J. (1999) Inter-relationship between different psychoacoustic measures assumed to be related to the cochlear active mechanism. Journal of the Acoustical Society of America 106: 2761–2778. [DOI] [PubMed] [Google Scholar]
- Moore B. C. J., Wojtczak M., Vickers D. A. (1996) Effect of loudness recruitment on the perception of amplitude modulation. Journal of the Acoustical Society of America 100(1): 481–489. [Google Scholar]
- Nelson D. A., Schroder A. C., Wojtczak M. (2001) A new procedure for measuring peripheral compression in normal-hearing and hearing-impaired listeners. Journal of the Acoustical Society of America 110: 2045–2064. [DOI] [PubMed] [Google Scholar]
- Ohm G. S. (1843) Über die Definition des Tones, nebst daran geknüpfter Theorie der Sirene und ähnlicher tonbildender Vorrichtungen [On the definition of a tone and related theory of a siren and similar tone-producing devices]. Annalen der Physik Chem 59: 513–565. [Google Scholar]
- Oxenham A. J., Bernstein J. G. W., Penagos H. (2004) Correct tonotopic representation is necessary for complex pitch perception. Proceedings of the National Academy of Sciences of the United States of America 101(5): 1421–1425. [DOI] [PMC free article] [PubMed] [Google Scholar]
- Oxenham A. J., Plack C. J. (1997) A behavioral measure of basilar-membrane nonlinearity in listeners with normal and impaired hearing. Journal of the Acoustical Society of America 101: 3666–3675. [DOI] [PubMed] [Google Scholar]
- Patterson R. D. (1976) Auditory filter shapes derived with noise stimuli. Journal of the Acoustical Society of America 59: 640–654. [DOI] [PubMed] [Google Scholar]
- Plack C. J. (2005) Pitch and periodicity coding. In: Plack C. J. (ed.) The sense of hearing, New Jersey, NJ: Lawrence Erlbaum, pp. 138–140. [Google Scholar]
- Ruggero, M. A. (1992) Responses to sound of the basilar membrane of the mammalian cochlea. Current Opinion in Neurobiology2, 449–456. [DOI] [PMC free article] [PubMed]
- Rutherford E. (1886) A new theory of hearing. Journal of Anatomy and Physiology 21: 166–168. [PMC free article] [PubMed] [Google Scholar]
- Scheidt R. E., Kale S., Heinz M. G. (2010) Noise-induced hearing loss alters the temporal dynamics of auditory-nerve responses. Hearing Research 269: 23–33. [DOI] [PMC free article] [PubMed] [Google Scholar]
- Schwarz G. (1978) Estimating the dimension of a model. The Annals of Statistics 6(2): 461–464. [Google Scholar]
- Sek A., Moore B. C. J. (1994) The critical modulation frequency and its relationship to auditory filtering at low frequencies. Journal of the Acoustical Society of America 95: 2606–2615. [DOI] [PubMed] [Google Scholar]
- Shackleton T. M., Carlyon R. P. (1994) The role of resolved and unresolved harmonics in pitch perception and frequency modulation discrimination. Journal of the Acoustical Society of America 95: 3529–3540. [DOI] [PubMed] [Google Scholar]
- Shamma S., Klein D. (2000) The case of the missing pitch templates: How harmonic templates emerge in the early auditory system. Journal of the Acoustical Society of America 107: 2631–2644. [DOI] [PubMed] [Google Scholar]
- Terhardt E. (1974) Pitch, consonance, & harmony. Journal of the Acoustical Society of America 55: 1061–1069. [DOI] [PubMed] [Google Scholar]
- von Helmholtz, H. (1877). On the sensations of tone. (A. J. Ellis, Trans. 1885, 1954). New York, NY: Dover.
- Wightman F. L. (1973) The pattern-transformation model of pitch. Journal of the Acoustical Society of America 54: 407–416. [DOI] [PubMed] [Google Scholar]