Abstract
Monoacylglycerol acyltransferase 1 (Mogat1) catalyzes the conversion of monoacylglycerols (MAG) to diacylglycerols (DAG), the precursor of several physiologically important lipids such as phosphatidylcholine, phosphatidylethanolamine and triacylglycerol (TAG). Expression of Mogat1 is tissue restricted and it is highly expressed in the kidney, stomach and adipose tissue but minimally in the normal adult liver. To understand the transcriptional regulation of Mogat1, we characterized the mouse and human Mogat1 promoters in human kidney proximal tubule-2 (HK-2) cells. In-silico analysis revealed several peroxisome proliferator response element (PPRE) binding sites in the promoters of both human and mouse Mogat1. These sites responded to all three peroxisome proliferator activated receptor (PPAR) isoforms such that their respective agonist or antagonist activated or inhibited the expression of Mogat1. PPRE site mutagenesis revealed that sites located at -592 and -2518 are very effective in decreasing luciferase reporter gene activity. Chromatin immunoprecipitation (ChIP) assay using PPARα antibody further confirmed the occupancy of these sites by PPARα. While these assays revealed the core promoter elements necessary for Mogat1 expression, there are additional elements required to regulate its tissue specific expression. Chromosome conformation capture (3C) assay revealed additional cis-elements located ~10–15 kb upstream which interact with the core promoter. These chromosomal regions are responsive to both PPARα agonist and antagonist.
Introduction
Triacylglycerol (TAG) is synthesized by two major pathways in mammals: the glycerol 3-phosphate (G-3-P) pathway [1] and the monoacylglycerol (MAG) pathway [2]. While the G-3-P pathway is ubiquitously present in tissues, the MAG pathway is tissue restricted to the small intestine, kidney, and adipose tissue but is minimally present in the adult liver [3]. Our interest in Mogat1 increased while phenotyping the 1-acylglycerol phosphate O-acyltransferase 2 (Agpat2-/-) null mouse [4], a murine model of congenital generalized lipodystrophy type 1 (CGL1). The Agpat2-/- mice revealed all the metabolic complications associated with human CGL1. The most interesting finding was a robust increase in the expression of Mogat1 in the livers of Agpat2-/- mice, both at the mRNA (~25–50 fold increase) and protein (~6-fold increase) levels [4]. The increase in the expression of hepatic Mogat1 in Agpat2-/- mice constitutes an alternate route by which the livers of these mice could synthesize TAG. Thus, Mogat1 became a potential molecular target to reduce liver TAG synthesis. A few studies using siRNA or antisense oligonucleotides (ASO) in an acute setting showed suppression of Mogat1 expression in mice livers [5–7], resulting in an increase in hepatic insulin signaling and sensitivity, improvement in whole body glucose homeostasis, and a modest decrease in liver TAG. However, using genetic approaches to delete Mogat1 on the Agpat2-/- and ob/ob genetic backgrounds did not result in any decrease in liver TAG levels [8]. However, these studies did not reveal how Mogat1 is upregulated in the liver.
A limited number of studies related to the transcriptional regulation of Mogat1 have been presented in the past [9, 10]. In these studies, ~2 kb promoter of human [9] and mouse [10] showed the significance of PPARγ in the transcriptional regulation of Mogat1 in an in-vitro system. We initiated the current study in detail to help understand how the expression of Mogat1 might be transcriptionally regulated in tissues like the stomach and kidney, in addition to the liver [3]. It is interesting to note that Mogat1 is a highly conserved gene in mammals, it is highly expressed in tissues like the stomach and kidney [3] which are not known to synthesize any significant levels of neutral lipids, and that Mogat1 might have a few non-enzymatic functions yet to be discovered. In this study, we characterized the promoter region of Mogat1, showing that the transcriptional regulation of Mogat1 could be regulated by all three peroxisome proliferator-activated receptors (PPARs; α, γ and β/δ). The chromosome conformation capture (3C) assay further revealed that another putative PPAR regulatory region is located ~10–15 kb further upstream of the transcriptional start site (TSS) which interacts with PPARα to regulate transcription of Mogat1.
Experimental Procedures
Detailed experimental procedures used in this study are available upon request.
Animals
Animals used in this study were approved by the Institutional Use and Care of Animals and BioSafety Committee (IACUC) at the UT Southwestern Medical Center.
Bioinformatics for promoter analysis
Identification of transcription factor binding sites was performed using TESS-Transcription Element Search System (http://www.cbil.upenn.edu/tess/) and TRANSFAC (TRANScription FACtor database). “TRANSFAC®(www.biobase-international.com/transcription-factor-binding-sites) from BIOBASE Corporation” and [11]. Multiple sequence alignment was performed using the ClustalW2 program (http://www.ebi.ac.uk/Tools/clustalw2.index.html) and NCBI BLAST-basic local alignment search tool (http://blast.ncbi.nlm.nih.gov/Blast.cgi). Conserved regions between mouse, human and rat were identified using the University of California, Santa Cruz genome browser program (genome.ucsc.edu). To predict the presence of CpG islands in mouse and human Mogat1 promoters a bioinformatics online tool called Sequence Manipulation Suite was used [12]. For this analysis, ~500 bp of human or mouse MOGAT1 upstream region and ~100 bp of downstream region was browsed.
Cell lines
The cell lines included in this study were human embryonic kidney 293 (HEK-293), human kidney proximal tubule (HK-2), human epithelial colorectal adenocarcinoma (Caco-2), human colorectal adenocarcinoma (HT-29), human hepatocarcinoma (Huh-7), human breast adenocarcinoma (MCF-7), mouse fibroblasts (3T3-L1), Chinese hamster ovary (CHO), rat hepatic tumor (HTC) and normal rat kidney (NRK). Most of the cells used were obtained from ATCC and a few were obtained from other investigators on the campus.
Cell culture
HEK-293, Caco-2, Huh-7, HTC and HT-29 were grown in high glucose DMEM supplemented with 10% FBS and 1% antibiotics. HK-2 cells were grown in low glucose DMEM. CHO cells were grown in F-12 media and HT-29 cells were grown in McCoy’s 5a media with 10% FBS maintained in a 37°C incubator with 5% CO2. All cell culture reagents were from Life Technologies (Grand Island, NY).
Quantitative real-time PCR
Primers for mouse genes used in conventional and real time PCR reactions in this study are listed in Table 1. All RT-qPCR was carried out in 20 μl reaction volume in 96-well plates using the ABI PRISM 7700 sequence detection system as reported previously [4]. All human genes were amplified using Taqman master mix and primer/probe sets (MOGAT1-Hs00369695_m1, PPARα-Hs00231882_m1, PPARγ-Mm01184322_m1 and PPARδ-Hs00606407_m1, 18S-4333760F) (Life Technologies). Human and rat transcripts were normalized to 18S and mouse transcripts to cyclophilin.
Table 1. Primers used in this study.
| RACE and amplification of full length transcript | |||
|---|---|---|---|
| Primer name | Primer Sequence | Primer name | Primer Sequence |
| mMOGAT1 +194F | CAGAGCAAGGAGGCAGAAGA | mMOGAT1_5UTR_F | CAAATCCTGCGAAAGGAGTC |
| mMOGAT1 +457R | GGAACAACGGGAAACAGAAC | mMOGAT1_exon6_R | CTGAGGTCGGGTTCAGAGTC |
| mus_GAPDH_1F | GGAGCCAAAACGGGTCATCATCTC | mMOGAT1_5UTR_F_2 | CCTCCCAGTCGGTAGCAGTA |
| mus_GAPDH_1R | GAGGGGCCATCCACAGTCTTCT | mMOGAT1_F_1 | GGAGGTGGCAATGTCTCAATC |
| mMOGAT1_R_1 | CATCTTCTGCCTCCTTGCTC | mMogat1 sybr 66 F | GCAGTGGGTCCTGTCCTTC |
| mMOGAT1_R_2 | AGGAAGGACAGGACCCACTG | mMogat1 sybr 221 R | CAGTTCCATCTTCTGCCTCCTT |
| hMOGAT1 F | CATACCCCAGAGCGAGGAG | Cyclo sybr 334 F | TGGAGAGCACCAAGACAGACA |
| hMOGAT1 R | CGAAAGACAGGACACCAGAA | Cyclo sybr 335 R | TGCCGGAGTCGACAATGAT |
| hMOGAT1_CDS_F +523 | AAGGAGGGAGGTGGAAACAT | hMOGAT1_Exon_R_1 | AGCAGCAGGTATTTCAGGAC |
| hMOGAT1_CDS_R +786 | AAACAGGGGCAAAGCAAAC | hGAPDH 361 F | ATCTCTGCCCCCTCTGCT |
| hMOGAT1_3’UTR_F | CCAGCGGAAAGGATTTGTTA | hGAPDH 793 R | CCTGCTTCACCACCTTCTTG |
| hMOGAT1_3’UTR_R | CAAAGCAAACCCCATGATCT | hMOGAT1_CDS_F_1 | GATCATGGGGTTTGCTTTGC |
| hMOGAT1_Exon_R | GGCTCCAACTGCCATTATTC | hMOGAT1_Exon_F | GGCCATGAAGGTAGAGTTTG |
| rMOGAT1_5’UTR_F | TAGTTCCTTCCTTCTCCGCC | rMOGAT1_Exon4_F | AAGGAGGTGGGAACAT |
| rMOGAT1_5’UTR_2F | ACAGACCCGGAGAAAGGAGT | rMOGAT1_Exon4_R | ATGGGTCAAGGCGATCTTA |
| rMOGAT1_Exon1_F | ATGATGGTTGAGTTCGAGCCA | rMOGAT1_Exon_R | CACTTTGTCTTGGGCAGTCC |
| rMOGAT1_Exon1_2F | GGATCCTGGTCATCTTGGTG | rMOGAT1_Exon6_R | CATCAATCTGCTCTGGGGTC |
| rMOGAT1_Exon2_R | TCCAGTTCTGAACCCAGCTC | rMOGAT1_Exon6_1R | GTATGGCTTGGAGGAAGACG |
| rMOGAT1_Exon3_R | GAACAACGGGAGCCAGAAC | ||
| Promoter constructs and deletion mutagenesis | |||
| mMOGAT1_R | GGGACTGTGTCTGGTGAGTG | mMOGAT1_16kb_up_F | ATGCTCTTTTCCTATGCTTAACTCC |
| mMOGAT1_6kb_up_F | CAGGGATCAAATGTAGGTCTTGAG | mMOGAT1_4kb_up_R_1 | GACCATGTGTGGATATAGACTGTGTG |
| mMOGAT1_4kb_up_R | CACAGAGGCCAGAAGAGGTATTG | mMOGAT1-5371_F | CACTGGTGGAATGTCTCTCC |
| mMOGAT1-3473_F | AGAGCTGGTTTTGCTTCCTG | mMOGAT1-5022_F | GGATAGTGTGAAAATTCGCTTG |
| mMOGAT1-3094_F | GAGTAACCAAAATGGCTGCAT | mMOGAT1-4601_F | CTGGATGGTTCCAAGGGTTA |
| mMOGAT1-2832_F | CATTGGTGGCTTCCTGTTAG | mMOGAT1-4185_F | TGCTTCTAGGTATGATGGAGGA |
| mMOGAT1-2340_F | TTCGTTCATGCCCAATATCC | mMOGAT1-3807_F | GCCAGGGCTACCTAACAAAA |
| mMOGAT1–4185_R | TCCTCCATCATACCTAGAAGCA | mMOGAT1_prom_F | GGCTGGAAAGACAGCTCAAC |
| mMOGAT1_prom_del_F | CCTGCCCCCCCCCCAAAATTTTCTCACAAGATAAT | mMOGAT1_prom_R | GGGCAGAGAAGTCATACAGG |
| mMOGAT1_prom_del_R | ATTATCTTGTGAGAAAATTTTGGGGGGGGGGCAGG | ||
| ChIP assay | |||
| mMOGAT1_ChIP_F | TTGTCCCACCGGATTCTAAC | hMOGAT1_ChIP_1.1F | GCTTGGGCTCCATATCCTC |
| mMOGAT1_ChIP_R | GCACGGGTCTCTCTTTTTGT | hMOGAT1_ChIP_1.1R | AGTCGCCAAAAGTCATCGAG |
| mMOGAT1_ChIP_F1 | GCACATACGAGGCAGAGACA | hMOGAT1_ChIP_1.2F | CTGAGGACCCAAGAGTGAGG |
| mMOGAT1_ChIP_R1 | GGATATTGGGCATGAACGAA | hMOGAT1_ChIP_1.2R | GGGAGAGGGGTCAACTGG |
| mMOGAT1_ChIP_F2 | TGCAGACTTCTTAAACTGCTAAGG | hMOGAT1_ChIP_1.3F | GACTCGCCTCTCCAGGTTTT |
| mMOGAT1_ChIP_R2 | TGGGCCTAATTGACTCCAA | hMOGAT1_ChIP_1.3R | ATCTTCCCCCAGTGCTAGGT |
| mMOGAT1_ChIP_F3 | TAGGGTGGCAAATCCTGGTA | mMOGAT1_ChIP_R3 | TGACTCTGGTGCAATATGCTG |
| 3C assay | |||
| hMOGAT1_3C_F1 | ATGCTTCCAGGGCGCTAAC | hMOGAT1_3C_R3 | TGGTGGGCCTGAAGAGAATA |
| hMOGAT1_3C_R1 | GATTTGCACACCTTTCTCTGC | hMOGAT1_3C_F4 | GGTCTTTCTTAATCCCAAGATTTTT |
| hMOGAT1_3C_F2 | TCAGCAGAAATTAAGGAGATGC | hMOGAT1_3C_R4 | GCTGGTTCATTCACTCACTCC |
| hMOGAT1_3C_R2 | TGGGTAGTAGGATATGGACATGC | hMOGAT1_3C_F5 | AGACAATCTGGCCTGTGACC |
| hMOGAT1_3C_F3 | CCCTGAGAGCTGAAGAGGTG | hMOGAT1_3C_R5 | TGAAAATGTACCAAGCACCA |
| PPARs | |||
| rMOGAT1_PPARα_F | TCACACAATGCAATCCGTTT | rMOGAT1_PPARγ_R | ACTGGCACCCTTGAAAAATG |
| rMOGAT1_PPARα_R | GGCCTTGACCTTGTTCATGT | rMOGAT1_PPARβ/δ_F | AGGACATGAGCCATCCAAAG |
| rMOGAT1_PPARγ_F | CCCTGGCAAAGCATTTGTAT | rMOGAT1_PPARβ/δ _R | TACACCCCTTCCCTTCAGTG |
Northern blot analysis
Northern blot analysis was performed as previously described [13]. Twenty μg of total RNA was separated on a 1% agarose–formaldehyde denaturing gel and hybridized with 32P-labeled DNA probe (a 250 bp cDNA fragment of Mogat1). Membranes were washed with hybridization buffer at 50°C for 1 h, followed by 2xSSC/0.5% SDS at 50°C for 30 min. The blots were exposed to X-ray film.
5’ rapid amplification of cDNA ends (5’ RACE)
The 5′ region of the transcript was amplified using 5′-RNA ligase mediated RACE kit as suggested by the manufacturer (Ambion) to generate the 5′ cDNA sequences of the Mogat1 gene. The first round of PCR was performed using 5′-Outer and 5′ Outer Universal Primers followed by the second round of PCR using 5′-Inner and 5′ Inner Universal Primers (Table 1).
Reporter gene constructs
The mouse Mogat1 upstream region was cloned into the pGL3-basic luciferase reporter vector and was used to generate serial deletion promoter constructs. The deletion clones were amplified and sequenced to determine PCR errors. Primers used are listed in table 1.
Transient transfection in cells
HK-2 or HTC cells were seeded at a density of 3 x 10⁵ cells in a 6-well plate. The cells were transfected with a 1:3 ratio of plasmid DNA:fugene HD complex (2 μg pGL3 Basic or various promoter constructs, pGL3-Mogat1 plasmid, along with100 ng pRL Luc (renilla luciferase control vector). 24 hr post-transfection cells were washed with 1X PBS. Luciferase reporter assay was performed using dual luciferase reporter assay system according to the manufacturer’s protocol (Promega, Madison, WI). The ratio for firefly:renilla luciferase activity was calculated and the relative luciferase activity was normalized to protein and expressed as a fold change in relative luminiscence units (RLU).
Deletion of PPAR sites in the Mogat1 promoter
The plasmid consisting of Mogat1 promoter region from -2832/+136 bp (nucleotides numbered from the translational codon ATG, where adeneine is +1) was used as the parental clone for all mutagenesis experiments. Mutation in PPRE site 1 and site 2 located at -592 and -2518 bp of the promoter were generated using Quikchange XL site directed mutagenesis kit (Agilent) according to the manufacturer's protocol. All the deletion constructs were verified by Sanger sequencing. Primers used are listed in Table 1.
Chromatin immunoprecipitation (ChIP) assays in whole mouse kidney and in HK-2 cells
ChIP assays were performed as reported earlier [14]. Briefly, ~300 mg of frozen or fresh mouse kidney from 2–3 wk old female mice was homogenized and sonicated to shear DNA to an average fragment size of ~200–1000 bp. An aliquot of the sonicated sample was saved as an input. Protein A/G beads (Santa Cruz Biotechnology, Dallas, TX) were added to all samples and incubated for 1 hr at 4°C to pre-clear. To the immunoprecipitate DNA-protein complexes (IP), 2 μg of PPARα antibody (H-98, Catalog # sc-9000, Santa Cruz Biotechnology) was added. The IP DNA was eluted and the samples were then incubated with 5M NaCl for 4–5 hr at 65°C to reverse the cross-links. DNA was purified and PPARα binding PPRE was amplified using the primers shown in Table 1.
HK-2 cells were seeded at a density of 1 x 10⁷ cells per 150 mm plate. Cells were crosslinked with 37% formaldehyde to crosslink (1% final conc) and incubated at room temperature for 10 min, then 1.25 M Glycine (0.125 M final conc) was added to quench unreacted formaldehyde. Cells were scraped with ice-cold PBS containing protease inhibitors and pelleted. For pre-clearing, 100 μl of protein A/G agarose beads were added and incubated at 4°C for 1 hr with rotation. The beads were pelleted at 300xg for 5 min at 4°C. The supernatant was removed and protein A/G agarose beads along with 2 μg of PPARα antibody were added and incubated overnight at 4°C with rotation. Protein A agarose beads were pelleted. The immune complexes were eluted in elution buffer and digested with proteinase K. The DNA was recovered by phenol/chloroform extraction and ethanol precipitation. The purified DNA is used for PCR as above.
Treatment of HK-2 and HTC cells with PPAR agonists and antagonists
HK-2 cells were seeded at a density of 1x10⁶ per well in a 6-well plate and the cells were transfected with Mogat1_-2832/+136 construct. 24 hr post transfection cells were treated with DMSO or 25, 50 or 100 μM WY14643, GW6471, rosiglitazone, GW9662, GW0742 or GSK0660. In some experiments, to measure the competitive inhibition of PPARs by their respective antagonist, cells were incubated with an equimolar concentration of agonist and antagonist for respective PPARs. HTC cells were also transfected as above and treated with 100 μM of the PPAR agonists and antagonists. After 24 hr of treatment, cells were lysed in passive lysis buffer (Promega) and luciferase activity was measured using dual luciferase reporter assay kit from Promega according to the manufacturer’s protocol. The ratio for firefly:renilla luciferase activity was calculated and the relative luciferase activity was normalized to protein and expressed as a fold change in RLU.
Treatment of primary mouse hepatocytes with BSA conjugated fatty acids
Primary mouse hepatocytes were isolated from 1 month-old non-fasted WT and Agpat2-/- female mice as described earlier [15]. 1x10⁶ cells were seeded into a collagen coated 6-well plate and allowed to attach for 2 hr in low glucose DMEM containing 10% FBS and 1% antibiotics. A stock solution (5 mM) of the following fatty acids were prepared by conjugating these fatty acids to BSA as described earlier: palmitic, stearic, oleic and arachidonic acids [16]. The solution was filter sterilized with a 0.2 μm syringe filter and added to the cells at the desired concentration. After 2 hr cells were lysed using RNA STAT-60. cDNA was made and RT-qPCR was performed to measure the expression of Mogat1.
Chromosome Conformation Capture (3C) Assay in HK-2 cells
The 3C assay was performed according to the method described earlier [17]. Briefly, HK-2 cells were seeded in a 15-cm dish and grown to 90% confluency. Cells were washed with ice-cold PBS and crosslinked with 2% formaldehyde for 10 min at room temperature (RT). The cross-linking was terminated by adding 0.125 M glycine and cells were lysed for 1 hr with ice-cold lysis buffer containing 10 mm Tris (pH 8.0), 10 mm NaCl, 0.2% Nonidet P-40, and 1 mm dithiothreitol. The nuclei of the cells were then harvested and suspended in the appropriate restriction enzyme buffer containing 0.3% SDS and incubated at 37°C for 1 hr with gentle shaking. SDS was then sequestered from the samples by the addition of 1.8% Triton X-100 and incubated at 37°C for 1 hr. The samples were digested with BglII at 37°C for 16 hr. BglII was inactivated by the addition of 1.6% SDS and incubated at 65°C for 20 min. Samples were diluted with T4 DNA ligase buffer (Life technologies) to achieve ∼3 ng DNA/μl, and then incubated with 200 units of T4 DNA ligase for 4 hr at 16°C. Samples were incubated with Triton X-100, followed by incubation with Proteinase K (200 μg/ml) at 65°C for 16 hr to reverse the cross-linking. This was followed by the addition of 10 μg of RNase/ml, and the DNA was purified by phenol/chloroform extraction. 300 ng of DNA was then analyzed by 40 cycles of touchdown PCR with Failsafe polymerase (Epicenter, Madison, WI).
The PCR products were resolved on a 2% agarose gel and the amplified DNA was gel purified using the QIAquick gel extraction kit (Qiagen) and then cloned into pDrive cloning vector (Qiagen). The clones were sequenced to confirm the ligation of the two distal fragments. RT-qPCR was performed to quantify crosslinking efficiency. To determine the role of PPARα, cells were also incubated with DMSO, WY16873 (100 μM) or GW6471 (100 μM) for 24 hr prior to the 3C assay. Primers are listed in Table 1. Similarly, 3C assay was also performed in HTC cells. Based on the conveniently located HindIII restriction sites in the ~20 kb Mogat1 promoter of rat, HindIII was chosen as an appropriate restriction enzyme for rat promoter 3C assay. Primers used for 3C assay in HTC cells are listed in S1 Table.
Statistical analysis
Values are given as mean ± S.E.M. Statistical significance was calculated by two-tailed Student’s t-test using GraphPad Prism version 6.04 for Windows. A p-value ≤0.05 was considered statistically significant.
Results
Selection of an appropriate cell culture model system to study Mogat1 promoter
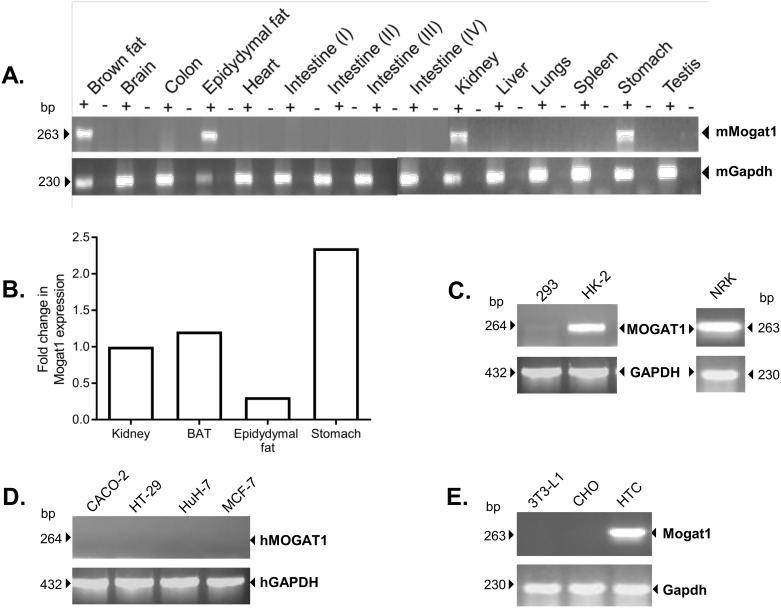
Previously, a study has shown that Mogat1 expression is tissue restricted, being expressed in the kidney, stomach and at somewhat lower levels in the brown adipose tissue (BAT) and epididymal fat [3]. Expression of Mogat1 in the human and mouse liver is minimally detectable [3, 18, 19]. However, it can only be detected using poly(A)+ RNA but not using total RNA [3]. Mogat1 has also been reported in the livers of diet induced obese mice [6], ob/ob mice [7], in mouse models of diabetes like KKAy and db/db mice [5] and in cultured murine hepatocytes [20]. However, it can be appreciated that the level of Mogat1 expression in the livers is several fold less when compared to tissues like the stomach or kidney and it is only upregulated in pathological conditions like hepatic steatosis [4]. To reconfirm the tissue distribution of mouse Mogat1, a conventional PCR of various mouse tissues was performed and our observations were consistent with the findings published earlier (Fig 1A). We followed this with RT-qPCR in tissues expressing Mogat1. Among the Mogat1 expressing tissues we find the following order of level of expression: stomach > BAT > kidney > epidydymal fat (Fig 1B).
Fig 1. Expression of Mogat1 in various mouse tissues and cell lines.
A. Mogat1 expression in several mouse tissues. Mogat1 is expressed in brown adipose tissue, epididymal fat, kidney and stomach. B. Mogat1 expression was measured by RT-qPCR in the brown adipose tissue (BAT), epidydymal fat, kidney and stomach obtained from WT mice. The data were normalized to cyclophilin and then expressed as a fold change increase in Mogat1 compared to kidney. Stomach was found to be the highest expressing tissue. C. MOGAT1 is not expressed in human embroyonic kidney (HEK-293) cells but is expressed in human proximal kidney tubule (HK-2) cells and normal rat kidney cells (NRK). D. Other human cell lines screened for MOGAT1 expression: Caco-2, HT-29, Huh-7 and MCF-7. E. Expression of Mogat1 in rodent cell lines: mouse fibroblasts, 3T3-L1; Chinese hamster ovary (CHO) cells; Rat hepatic tumor cells, HTC. Mogat1 was expressed only in HTC cells. Shown is the Mogat1 product as analyzed on 1.5% agarose gels and expression of the housekeeping gene glyceradehyde phosphate dehydrogenase (Gapdh). (+) = cDNA amplification in the presences of reverse transcriptase; (-) = cDNA amplification in the absence of reverse transcriptase.
Though Mogat1 is highly expressed in the stomach, there are no well-established stomach cell lines. Similarly, Mogat1 is expressed in brown and white adipose tissue but these cells require a differentiation step rendering them unsuitable for the current study. So we were left to choose a kidney cell line as our working cellular model. We first screened various human and murine kidney cell lines which included HEK-293, HK-2 and NRK. We observed that HK-2 and NRK cells expressed Mogat1 (Fig 1C). However, the NRK PCR product, when sequenced, did not correspond to the Genbank entry (NM_001108803) (S1 Fig). HEK-293 cells did not express Mogat1. In addition, we screened a few cancer cell lines which might have upregulated expression of Mogat1 like Caco-2, HT-29, Huh-7, and MCF-7, but none of these cell lines expressed Mogat1 (Fig 1D). Furthermore, when we amplified Mogat1 in 3T3-L1, CHO and HTC cells, only HTC, a rat hepatoma cell line, amplified Mogat1 which was verified by sequencing (Fig 1E). It is interesting to note that a normal mouse liver has very low levels of Mogat1 expression whereas rat hepatoma cells express Mogat1 at higher levels, though at this point the role of Mogat1 in these cells is unclear. Based on these results we selected HK-2 cells as the cell culture model for studying the transcriptional regulation of the mouse Mogat1 promoter.
Verification of expression of MOGAT1 open reading frame (ORF) in HK-2 cells
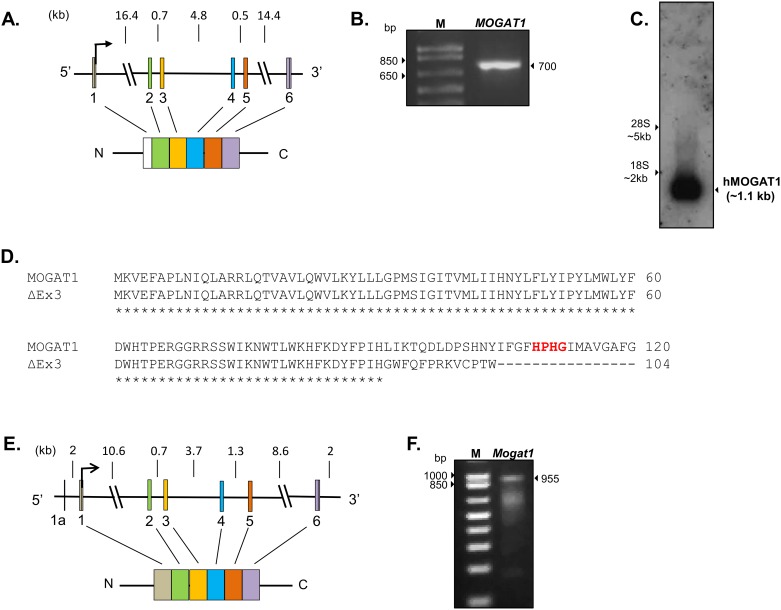
Next we examined whether HK-2 cells expressed the full length ORF of MOGAT1 transcript. The predicted ORF is 1090 bp long (GenBank accession # NC_000002) encoded from 6 exons (Fig 2A). We amplified mRNA obtained from HK-2 cells using gene specific primers designed to amplify the entire ORF (primer pairs 1_F and 2_R, Table 1). Surprisingly, the primers amplified a truncated product which was ~700 bp (Fig 2B). Upon sequencing, we observed that exon 3 was deleted. This exon contains the conserved motif “HPHG” which is the putative catalytic site for MOGAT1 enzyme (Fig 2D), suggesting that MOGAT1 was alternatively spliced in HK-2 cells. This would result in a frameshift and an aberrant protein (p.Leu91Glyfs*13) (Fig 2D). We further confirmed this by northern blot analysis in HK-2 cells which revealed a single band of the expected size (~1.1 kb), confirming that HK-2 cells only express a single but alternatively spliced transcript of MOGAT1 (Fig 2C) and lack a full length transcript. We further verified this observation in human kidney samples. Similar to the HK-2 cells we observed that human kidney also expresses only exon 3 deleted MOGAT1 which was confirmed by sequencing (Fig 2D).
Fig 2. Schematic of human and mouse MOGAT1 gene and product size.
A. The human MOGAT1 gene consists of 6 exons, marked as boxes. Shown below is the predicted MGAT protein. B. Amplification of human MOGAT1 transcript from HK-2 cells produce a product of ~700 bp and upon sequencing confirmed the deletion of exon 3. C. Northern blot analysis of total RNA from HK-2 cells probed with human MOGAT1 showing the expected size of mRNA. Northern analysis confirmed the presence of a single MOGAT1 transcript in HK-2 cells. D. Amino acid alignment of the predicted MOGAT1 protein with truncated (exon 3 deleted) MOGAT1 protein in human kidney confirmed by sanger sequencing. This will result in a frame shift producing a truncated protein of p.Leu91Glyfs*13 and deletion of the putative catalytic site HPHG, marked with an asterisk. E. Schematic of mouse Mogat1 gene showing exons marked as boxes. Shown below is the predicted MGAT protein. Mouse Mogat1 has an additional untranslated exon shown as 1a. F. Amplification of mouse Mogat1 mRNA of expected size and upon sequencing confirmed the predicted sequence.
Based on these observations, we then verified whether mouse kidney also expresses an alternatively spliced Mogat1. Mouse Mogat1 is also encoded by 6 exons (Fig 2E). Primers were designed to amplify the full length ORF including 5’UTR (Table 1). The expected PCR product of 955 bp (Fig 2F) was further verified by sequencing. This confirms that mouse kidney expresses an mRNA encoding the full length protein. This observation shows that there is a tissue (kidney) specific alternative splicing of Mogat1.
Determination of the transcriptional start site (TSS) of Mogat1 in HK-2 cells and mouse kidney
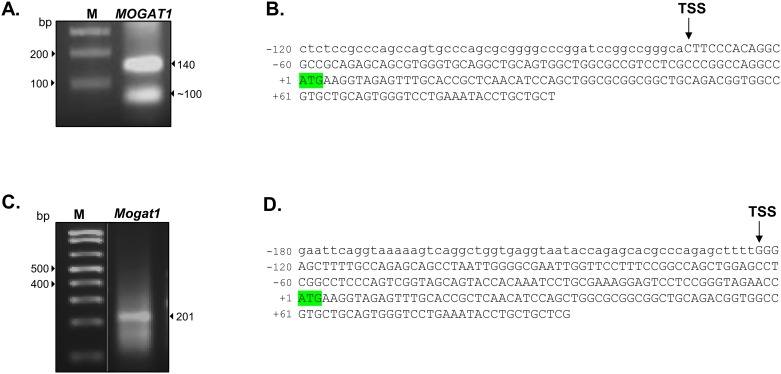
To define the TSS of MOGAT1 in HK-2 cells, we performed 5’RACE. Two PCR products of ~140 bp and ~100 bp were gel purified and sequenced (Fig 3A). The ~140 bp fragment revealed the putative TSS and untranslated region whereas the ~100 bp product amplified an unrelated sequence. Thus, in HK-2 cells MOGAT1 has one TSS which is located -72 bp from the ATG (Fig 3B). On inspection we detected no canonical TATA-box sequence (TATAAA) in the MOGAT1 promoter suggesting that MOGAT1 is a TATA-less promoter [21]. Most TATA-less promoters have an initiator element (Inr) for transcriptional initiation. The consensus Inr sequence (YYANWYY (C/T C/T A N A/T C/T C/T)) is also not well defined in this promoter [22]. The lack of a TATA-box or a well-defined Inr in the promoter of MOGAT1 prompted us to search for additional elements involved in initiation of transcription. A few promoters use a downstream promoter element (DPE; RGWYVT (A/G) G (A/T) (C/T) G/A/C (T)) usually located ~28–32 bp downstream of the ATG for initiation of transcription [22]. Although not perfect, a DPE sequence, GGT, was located ~29 bp downstream from the ATG. Apart from these elements, CpG islands have been shown to be involved in transcriptional inititation [23]. Using an online bioinformatics tool, Sequence Manipulation Suite [12], for CpG island prediction, we defined the CpG island for MOGAT1 which was located from -447 to -142 bp from the ATG.
Fig 3. Localization of transcriptional start site (TSS) of Mogat1 in human and mouse kidney.
A. 5’RACE (5’ rapid amplification of cDNA ends) in HK-2 cells yielded a ~140 bp product which, upon sequencing, determined the TSS as shown in B. B. Shown is the TSS in relation to the translational start site (ATG) highlighted in green. C. Localization of TSS of Mogat1 in mouse kidney by 5’RACE which yielded a ~200 bp product and was confirmed by sequencing. D. Shown is the TSS in relation to the translational start site (ATG) highlighted in green.
Similarly, we also defined the TSS in the mouse Mogat1 using mouse kidney (Fig 3C). The expected PCR product was ~200 bp which was verified by sequencing (Fig 3D). In the mouse kidney the TSS was located at –123 bp from the ATG. Similar to the human MOGAT1 promoter, the mouse promoter also lacks TATA-box and Inr sequences but had a DPE at +29 bp (GGT). The CpG island for mouse Mogat1 was located -156 to +87 bp from the ATG.
Mapping of the proximal mouse Mogat1 Promoter region
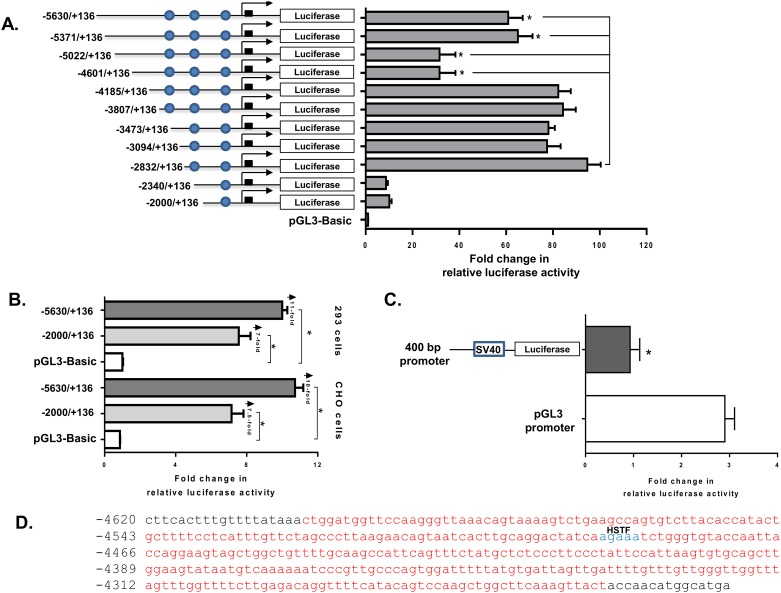
Usually, the proximal promoter of a gene consists of a core promoter of ~50 bp located around the TSS and another 1 to 2 kb sequence which drives the expression of the gene and most likely includes all the genetic information required for its transcriptional activation. Reporter constructs of serial deletions of the Mogat1 promoter region were generated from the ~5.5 kb sequence upstream from the ATG. Luciferase activity was measured in transiently transfected HK-2 cells. The strongest luciferase activity (~94-fold) was recovered with the construct containing the -2832/+136 region (Fig 4A). The luciferase reporter activity in the presence of additional 5’ sequences resulted in no additional increase in the reporter gene activity: Mogat1-3094, Mogat1-3473, Mogat1-3807 and Mogat1-4185 plasmids ~77-, ~78-, ~84- and ~82-fold respectively (not statistically significant compared to -2832/+136) (Fig 4A). This suggests that these regions do not contain any additional genetic information for the transcriptional regulation of Mogat1. Interestingly, when an additional promoter region from -4185 to -5022 was included we observed a ~50-fold decrease (compared to -2832/+136, p≤0.05) in the luciferase activity suggesting the presence of a repressing element in this region (Fig 4A). Next, when we included more of the 5’-region from -5022 to -5630, this repression of the Mogat1 transcription was partially overcome (~33-fold increase compared to -4185/+136, p≤0.05). Thus, these observations suggests that the -2832 upstream region may be the most critical region in the Mogat1 promoter which might include the proximal promoter along with the primary regulatory elements.
Fig 4. Promoter analysis of mouse Mogat1.
A. Transient transfection of HK-2 cells with various serial deletion Mogat1 promoter constructs fused to the luciferase reporter gene. The -2832/+136 construct showed a robust increase in the promoter activity (~90-fold increase). B. HEK-293 and CHO cells were transfected with -2000/+136 and -5630/+136 Mogat1 promoter constructs containing the PPRE sites. Marked also are the fold chages observed compared to the empty vector, pGL3 Basic. Bars represent the fold change in relative luciferase activity. Shown are the mean±SEM from three independent experiments performed in duplicate. C. This region silences/reduces (2-fold) the promoter activity when inserted 5’ to the SV40 promoter Bars represent mean±SEM, n = 4, performed in duplicate. Filled circles represent the putative peroxisome proliferator response element PPRE sites. D. The nucleotide sequence of the ~0.5 kb region located between -4601 and -4185 which showed a -50-fold decrease in luciferase activity as shown in panel A. Shown also is predicted heat-shock transcription factor (HSTF) in blue.
To define if the above Mogat1 promoter sequences are sufficient to drive its transcription in non-permissive cells like HEK-293 and CHO cells, we also measured the luciferase-reporter activity in these cell types. We tested constructs consisting of -2000/+136 and -5630/+136 of the Mogat1 promoter. Both the constructs resulted in ~7 to ~11-fold increase in the luciferase-reporter activity (Fig 4B), suggesting that the tissue specific regulatory elements are located outside of this promoter region.
Presence of a repressor element in ~4 kb upstream region of mouse Mogat1 promoter
As described above (Fig 4A), we noted a decrease in mouse Mogat1 promoter activity due to the presence of the sequences -4185 to -4601 bp and -4601 to -5022 bp. Since both the reporter constructs have similar luciferase activity, the silencer/repressor elements are more likely located within the -4185 to -4601 bp region. To test the silencer/repressor effect of this region a 400 bp fragment from -4185 to -4601 was cloned in front of the SV40 promoter (pGL3-promoter vector). As shown in Fig 4C, the transfection of HK-2 cells with this plasmid resulted in a ~50% decrease in luciferase activity compared to the pGL3-promoter, thus confirming the presence of a silencer repressor element. We found a heat shock transcription factor (HSTF) binding site in this region shown in blue (Fig 4D) [24]. Heat shock protein has been shown to act as a silencer in the transcription of interleukin-1 [25], although it is unclear from this study if HSTF is the main suppressor element.
Conserved regulatory elements in the promoters of mouse and human Mogat1
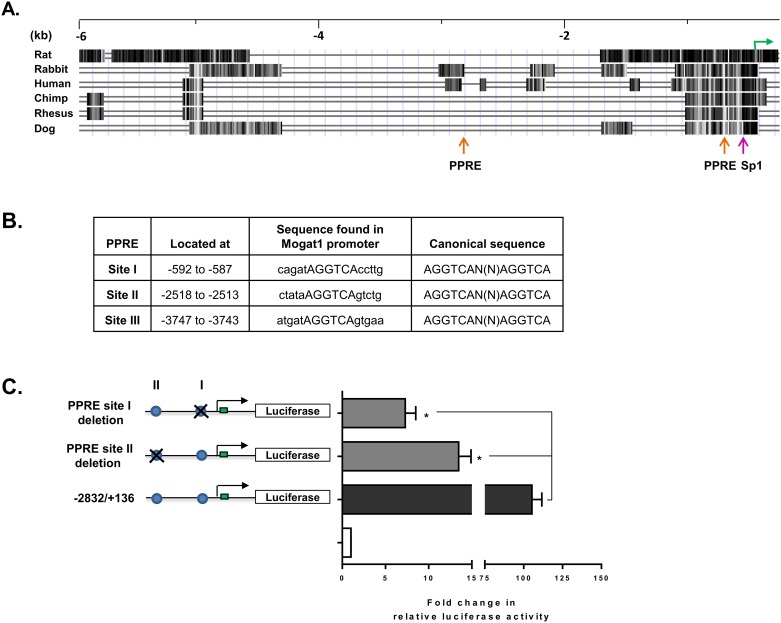
We next searched for the putative cis-acting elements in the ~5.6 kb region of the mouse Mogat1 promoter to generate a lead transcription factor(s) (TF) which might regulate the Mogat1 transcriptional activity. Employing bioinformatics tools like TRANSFAC (TRANScription FACtor database) and UCSC genome browser, we determined the conserved regions among various species and identified putative TF sites (Fig 5A). A few TFs like specificity protein (Sp1) and peroxisome proliferator-activated receptor (PPAR) are noteworthy. In TATA-less promoters, Sp1 is an important TF regulating transcriptional activation. PPARs are ligand activated nuclear receptors regulating transcriptional activation of several genes. While these sites are located in the conserved region of all three species, there are additional sites which fall outside these conserved regions. Peroxisome proliferator-activated receptor response elements (PPRE) were located at -2518 and -3747 kb (Fig 5B). Though other cis-regulatory elements were also predicted in the Mogat1 promoter (S2 Table), in this study we focused on PPAR, which is known to be involved in hepatic steatosis and lipid accumulation [26].
Fig 5. Deletion of peroxisome proliferator response element (PPRE) sites in mouse Mogat1 promoter reduces its transcriptional activity.
A. Mogat1 multigenome alignment from exon 1 to ~6 kb upstream. Orange arrows represent PPRE sites and the green arrow represents ATG. B. Shown are the locations of the PPRE sites and sequences found in the mouse promoter along with the canonical PPRE sequence. Note in the mouse promoter only half the PPRE site is found. C. PPRE deleted Mogat1 promoter analysis in HK-2 cells. The PPRE sites I and II were deleted in the -2832/+136 Mogat1 promoter construct. Deletion of site I decreased the luciferase activity to ~7.5-fold and site II to ~15-fold. Bars represent the mean±SEM (n = 3) performed in duplicate.
The luciferase reporter gene assay of the promoter construct Mogat1–2832/+136 bp of the mouse Mogat1 showed strongly enhanced luciferase activity and also carries the two predicted PPRE sites as shown in Fig 5B. To confirm the function of these PPRE binding sites, we deleted these sites individually in the Mogat1–2832/+136 bp construct and measured the luciferase-reporter activity in HK-2 cells. The deletion constructs Mogat1-del-PPRE-site1-2832/+136, and Mogat1-del-PPRE-site2-2832/+136 both reduced the transcriptional activity when compared to those of undeleted constructs (Fig 5C). PPRE-site 1 deletion (del-1) resulted in an ~85% decrease (p value = 0.003) and PPRE-site 2 deletion (del-2) led to a ~90% reduction (p value = 0.003) in the Mogat1 promoter activity. Based on the ~85–90% decrease in Mogat1 promoter activity, we deemed it unnecessary to delete both the PPRE site as well as to study the third PPRE site located further upstream (-3747 bp).
Specificity of PPRE site located on mouse Mogat1 promoter
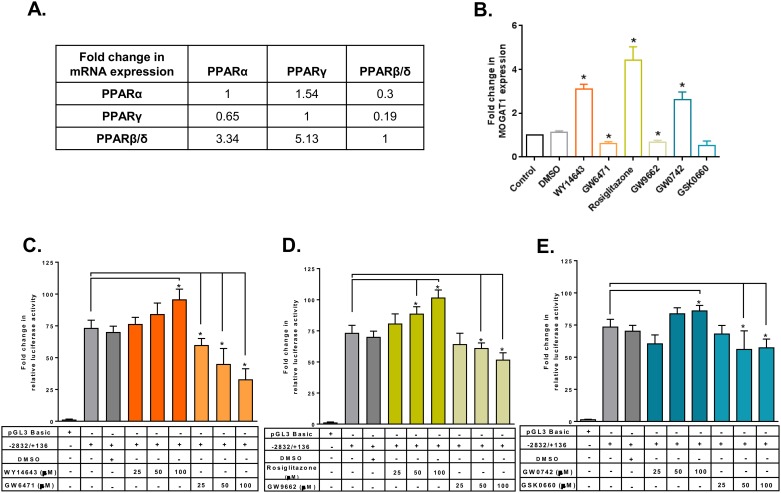
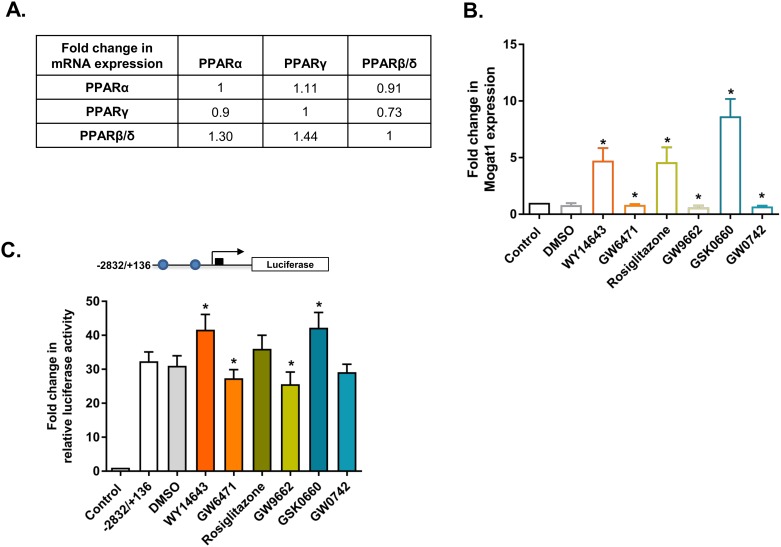
PPARs are ligand activated TFs which belong to the superfamily of nuclear receptors. PPARs can function as homodimers or form heterodimers with retinoid X receptor (RXR). PPARs bind to PPRE composed of a direct repeat (DR) preferably spaced by one nucleotide (DR1) with a consensus sequence of AGGTCA-N-AGGTCA. PPARs also recognize DR2 motifs that are preferably spaced by two nucleotides [27, 28]. We first measured the expression pattern of PPARs in the HK-2 cells and found that the highest expressing isoform was PPARβ/δ followed by PPARα and PPARγ (Fig 6A). We then measured the expression of human MOGAT1 in the presence of agonists and antagonists for all three PPAR isoforms. MOGAT1 expression was increased ~3-, 4- and 2.5-fold in the presence of PPARα, γ, and β/δ agonists WY14643, rosiglitazone and GW0742, respectively (Fig 6B). On the other hand, in the presence of PPARα, γ, and β/δ antagonists GW6471, GW9662 and GSK0660, MOGAT1 expression was inhibited ~0.6-, 0.7- and 0.6-fold, respectively. We further verified this by measuring the activation of the mouse Mogat1 promoter luciferase- reporter construct (-2832/+136 bp) in the presence of the PPAR agonists and antagonists. Remarkably, we observed that all three PPAR agonists activated the promoter to the same level. In the presence of 25, 50 and 100 μM of PPARα agonist WY14643, 3-, 11- and 22-fold increase in the luciferase reporter activity was observed. Similarly, a dose-dependent response was observed in the presence of PPARγ agonist rosiglitazone (7-, 15-, 28-fold) and PPARβ/δ agonist GW0741 showed 10-12-fold increase at 50 and 100 μM doses, although at a lower dose of 25 μM it has no effect (Fig 6C–6E). At the highest dose of 100 μM of PPAR agonist we observed that the increase in luciferase reporter activity was statistically significant. The antagonist activity of PPARα was also dose-dependent, inhibiting the luciferase reporter activity with progressive escalation of the antagonist GW6471 (13, 28, 40-fold decrease). The other PPAR isoforms resulted in a modest decrease in the luciferase reporter activity: ~9-, 12-, 21- fold decrease for PPARγ and ~5-, 17-, 16-fold decrease for PPARβ/δ. At the highest dose of 100 μM of PPAR antagonist we observed that the inhibition of luciferase reporter activity was statistically significant. This observation did not provide evidence for the specificity of the PPARs.
Fig 6. PPAR agonists and antagonists regulate the expression of Mogat1 in HK-2 cells.
A. RT-qPCR analysis of PPAR isoforms expression in HK-2 cells. All the PPAR isoforms are compared with each other. PPARβ/δ > PPARγ > PPARα. B. RT-qPCR analysis of MOGAT1 expression in HK-2 cells treated with various agonists and antagonists of PPAR isoforms. Bars represent mean±SEM (n = 4) performed in duplicate. (*) p value ≤0.05. C. Changes in the relative luciferase activity of the mouse Mogat1 promoter (-2832/+136) consisting of both the PPRE sites in the presence of PPARα agonist WY16463 and antagonist GW6471. Shown are the fold changes compared to the pGL3-basic construct and normalized to protein. D. Fold change in relative luciferase activity in the presence of PPARγ agonist rosiglitazone and antagonist GW9662 and normalized to protein. E. Fold change in relative luciferase activity in the presence of PPARβ/δ agonist GW0742 and antagonist GSK0660 and normalized to protein. Bars represent mean±SEM (n = 4) performed in duplicate. (*) p value ≤ 0.05.
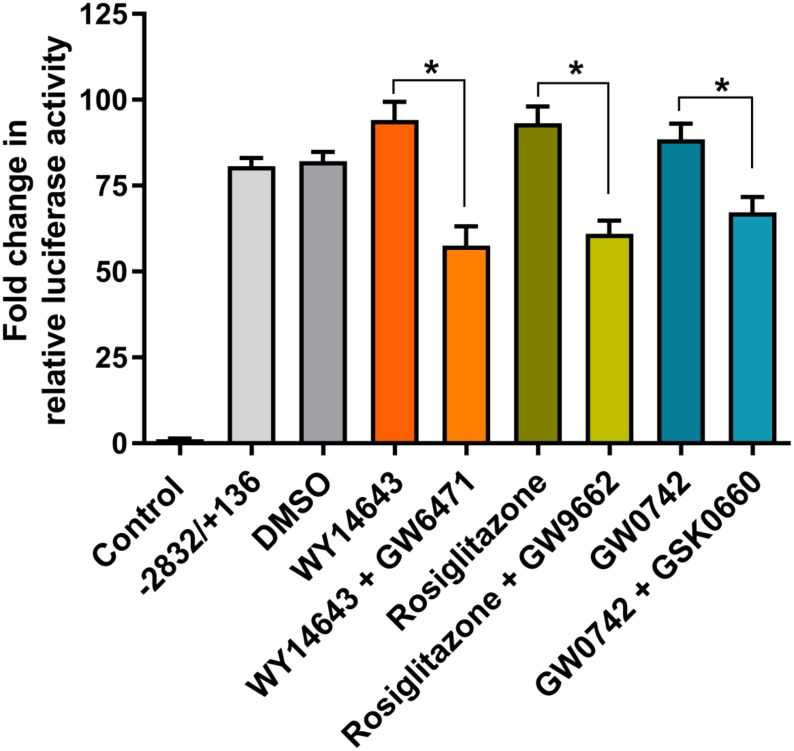
To further determine the specificity of each of the PPAR agonists, we performed a competition experiment using a 100 μM agonist and an equimolar concentration of antagonist. The mouse Mogat1 promoter luciferase-reporter construct (-2832/+136 bp) was activated by PPARα agonist WY14643. This activation was inhibited ~34-fold in the presence of PPAR antagonist GW6471 (Fig 7). Similarly, Mogat1 promoter activation by the PPARγ agonist rosiglitazone was inhibited ~32-fold by its antagonist GW9662. The activation of Mogat1 promoter by GW0742 was inhibited by ~20-fold in the presence of its antagonist, GSK0660. The competition between PPARβ/δ agonist and antagonist was not as strong as those observed for PPARα and PPARγ. This further shows the specificity of each of the PPAR agonist used in this study.
Fig 7. Specificity of PPAR agonists in HK-2 cells.
Changes in the relative luciferase activity of the mouse Mogat1 promoter (-2832/+136) consisting of both the PPRE sites in the presence of PPARα agonist WY16463 and its antagonist GW6471; PPARγ agonist rosiglitazone and its antagonist GW9662; and PPARβ/δ agonist GW0742 and its antagonist GSK0660. Shown are the fold changes compared to the pGL3-basic construct and normalized to protein. Bars represent mean±SEM (n = 3–4) performed in duplicate. *p value ≤ 0.05 shows the statistical significance between PPAR specific agonist and antagonist.
Fatty acids and phosphatidic acids do not activate Mogat1 in primary mouse hepatocytes
Fatty acids and fatty acid derived molecules have been shown to activate PPARs [29]. Fatty acids for this study were chosen based on the findings from Xu et al. [30]. Primary mouse hepatocytes isolated from the livers of WT mice were incubated with BSA-conjugated fatty acids (300μM). Mogat1 expression remained unchanged in the presence of all fatty acids tested: the saturated fatty acids palmitic acid (C16:0) and stearic acid (C18:0), monounsaturated oleic acid (C18:1), and polyunsaturated arachidonic acid (C20:4) (S2 Fig).
We have previously observed that PA induced the expression of gluconeogenic genes in primary mouse hepatocytes [15]. We measured Mogat1 expression in the presence of PA species which have been shown to increase gluconeogenesis in primary hepatocytes of Agpat2-/- mice. Mogat1 expression in Agpat2-/- hepatocytes remained unchanged in the presence of C16:0/18:1 PA (~0.2 fold decrease). This suggests that PA did not have any role in the transcriptional regulation of Mogat1 expression.
ChIP assay confirms occupation of PPRE site in Mogat1 promoter by PPARα
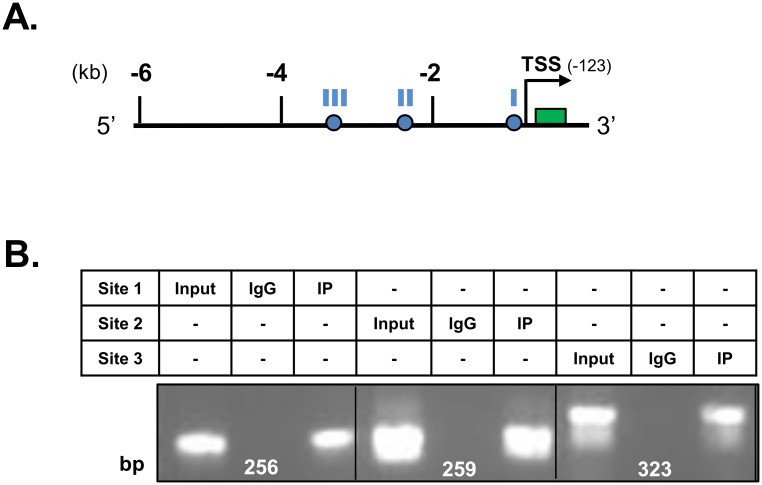
We have shown above that PPARα regulates Mogat1 transcription. To further validate whether the mouse Mogat1 PPRE sites are occupied by PPARα, we performed chromatin immunoprecipitation (ChIP) assays. The mouse kidney homogenate was immunoprecipitated with anti-IgG and anti-PPARα antibodies and DNA was amplified. Although all PPRE sites were occupied by PPARα (Fig 8A and 8B), it seems that the proximal two PPRE sites are sufficient to regulate Mogat1 promoter by its ligand.
Fig 8. Chromatin immunoprecipation (ChIP) assay for binding of peroxisome proliferator response element (PPRE) on Mogat1 promoter.
A. Schematic of mouse Mogat1 promoter showing the three PPRE sites located at -592 (site I), -2518 (site II) and -3747 (site III) bp in relation to ATG. Circles represent PPRE sites, the green box is exon 1 and the arrow head represents the TSS. B. Mouse kidney homogenate was immunoprecipitated with PPARα antibody and the PPRE sites were amplified with respective primer pairs. The immunoprepcipitated DNA fragment was sequenced and contained the desired nucleotide sequences. All 3 PPRE sites are occupied by PPARα. Shown is the representative image from replicate experiments (n = 2).
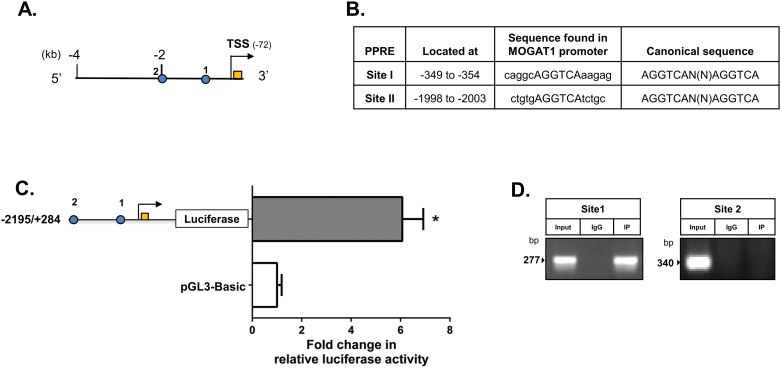
Bioinformatics also predicted two PPRE sites in the ~2 kb upstream region of human MOGAT1 promoter. The two PPRE sites are located at -349 and -1998 bp (Fig 9A and 9B). Several other predicted TF binding sites are shown in Table 2. To determine if these PPRE sites regulate the MOGAT1 promoter, we generated a promoter luciferase-reporter construct consisting of the -2195/+284 region. HK-2 cells transfected with this construct showed a 6-fold increase in luciferase activity (Fig 9C). ChIP assay confirmed that only one site (present at -349) is occupied by PPARα (Fig 9D).
Fig 9. Chromatin immunoprecipation (ChIP) assay for binding of peroxisome proliferator response element (PPRE) located in MOGAT1 promoter.
A. Schematic of human MOGAT1 promoter showing the two PPRE sites located at -349 (site 1) and -1998 (site 2) bp in relation to ATG. Circles represent PPRE sites, the orange box is exon 1 and the arrow head represents the transcriptional start site (TSS). B. Shown are the locations and sequences of the PPRE sites found in the human promoter. C. Transient transfection of human MOGAT1 promoter construct in HK-2 cells. Bars represent the fold changes in relative luciferase activity shown as mean±SEM (n = 3) performed in duplicate. D. ChIP assay in cell lysate from HK-2 cells probed with PPARα antibody and the amplified product analyzed on 1.5% agrose gel. Among the two PPRE sites only site 1 located at -349 was occupied by PPARα. Shown is the representative image from replicate experiments (n = 2).
Table 2. Predicted transcription factors (TFs) in ~20 kb region of human MOGAT1 promoter.
The putative TF binding sites were identified by bioinformatics tools, TESS and TRANSFAC. Shown are only few of the transcription factors present in regions A to F.
| TFBS | Region A | No. of sites | Region B | No. of sites | Region C | No. of sites | Region D | No. of sites | Region E | No. of sites | Region F | No. of sites | Canonical sequence |
|---|---|---|---|---|---|---|---|---|---|---|---|---|---|
| alcohol dehydrogenase regulator 1 | ADR1 | 2 | ADR1 | 14 | ADR1 | 5 | ADR1 | 13 | ADR1 | 7 | ADR1 | 2 | GGAGA |
| helix-loop-helix transcription factor | E12 | 1 | E12 | 4 | E12 | 1 | E12 | 1 | E12 | 2 | E12 | 1 | CAACTG or CAGCTG or CATCTG |
| Heat shock transcription factor | HSTF | 12 | HSTF | 12 | HSTF | 12 | HSTF | 19 | HSTF | 18 | HSTF | 10 | AGAAA |
| CCCTC-binding factor (zinc finger protein) | CTCF | 15 | CTCF | 12 | CTCF | 6 | CTCF | 12 | CTCF | 1 | CTCF | 5 | CCCTC |
| Yin Yang 1 | YY1 | 1 | YY1 | 7 | YY1 | 5 | YY1 | 11 | YY1 | 30 | YY1 | 3 | ANATGG |
| Hepatocyte nuclear factor | HNF-3 | 1 | HNF-3 | 3 | HNF-3 | 4 | HNF-3 | 6 | HNF-3 | 5 | GTAAATA or TATTTGT | ||
| Pituitary-specific positive transcription factor | POU1f1a | 2 | POU1f1a | 7 | POU1F1a | 6 | POU1F1a | 9 | POU1F1a | 17 | TAAAT | ||
| T-cell acute lymphocytic leukemia 1 | Tal-1 | 1 | Tal-1 | 10 | Tal-1 | 3 | Tal-1 | 5 | TAL-1 | 1 | CACCTG | ||
| homeobox | HOXA5 | 2 | HOXA5 | 6 | HOXA5 | 3 | HOXA5 | 1 | HOXA5 | 4 | CTGATG | ||
| Upstream stimulatory factor 1 | USF-1 | 1 | USF-1 | 9 | USF1 | 1 | USF1 | 1 | USF1 | 2 | CACATG | ||
| Nuclear factor | NF-1/L | 3 | NF-1/L | 8 | NF-1/L | 7 | NF-1/L | 4 | NF-1/L | 6 | TGGCA(N5)TGCCA | ||
| Steroidogenic factor 1 | SF-1 | 1 | SF-1 | 2 | SF-1 | 2 | SF-1 | 1 | SF-1 | 1 | CCAAGGTCA | ||
| CCAAT displacement protein | CUTL1 | 15 | CUTL1 | 2 | CUTL1 | 1 | CACATG | ||||||
| Actin-Related Protein 1 | ARP-1 | 2 | ARP-1 | 5 | |||||||||
| hematopoietic transcription factor | PU.1 | 1 | PU.1 | 3 | TTCCTC | ||||||||
| Ecotropic viral integration site 1 | Evi-1 | 1 | Evi-1 | 4 | TGACAAGATAA | ||||||||
| Peroxisome proliferator activator protein | PPAR-a | 2 | PPAR-a | 1 | AGGTCA | ||||||||
| CCAAT/enhancer-binding protein alpha | alpha-CBF | 1 | alpha-CBF | 1 | alpha-CBF | 1 | alpha-CBF | 1 | ATTGGGCAAT | ||||
| POU class 2 homeobox 1 | POU2F1 | 1 | POU2F1 | 1 | POU2F1 | 3 | POU2F1 | 3 | ATTCCATTA | ||||
| core-binding factor alpha | C/EBPbeta | 4 | C/EBPbeta | 3 | C/EBP | 4 | |||||||
| hepatocyte-specific nuclear protein | APF-1 | 2 | APF-1 | 1 | CTGGAAA | ||||||||
| estrogen receptor | ER | 4 | ER | 9 | ER | 1 | GGGGCGGGG or GGTGTGGGG | ||||||
| Specific protein | SP-1 | 1 | SP-1 | 8 | GGTCANNNTGACC | ||||||||
| Activator protein 1 | AP-1 | 3 | TGA[G/C]TCA | ||||||||||
| homeobox-containing transcription factor | Nkx2-5 | 1 | TYAAGTG |
Chromosome conformation capture (3C) assay in HK-2 cells confirms long range DNA looping interactions of human MOGAT1 promoter
The above study of the Mogat1 proximal promoter reveals basic cis-regulatory elements for its transcriptional activation, but not in the context of a whole genome. The functional connectivity of genes and regulatory elements can be mapped by identification of physical interactions between them. To analyze the frequency of interaction and proximity between any two genomic loci and their impact on gene expression, Dekker and colleagues developed the 3C assay [31]. This method pulls down the long range interacting complexes and helps to further reveal the cis-interacting elements which come in close proximity to each other in the presence of enhancers or suppressors. The principle behind this method is to crosslink the trans-interacting protein(s) to the chromatin DNA in the intact nuclei. The protein-DNA complexes are digested and ligated for capturing the intra- or inter-molecular interactions. The ligated DNA is reverse-crosslinked and amplified by PCR using specific primer sets to identify the interacting genomic region.
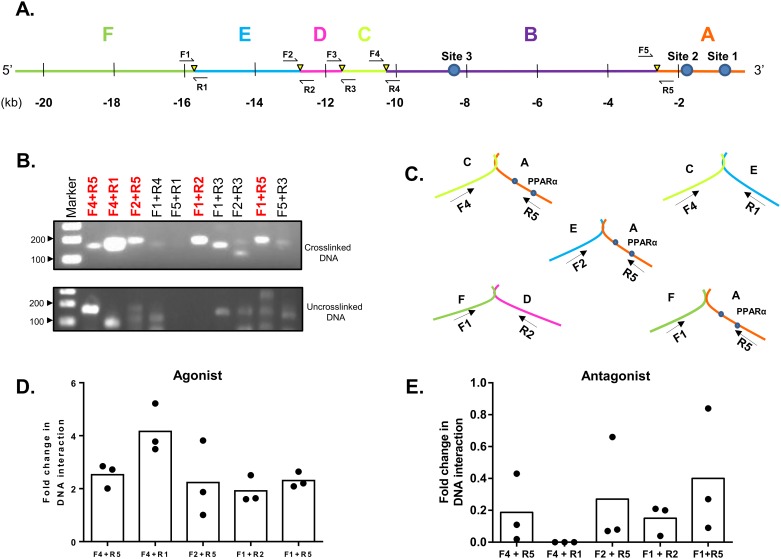
We initially attempted the 3C assay in the mouse whole kidney and kidney primary cells. Despite our efforts, we could not get the 3C assay to work reliably and it will require further optimization for detecting the DNA-DNA interactions in the mouse kidney. However, we were successful in detecting the long range genomic interactions using HK-2 cells, which is our chosen cell culture model. Various combinations of primer sets were used to amplify the possible DNA interacting regions (Fig 10A). The PCR product obtained with primer pairs F4 and R5 confirmed an interaction between regions C and A of the MOGAT1 promoter (Fig 10B). Similarly PCR products with primer pairs F2 and R5 confirmed an interaction between regions E and A (Fig 10B). Genomic region F interacts with two regions: A and D. Similarly, region A, which contains the PPARα sites, interacts with the three regions C, E and F. All the PCR products obtained were sequenced to verify the predicted sequence. How these interactions are brought about, or the sequence in which these interactions occur, is still unclear. These interactions suggest that the PPARα site present in the region A was most active and formed more loops with the distant upstream regions compared to other PPARα sites.
Fig 10. Chromosome conformation capture (3C) assay of human MOGAT1 in HK-2 cells.
A. Schematic of the ~20 kb region of the MOGAT1 promoter drawn to scale showing BglII sites (yellow triangles) and PPRE sites (filled circles). The DNA fragments formed after BglII digestion are marked as A, B, C, D and E. B. DNA fragments from crosslinked and un-crosslinked samples were amplified using primer pairs shown in panel A and analyzed on a 2% agarose gel. C. Schematic for various DNA-DNA interactions which were further confirmed by sequencing. D-E. RT-qPCR analysis of the five DNA-DNA interactions in the presence of WY16463 (PPARα agonist) and GW6471 (PPARα antagonist). Dots represent individual experiments and bars represent the mean from three independent experiments.
These DNA-DNA interactions are responsive to PPARα agonist and antagonist. Real time PCR data demonstrated a ~2.8-fold increase in DNA-DNA interaction between regions C and A in the presence of PPARα agonist WY14643 and a negligible decrease (~0.2-fold) in the interaction in the presence of PPARα antagonist GW6471 (Fig 10D and 10E). Similarly, a ~4-fold increase in DNA-DNA interaction between regions C and E in the presence of WY14683 and a complete inhibition in the presence of GW6471 was observed. The interaction at regions E and A showed a ~2-fold increase in the presence of the agonist and a negligible decrease (0.3-fold) in the presence of the antagonist. The interaction between regions F and D was least responsive compared to other regions with only ~1.8-fold increase in the presence of agonist. DNA-DNA interaction between regions F and A showed ~2.2-fold increase in the DNA interaction in the presence of WY14643 and a negligible decrease (~0.4-fold) in the presence of antagonist. Though all the interactions showed a change in the presence of agonist and antagonist, the most effective interaction seemed to be between regions C and E suggesting that, apart from PPRE, other regulatory elements also participate in Mogat1 transcriptional regulation.
Study of Mogat1 in rat hepatic tumor cells (HTC)
We also attempted to verify the expression of Mogat1 in HTC cells. Interestingly, though Mogat1 is minimally expressed in the adult liver, we could amplify exons 4–6 of Mogat1 in HTC cells (Fig 1D). To confirm whether the entire open reading frame (ORF) of Mogat1 is expressed in these cells we used additional primers located in the entire ORF. The primers were designed based on the in silico prediction of the rat Mogat1 gene. Based on the “multiz align and conservation” at the UCSC genome browser we noted that human, mouse and rat Mogat1 exon-intron boundary and gene structure is highly conserved (S3A Fig). Based on the predicted cDNA for rat Mogat1 we were only able to amplify exons 4–6 (S3B and S3C Fig). Our repeated attempts to amplify exons 1–3 remained unsucessful. This might be due to chromosomal rearrangement in HTC cells. Nevertheless, the amplification of exons 4–6 also suggests that the promoter region for the expression of Mogat1 is still intact. Since our studies are directed towards the analysis of the Mogat1 promoter we believe that HTC cells could represent the liver cells and be useful in analyzing the Mogat1 promoter.
The endogenous expression of PPARs were quantified by real-time PCR in the HTC cells. The expression pattern of PPARs in the HTC cells are different than those of HK-2 cells. The highest expressing isoform was PPARβ/δ followed by PPARα and PPARγ (Fig 11A). The predicted PPREs are highly conserved amongst the species as shown in Fig 5A. To measure whether these PPARs are biologically active in HTC cells we measured the activation of Mogat1 in the presence of agonists and antagonists for all three PPAR isoforms. Mogat1 expression was increased ~5-, 5- and 8-fold in the presence of agonist (100 μM) for PPARα (WY14643), PPARγ (rosiglitazone) and PPAR β/δ (GW0742) (Fig 11B). On the other hand, in the presence of antagonist (100 μM) for PPARα (GW6471), PPARγ (GW9662) and PPARβ/δ (GSK0660) Mogat1 expression was inhibited ~0.8-, 0.8- and 0.6-fold, respectively. Except for the inhibition of Mogat1 by PPARγ (GW9662), none reached statistical significance (Fig 11B). To verify if these PPARs could activate the promoter we measured the activation of the mouse Mogat1 promoter luciferase-reporter construct (-2832/+136 bp) in the presence or absence of PPAR agonists and antagonists. Interestingly, we observed that only PPARα and PPARβ/δ agonists activated the promoter while PPARγ agonist had no effect. In the presence of PPARα agonist (WY14643) and PPARβ/δ agonist (GW0742) a ~9- and ~10-fold increase in the luciferase reporter gene was observed, respectively (Fig 11C). On the other hand, while PPARγ agonist (rosiglitazone) had no effect on the luciferase reporter gene, PPARγ antagonist, GW9662, was the most effective in inhibiting the expression of Mogat1 (~7-fold decrease).
Fig 11. Expression of PPAR isoforms, their activation and inhibition of Mogat1 in rat hepatic tumor (HTC) cells.
A. RT-qPCR analysis of PPAR isoform expression in HTC cells. All the PPAR isoforms are compared with each other. PPARβ/δ > PPARα > PPARγ (n = 5). B. RT-qPCR analysis of Mogat1 expression in HTC cells treated with 100μM of various agonists and antagonists of PPAR isoforms. Bars represent mean±SEM (n = 5) performed in duplicate. C. Changes in the relative luciferase activity of the mouse Mogat1 promoter (-2832/+136) consisting of both the PPRE sites in the presence of PPAR agonists (100μM; PPARα-WY16463, PPARγ-rosiglitazone and PPARβ/δ-GW0742) and antagonists (100μM; PPARα-GW6471, PPARγ-GW9662, PPARβ/δ-GSK0660). Shown are the fold changes compared to the pGL3-basic construct and normalized to protein. Bars represent mean±SEM (n = 5) performed in duplicate. *p value ≤ 0.05.
We then attempted the 3C assay in HTC cells as performed in HK-2 cells. In the rat Mogat1 promoter we found that HindIII restriction sites were evenly distributed and could reasonably cross-link DNA-DNA interactions. Primer pairs were designed across a ~20 kb region of rat Mogat1 promoter and amplified the possible DNA-DNA interacting regions (S4A Fig). All the primer pairs could amplify the DNA regions in the uncross-linked control genomic DNA (S4B Fig) which were confirmed by sequencing. However, we were unsuccessful in amplifying any DNA-DNA interacting regions as we saw in the HK-2 cells. The only DNA interaction we observed was with primers F2 and R6 located in regions ‘I’ and ‘D’ of the rat Mogat1 promoter (S4A Fig). Though the amplified product shown in S4C Fig was of expected size, only the region downstream from primer F2 was verifiable by sequencing but not from R6 primer. Upon nucleotide homology search (NCBI BLAST program), the sequences amplified by R6 primer did not match the expected sequences.
Discussion
In this study we provide an extensive and detailed characterization of the mouse and human Mogat1 promoter in kidney and hepatic cell lines. We show that both mouse and human MOGAT1 promoters lack TATA-box and initiator (Inr) sequences or a downstream core promoter element (DPE) [22, 32]. However, promoters for both the species have CpG island (CGI). GC-rich regions are found in the proximal regions of several promoters which are shown to initiate transcription [23].
Human kidney expresses a truncated MOGAT1 transcript (this study) but this is not the case in the mouse kidney. Evolutionary conservation of genes shows that only those genes, and by extension proteins, which are functionally required in animals’ physiology survive. It is unclear why it is expressed in the mouse kidney as a functionally active protein, while in the human kidney it is alternatively spliced to generate a catalytically inactive enzyme. It could be speculated that during evolution the expression of catalytically active Mogat1 protein interfered with human kidney physiology and was inactivated by an alternative splicing mechanism. Similar to the human kidney, the human liver also expresses the alternatively spliced MOGAT1 transcript [19]. The importance of alternative splicing of transcripts in mammalian physiology which results in pathological conditions, including cancer, is well established [33]. To further understand the species and tissue-specific alternative splicing of MOGAT1, a greater knowledge of the molecular mechanisms involved in its alternative splicing is required.
While our goal was to understand the transcriptional regulation of Mogat1 to devise additional ways to suppress hepatic TAG synthesis, targeted genetic deletion of Mogat1 in Agpat2-/- and ob/ob genetic backgrounds did not attenuate the hepatic TAG [8]. It should also be noted that Mogat1 is highly expressed in tissues like the kidney and stomach which are not known to synthesize any significant levels of neutral lipids such as DAG or TAG. The function of Mogat1 in these tissues is still unclear. Mogat1 can synthesize DAG from MAG. DAG is a signaling molecule on its own and is also a precursor for phospholipid synthesis. Phospholipids are critical lipids both as signaling molecules and by providing a structural backbone for cellular membranes. From this perspective, the characterization of the Mogat1 promoter (the current study) will provide a lead to study its role in these tissues. Although we were unable to show a robust decrease in liver TAG or improved glucose tolerance in the Mogat1-/-;Agpat2-/- and Mogat1-/-;ob/ob mice [8], it might still be possible to further understand the transcriptional regulation of Mogat1 in other tissues like stomach and kidney.
We also show that PPARα agonist and antagonist also modulate the ~2.8 kb mouse Mogat1 promoter activity when expressed in HK-2 cells. This suggests that PPARα also modulates Mogat1 promoter activity (this study), in addition to PPARγ which also occupies the PPRE site [30]. Similarly, the human MOGAT1 promoter also contains PPRE sites which are occupied by PPARα as determined by ChIP assay. Two recent reports [9, 10] also show that PPARγ directly binds to the PPRE in the mouse and human Mogat1 proximal promoter and activates its expression. These experiments were conducted in 293T, HepG2 cells and primary human hepatocytes. From these studies it is also unclear whether PPARγ is the only receptor that could activate MOGAT1. Reduction in the levels of liver TAG and expression of liver Mogat1 have been achieved both by using antisense oligonucleotide (ASO) inhibition in obese mice and were also observed in a liver specific PPARγ knockout mouse on a high fat diet [6]. On the other hand, we show that PPRE in mouse Mogat1 is capable of responding to all three PPARs (using agonists and antagonists) and also that PPARα specifically occupies the putative PPRE site in-vivo (ChIP assay).
In hepatic steatosis, expression of several genes is dysregulated, including PPARγ and PPARα. While PPARγ has been studied previously [9, 10], from the clinical perspective PPARγ agonist might not be the best therapeutic agent due to the risk of developing heart failure [34]. PPARγ antagonist also might not be beneficial because it will interfere with adipogenesis. Therefore, we focused our study on characterizing the interaction of Mogat1 with PPARα. PPARα increases hepatic fatty acid oxidation and prevents hepatic steatosis [35]. Pparα-/- mice display increased hepatic steatosis, oxidative stress, and inflammation when fed a high fat diet [36, 37] but not on normal chow. Thus, inhibiting its activity in a clinical setting might not yield the desired results of reducing hepatic fat. Therefore, inhibiting either PPAR isoform will not be beneficial. Futher studies are required to explore the role of PPARβ/δ reported in this study.
The most interesting observation of this study is the long range DNA-DNA interaction which brings together upstream cis-elements to regulate transcriptional activation of Mogat1. Our 3C assay shows at least five different DNA-DNA interactions where the DNA region A, (DNA fragments named A-E for convenience, Fig 10A), which has the PPARα sites, interacts with regions C, E and F. However, region B, which also harbors a PPRE site, showed no interaction with any of the flanking regions and thus this PPRE site most likely did not contribute towards Mogat1 transcriptional activiation in the context of the whole genome. In the presence of PPARα agonist, interaction between regions C and E was enhanced and conversely, this interaction was almost undetectable with PPARα antagonist (Fig 10D and 10E). This reveals that the regions C and E interact with A and thus regulate the expression of Mogat1.
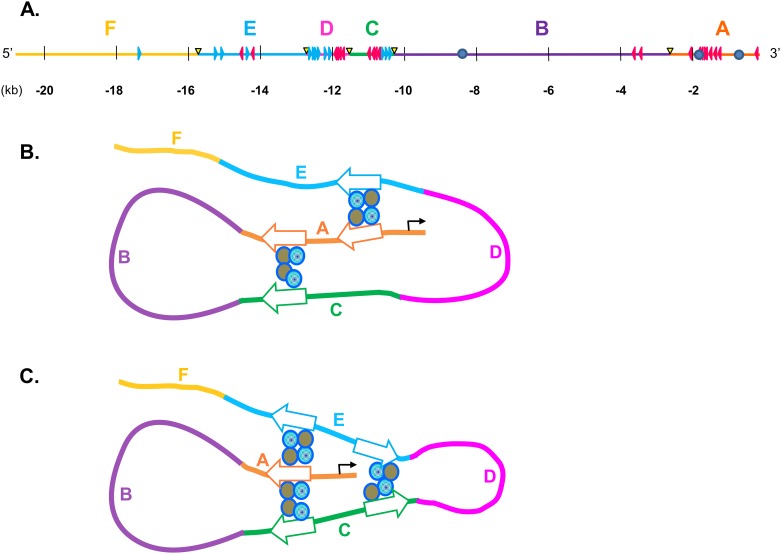
In silico analysis of the MOGAT1 5’-regulatory region predicts several TFs (Table 2). The most interesting seems to be CCCTC-binding factor (CTCF) [38, 39]. CTCF has been shown to play an important role as a modulator of transcription by forming DNA loops between promoters and enhancers [39]. DNA interactions occur when the CTCF cis-elements are in opposite orientation [40]. Thus, based on the predicted CTCF sites and orientation (Fig 12A), we speculate that CTCF might have a significant role in making extensive DNA-DNA contact, looping and regulation of MOGAT1 transcription and tissue specific expression. Although precise sequential interaction is unclear, we speculate (as illustrated in Fig 12B) that region A binds to regions E and C which brings these regions (E and C) in close proximity for DNA-DNA interaction (Fig 12C).
Fig 12. Predicted CCCTC-binding factor (CTCF) sites in the ~20 kb region of human MOGAT1 promoter and possible interaction.
A. MOGAT1 promoter drawn to scale showing BglII sites (yellow triangles). The orientation of CTCF sites are shown as they occur in the promoter. Blue triangles represent sites present in forward orientation and red triangles represent sites present in reverse orientation. B-C. Speculative schematic for DNA-DNA interactions as determined by chromosome conformation capture (3C) assay. CTCF sites are shown to interact with each other in opposite orientation and require cohesin protein, shown as circles. The arrow heads show the orientation of CTCF sites. All regions are color coded and labeled A-F for clarity.
In the current study we have identified upstream DNA regions which are responsive to PPARα agonist and antagonist adding new regulatory elements for the regulation of Mogat1. As mentioned above, Mogat1 is expressed in tissues not involved in lipid synthesis. Mogat1 function in these tissues is not characterized and thus this study provides the basis to further explore its function.While developing tissue specific animal models could be labor intensive, a CRISPR/Cas9-based (clustered regularly interspaced short palindromic repeats/CRISPR-associated) genome editing system could be employed to modulate gene expression. This would help identify the function of MOGAT1 in non-lipid synthesizing tissues. This study also shows that deleting the PPRE or upstream elements (responsive to PPARs) has reduced the Mogat1 promoter activity by several fold. Recently, Li., et al [41] developed a CRISPR/Cas9 based method for inverting, duplicating, and deleting mammalian DNA fragments of small regulatory elements and large gene clusters which could be very useful to control gene expression. Thus, PPRE sites could be deleted in the Mogat1 promoter using the CRISPR/Cas9 system, thereby inhibiting the binding of PPARs but not affecting the PPARs protein function. This could be an alternative strategy to suppress Mogat1 expression in specific tissues.
Supporting Information
(TIF)
(TIF)
(TIF)
(TIF)
(DOCX)
(DOCX)
Acknowledgments
Authors thank Katie Tunison for copy editing. This work was supported by a grant from National Institutes of Health; R01-DK54387
Data Availability
All relevant data are within the paper and its Supporting Information files.
Funding Statement
This work was supported by a grant from National Institutes of Health; R01-DK54387.
References
- 1. Kennedy EP. The synthesis of cytidine diphosphate choline, cytidine diphosphate ethanolamine, and related compounds. J Biol Chem. 1956;222(1):185–91. Epub 1956/09/01. . [PubMed] [Google Scholar]
- 2.Mostafa N, Bhat BG, Coleman RA. Increased hepatic monoacylglycerol acyltransferase activity in streptozotocin-induced diabetes: characterization and comparison with activities from adult and neonatal rat liver. Biochim Biophys Acta. 1993;1169(2):189–95. Epub 1993/08/11. 0005-2760(93)90205-N [pii]. . [DOI] [PubMed] [Google Scholar]
- 3.Yen CL, Stone SJ, Cases S, Zhou P, Farese RV Jr. Identification of a gene encoding MGAT1, a monoacylglycerol acyltransferase. Proc Natl Acad Sci U S A. 2002;99(13):8512–7. Epub 2002/06/22. 10.1073/pnas.132274899 132274899 [pii] [DOI] [PMC free article] [PubMed] [Google Scholar]
- 4.Cortes VA, Curtis DE, Sukumaran S, Shao X, Parameswara V, Rashid S, et al. Molecular mechanisms of hepatic steatosis and insulin resistance in the AGPAT2-deficient mouse model of congenital generalized lipodystrophy. Cell metabolism. 2009;9(2):165–76. Epub 2009/02/04. doi: S1550-4131(09)00003-5 [pii] 10.1016/j.cmet.2009.01.002 [DOI] [PMC free article] [PubMed] [Google Scholar]
- 5.Hayashi Y, Suemitsu E, Kajimoto K, Sato Y, Akhter A, Sakurai Y, et al. Hepatic Monoacylglycerol O-acyltransferase 1 as a Promising Therapeutic Target for Steatosis, Obesity, and Type 2 Diabetes. Molecular therapy Nucleic acids. 2014;3:e154 10.1038/mtna.2014.4 [DOI] [PMC free article] [PubMed] [Google Scholar]
- 6.Hall AM, Soufi N, Chambers KT, Chen Z, Schweitzer GG, McCommis KS, et al. Abrogating monoacylglycerol acyltransferase activity in liver improves glucose tolerance and hepatic insulin signaling in obese mice. Diabetes. 2014;63(7):2284–96. 10.2337/db13-1502 [DOI] [PMC free article] [PubMed] [Google Scholar]
- 7.Soufi N, Hall AM, Chen Z, Yoshino J, Collier SL, Mathews JC, et al. Inhibiting monoacylglycerol acyltransferase 1 ameliorates hepatic metabolic abnormalities but not inflammation and injury in mice. J Biol Chem. 2014;289(43):30177–88. 10.1074/jbc.M114.595850 [DOI] [PMC free article] [PubMed] [Google Scholar]
- 8.Agarwal AK, Tunison K, Dalal JS, Yen CL, Farese RV Jr., Horton JD, et al. Mogat1 deletion does not ameliorate hepatic steatosis in lipodystrophic (Agpat2-/-) or obese (ob/ob) mice. J Lipid Res. 2016;57(4):616–30. 10.1194/jlr.M065896 [DOI] [PMC free article] [PubMed] [Google Scholar]
- 9.Yu JH, Lee YJ, Kim HJ, Choi H, Choi Y, Seok JW, et al. Monoacylglycerol O-acyltransferase 1 is regulated by peroxisome proliferator-activated receptor gamma in human hepatocytes and increases lipid accumulation. Biochem Biophys Res Commun. 2015;460(3):715–20. 10.1016/j.bbrc.2015.03.095 . [DOI] [PubMed] [Google Scholar]
- 10.Lee YJ, Ko EH, Kim JE, Kim E, Lee H, Choi H, et al. Nuclear receptor PPARgamma-regulated monoacylglycerol O-acyltransferase 1 (MGAT1) expression is responsible for the lipid accumulation in diet-induced hepatic steatosis. Proc Natl Acad Sci U S A. 2012;109(34):13656–61. 10.1073/pnas.1203218109 [DOI] [PMC free article] [PubMed] [Google Scholar]
- 11.Matys V, Kel-Margoulis OV, Fricke E, Liebich I, Land S, Barre-Dirrie A, et al. TRANSFAC and its module TRANSCompel: transcriptional gene regulation in eukaryotes. Nucleic Acids Res. 2006;34(Database issue):D108–10. 10.1093/nar/gkj143 [DOI] [PMC free article] [PubMed] [Google Scholar]
- 12.Stothard P. The sequence manipulation suite: JavaScript programs for analyzing and formatting protein and DNA sequences. Biotechniques. 2000;28(6):1102, 4. . [DOI] [PubMed] [Google Scholar]
- 13.Anonymous. Northern blotting: transfer of denatured RNA to membranes. Nature Methods. 2005;2:997–8. [Google Scholar]
- 14.Aparicio O, Geisberg JV, Sekinger E, Yang A, Moqtaderi Z, Struhl K. Chromatin immunoprecipitation for determining the association of proteins with specific genomic sequences in vivo. Current protocols in molecular biology / edited by Frederick M Ausubel [et al. ]. 2005;Chapter 21:Unit 21 3 10.1002/0471142727.mb2103s69 . [DOI] [PubMed] [Google Scholar]
- 15.Sankella S, Garg A, Horton JD, Agarwal AK. Hepatic gluconeogenesis is enhanced by phosphatidic acid which remains uninhibited by insulin in lipodystrophic Agpat2-/- mice. J Biol Chem. 2014;289:4762–77. Epub 2014/01/16. doi: M113.530998 [pii] 10.1074/jbc.M113.530998 . [DOI] [PMC free article] [PubMed] [Google Scholar]
- 16.Pappas A, Anthonavage M, Gordon JS. Metabolic fate and selective utilization of major fatty acids in human sebaceous gland. J Invest Dermatol. 2002;118(1):164–71. 10.1046/j.0022-202x.2001.01612.x . [DOI] [PubMed] [Google Scholar]
- 17.Deshane J, Kim J, Bolisetty S, Hock TD, Hill-Kapturczak N, Agarwal A. Sp1 regulates chromatin looping between an intronic enhancer and distal promoter of the human heme oxygenase-1 gene in renal cells. J Biol Chem. 2010;285(22):16476–86. 10.1074/jbc.M109.058586 [DOI] [PMC free article] [PubMed] [Google Scholar]
- 18.Yen CL, Farese RV Jr. MGAT2, a monoacylglycerol acyltransferase expressed in the small intestine. J Biol Chem. 2003;278(20):18532–7. Epub 2003/03/07. 10.1074/jbc.M301633200M301633200 [pii] . [DOI] [PubMed] [Google Scholar]
- 19.Hall AM, Kou K, Chen Z, Pietka TA, Kumar M, Korenblat KM, et al. Evidence for regulated monoacylglycerol acyltransferase expression and activity in human liver. J Lipid Res. 2012;53(5):990–9. Epub 2012/03/08. doi: jlr.P025536 [pii] 10.1194/jlr.P025536 [DOI] [PMC free article] [PubMed] [Google Scholar]
- 20.Yu JH, Song SJ, Kim A, Choi Y, Seok JW, Kim HJ, et al. Suppression of PPARgamma-mediated monoacylglycerol O-acyltransferase 1 expression ameliorates alcoholic hepatic steatosis. Scientific reports. 2016;6:29352 10.1038/srep29352 [DOI] [PMC free article] [PubMed] [Google Scholar]
- 21.Zhao X, Herr W. A regulated two-step mechanism of TBP binding to DNA: a solvent-exposed surface of TBP inhibits TATA box recognition. Cell. 2002;108(5):615–27. . [DOI] [PubMed] [Google Scholar]
- 22.Smale ST, Kadonaga JT. The RNA polymerase II core promoter. Annu Rev Biochem. 2003;72:449–79. 10.1146/annurev.biochem.72.121801.161520 . [DOI] [PubMed] [Google Scholar]
- 23.Deaton AM, Bird A. CpG islands and the regulation of transcription. Genes Dev. 2011;25(10):1010–22. 10.1101/gad.2037511 [DOI] [PMC free article] [PubMed] [Google Scholar]
- 24.Westwood JT, Clos J, Wu C. Stress-induced oligomerization and chromosomal relocalization of heat-shock factor. Nature. 1991;353(6347):822–7. 10.1038/353822a0 . [DOI] [PubMed] [Google Scholar]
- 25.Xie Y, Chen C, Stevenson MA, Auron PE, Calderwood SK. Heat shock factor 1 represses transcription of the IL-1beta gene through physical interaction with the nuclear factor of interleukin 6. J Biol Chem. 2002;277(14):11802–10. 10.1074/jbc.M109296200 . [DOI] [PubMed] [Google Scholar]
- 26.Chan SM, Sun RQ, Zeng XY, Choong ZH, Wang H, Watt MJ, et al. Activation of PPARalpha ameliorates hepatic insulin resistance and steatosis in high fructose-fed mice despite increased endoplasmic reticulum stress. Diabetes. 2013;62(6):2095–105. 10.2337/db12-1397 [DOI] [PMC free article] [PubMed] [Google Scholar]
- 27.Bardot O, Clemencet MC, Passilly P, Latruffe N. The analysis of modified peroxisome proliferator responsive elements of the peroxisomal bifunctional enzyme in transfected HepG2 cells reveals two regulatory motifs. FEBS Lett. 1995;360(2):183–6. . [DOI] [PubMed] [Google Scholar]
- 28.Desvergne B, Wahli W. Peroxisome proliferator-activated receptors: nuclear control of metabolism. Endocr Rev. 1999;20(5):649–88. 10.1210/edrv.20.5.0380 . [DOI] [PubMed] [Google Scholar]
- 29.Krey G, Braissant O, L'Horset F, Kalkhoven E, Perroud M, Parker MG, et al. Fatty acids, eicosanoids, and hypolipidemic agents identified as ligands of peroxisome proliferator-activated receptors by coactivator-dependent receptor ligand assay. Mol Endocrinol. 1997;11(6):779–91. 10.1210/mend.11.6.0007 . [DOI] [PubMed] [Google Scholar]
- 30.Xu HE, Lambert MH, Montana VG, Parks DJ, Blanchard SG, Brown PJ, et al. Molecular recognition of fatty acids by peroxisome proliferator-activated receptors. Mol Cell. 1999;3(3):397–403. . [DOI] [PubMed] [Google Scholar]
- 31.Dekker J, Rippe K, Dekker M, Kleckner N. Capturing chromosome conformation. Science. 2002;295(5558):1306–11. Epub 2002/02/16. 10.1126/science.1067799295/5558/1306 [pii] . [DOI] [PubMed] [Google Scholar]
- 32.Venters BJ, Pugh BF. Genomic organization of human transcription initiation complexes. Nature. 2013;502(7469):53–8. 10.1038/nature12535 [DOI] [PMC free article] [PubMed] [Google Scholar] [Retracted]
- 33.Daguenet E, Dujardin G, Valcarcel J. The pathogenicity of splicing defects: mechanistic insights into pre-mRNA processing inform novel therapeutic approaches. EMBO reports. 2015. 10.15252/embr.201541116 . [DOI] [PMC free article] [PubMed] [Google Scholar]
- 34.Mudaliar S, Chang AR, Henry RR. Thiazolidinediones, peripheral edema, and type 2 diabetes: incidence, pathophysiology, and clinical implications. Endocrine practice: official journal of the American College of Endocrinology and the American Association of Clinical Endocrinologists. 2003;9(5):406–16. 10.4158/EP.9.5.406 . [DOI] [PubMed] [Google Scholar]
- 35.Moran-Salvador E, Lopez-Parra M, Garcia-Alonso V, Titos E, Martinez-Clemente M, Gonzalez-Periz A, et al. Role for PPARgamma in obesity-induced hepatic steatosis as determined by hepatocyte- and macrophage-specific conditional knockouts. FASEB J. 2011;25(8):2538–50. 10.1096/fj.10-173716 . [DOI] [PubMed] [Google Scholar]
- 36.Guerre-Millo M, Rouault C, Poulain P, Andre J, Poitout V, Peters JM, et al. PPAR-alpha-null mice are protected from high-fat diet-induced insulin resistance. Diabetes. 2001;50(12):2809–14. . [DOI] [PubMed] [Google Scholar]
- 37.Costet P, Legendre C, More J, Edgar A, Galtier P, Pineau T. Peroxisome proliferator-activated receptor alpha-isoform deficiency leads to progressive dyslipidemia with sexually dimorphic obesity and steatosis. J Biol Chem. 1998;273(45):29577–85. . [DOI] [PubMed] [Google Scholar]
- 38.Lobanenkov VV, Nicolas RH, Adler VV, Paterson H, Klenova EM, Polotskaja AV, et al. A novel sequence-specific DNA binding protein which interacts with three regularly spaced direct repeats of the CCCTC-motif in the 5'-flanking sequence of the chicken c-myc gene. Oncogene. 1990;5(12):1743–53. . [PubMed] [Google Scholar]
- 39.Ong CT, Corces VG. CTCF: an architectural protein bridging genome topology and function. Nature reviews Genetics. 2014;15(4):234–46. 10.1038/nrg3663 . [DOI] [PMC free article] [PubMed] [Google Scholar]
- 40.Guo Y, Xu Q, Canzio D, Shou J, Li J, Gorkin DU, et al. CRISPR Inversion of CTCF Sites Alters Genome Topology and Enhancer/Promoter Function. Cell. 2015;162(4):900–10. 10.1016/j.cell.2015.07.038 . [DOI] [PMC free article] [PubMed] [Google Scholar]
- 41.Li J, Shou J, Guo Y, Tang Y, Wu Y, Jia Z, et al. Efficient inversions and duplications of mammalian regulatory DNA elements and gene clusters by CRISPR/Cas9. Journal of molecular cell biology. 2015;7(4):284–98. 10.1093/jmcb/mjv016 [DOI] [PMC free article] [PubMed] [Google Scholar]
Associated Data
This section collects any data citations, data availability statements, or supplementary materials included in this article.
Supplementary Materials
(TIF)
(TIF)
(TIF)
(TIF)
(DOCX)
(DOCX)
Data Availability Statement
All relevant data are within the paper and its Supporting Information files.


