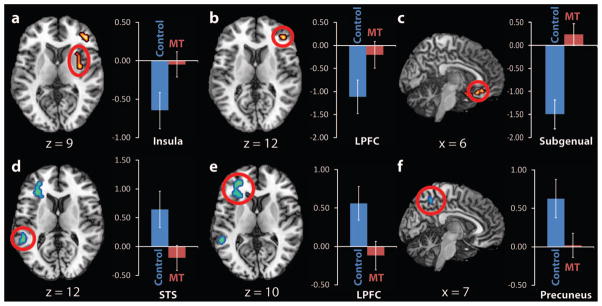
Figure 2.
Differences in regional activation and deactivation between control and mindfulness training (MT) groups in response to sadness provocation (the interaction between-groups and sad vs. neutral within-group contrasts). Top panel: sadness-related deactivations in the control group with nonsignificant activity in the MT group (red clusters = MT > control); bottom panel: sadness-related activations in the control group with nonsignificant activity in the MT group (blue clusters = control > MT). Error bars are 95% confidence intervals. LPFC = lateral prefrontal cortex; STS = superior temporal sulcus/Wernicke’s area.

