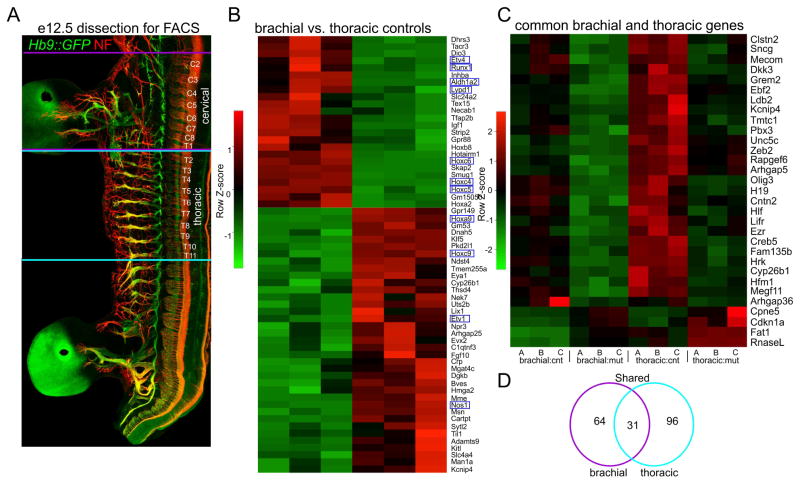
Figure 5. Identification of Pbx Gene Targets in Motor Neurons.
(A) Wholemount staining of Hb9::GFP mouse at e12.5 showing dorsal root ganglia (DRG) and spinal segmental levels used for gene profiling. Neurofilament (Nf) staining highlights the segments isolated for FACS. Brachial MNs were isolated from cervical (C) level C2 to thoracic (T) level T1 and thoracic MNs from T2 to T11. (B) Heatmap showing comparison of gene expression differences between brachial and thoracic MNs in controls. Known differentially expressed genes are outlined in blue (C) Heatmap showing expression differences between control and PbxMNΔ mutants. Heatmap lists genes that are common to both brachial and thoracic samples and that are differentially expressed with a padj.<0.05 cutoff. Heat maps for each of the three pools are shown, and are labeled A, B, C (D) Venn diagram of differentially expressed genes shared between brachial and thoracic levels. See also Figure S5.

