

Abstract
Background: The anti-angiogenic Sorafenib is the only approved systemic therapy for advanced hepatocellular carcinoma (HCC). However, acquired resistance limits its efficacy. An emerging theory to explain intrinsic resistance to other anti-angiogenic drugs is ‘vessel co-option,’ ie, the ability of tumors to hijack the existing vasculature in organs such as the lungs or liver, thus limiting the need for sprouting angiogenesis. Vessel co-option has not been evaluated as a potential mechanism for acquired resistance to anti-angiogenic agents.
Methods: To study sorafenib resistance mechanisms, we used an orthotopic human HCC model (n = 4-11 per group), where tumor cells are tagged with a secreted protein biomarker to monitor disease burden and response to therapy. Histopathology, vessel perfusion assessed by contrast-enhanced ultrasound, and miRNA sequencing and quantitative real-time polymerase chain reaction were used to monitor changes in tumor biology.
Results: While sorafenib initially inhibited angiogenesis and stabilized tumor growth, no angiogenic ‘rebound’ effect was observed during development of resistance unless therapy was stopped. Instead, resistant tumors became more locally infiltrative, which facilitated extensive incorporation of liver parenchyma and the co-option of liver-associated vessels. Up to 75% (±10.9%) of total vessels were provided by vessel co-option in resistant tumors relative to 23.3% (±10.3%) in untreated controls. miRNA sequencing implicated pro-invasive signaling and epithelial-to-mesenchymal-like transition during resistance development while functional imaging further supported a shift from angiogenesis to vessel co-option.
Conclusions: This is the first documentation of vessel co-option as a mechanism of acquired resistance to anti-angiogenic therapy and could have important implications including the potential therapeutic benefits of targeting vessel co-option in conjunction with vascular endothelial growth factor receptor signaling.
The anti-angiogenic tyrosine kinase inhibitor (TKI) sorafenib prolongs overall survival in advanced HCC (1,2). Sorafenib inhibits angiogenesis by targeting vascular endothelial growth factor (VEGF) and platelet-derived growth factor receptors and may also directly target cancer cells by blocking the Ras-Raf-MAPK pathway (3). Although 35% to 43% of HCC tumors are controlled by sorafenib treatment, ultimately these patients acquire resistance and are taken off therapy (1,2).
One theory to explain resistance to angiogenesis inhibition is VEGF-independent sprouting angiogenesis driven by numerous pro-angiogenic growth factors and pro-inflammatory cytokines that are upregulated during resistance to anti-VEGF therapy (4–7). This mechanism has yet to be clinically validated. For example, combined inhibition of VEGF and FGF has not proven successful in phase III HCC clinical trials (8). Moreover, studies that examined tumor perfusion in patients treated with TKIs show that angiogenic re-induction occurs in only a subset of patients at progression (9–11). Analogous perfusion studies in HCC patients progressing on sorafenib have not been reported.
Another potential mechanism of resistance to anti-angiogenic therapy is vessel co-option: the recruitment of pre-existing vessels by the tumor (12). Vessel co-option has been reported in liver metastases (13), non–small cell lung cancer, and lung metastases (14,15), as well as other tumor types (12). Nonangiogenic tumor growth, bearing resemblance to vessel co-option, has also been reported in lymph node metastases (16,17). The role of vessel co-option in mediating acquired resistance to anti-angiogenic therapy is not established.
Rechallenging renal cell carcinoma (RCC) patients with sunitinib or sorafenib, after progression on either drug, can prolong progression-free survival (18,19), and sequencing of different TKIs has shown efficacy in some patients (20). Although this efficacy may stem from the nonoverlapping kinase profiles of these agents, another possible explanation is that resistance to antiangiogenic TKIs is reversible, as reviewed by Kuczynski and colleagues (21) and as reported by several groups (22–24).
The aim of the present study was to study the mechanistic basis of acquired sorafenib resistance in vivo. Herein, we employed an orthotopic HCC model that recapitulates initial clinical response and subsequent resistance to sorafenib and displays a reversible phenotype, in that it cannot be transferred to new hosts (22).
Methods
Orthotopic Mouse Model of HCC
We used a previously described orthotopic model of HCC where Hep3B-hCG cells are injected into the liver of six-week-old male CB17 SCID mice (25). Secreted urinary β-human choriogonadotropin (βhCG) protein levels normalized to urinary creatinine served as a noninvasive biomarker for tumor burden (25). Treatment with 30 mg/kg sorafenib per day was used, and we incorporated therapy breaks to allow recovery from toxicity (22), which are common in sorafenib-treated patients (1,2,26) and thus reflect clinical toxicity management.
Tumor-bearing mice were assigned to a longitudinal ultrasound imaging study (n = 24 initially) or a molecular/histological analysis study (n = 41 initially) then were treated daily with vehicle or 30 mg/kg sorafenib by oral gavage. For molecular/histological analysis, representative mice demonstrating initial response and later acquired resistance were sacrificed at five different phases (n = 6/group) to assess sorafenib-sensitive and acquired resistant HCC. “Control” and “sensitive” tumors were sampled after 13 days of vehicle or sorafenib treatment, respectively. More extended sorafenib treatment resulted in disease progression in all remaining mice. Six mice were sampled at the time of an individual ‘hCG progression’ (“early resistance” group) on days 33 (1 mouse), 54 (3 mice), and 63 (2 mice). “Late resistance” samples were obtained after 76 days of treatment. Finally, samples were obtained from mice that had permanently discontinued sorafenib from days 63 to 76 (“stop” therapy group) in order to investigate potential factors that reverted to baseline by stopping therapy.
In vivo imaging was performed pre-sorafenib or vehicle treatment and at weeks 2, 5, 7, and 10 using a high-frequency ultrasound instrument (Vevo 2100, VisualSonics, Inc.). Weeks 5, 7, and 10 corresponded to the development of acquired sorafenib resistance. Control mice were sacrificed after two weeks of vehicle treatment.
Experimental procedures were performed in accordance with the Animal Care Committee and Comparative Research Department of Sunnybrook Research Institute.
miRNA Sequencing and qRT-PCR
cDNA libraries were prepared from tumors (n = 2/group). Amplified cDNA was sequenced on the Hi-Seq 2500 (Illumina, San Diego, CA). TargetScan 6.2 was used for recognizing miRNA targets, and Ingenuity Pathway Analysis was subsequently used to identify altered signaling pathways between sensitive and control tumors. Total RNA was extracted from tumor lysates (n = 3/group) and analyzed for expression levels of EMT-related genes by quantitative real-time polymerase chain reaction (qRT-PCR). Further details and primer sequences can be found in Supplementary Materials (available online).
Enzyme-Linked Immunosorbent Assay
Tumor protein lysates (n = 6/group) were analyzed using enzyme-linked immunosorbent assay (ELISA) kits: mouse (m)VEGF-A (MMV00), human (h)VEGF-A (DVE00), mOPN (DY441), mSDF-1 (DY460), mG-CSF (DY414), mAng2 (MANG20), mPDGF-BB (MBB00), mPDGF-AB (MHD00), hbFGF (DFB50; all from R&D Systems, Minneapolis, MN), and mAng1 (CSB-E0702m, Cusabio, Hubei, China).
Statistical Analysis
Differences across experimental groups were evaluated by Student’s t test or by one-way ANOVA followed by Bonferroni’s multiple comparison test for differences across groups. Global perfusion changes were tested by repeated measures one-way ANOVA. Differences between the frequencies of peak enhancement (PE) values at different time points were tested using two-sample t tests. qRT-PCR results were analyzed by Kruskal-Wallis followed by Dunn’s multiple comparison test. Data are presented as the mean and standard deviation of biological replicates. Statistical significance level was set at a P value of less than .05. All statistical tests were two-sided.
Additional details of methods are provided in the Supplementary Methods section (available online).
Results
Characterization of Sorafenib-Resistant HCCs
Hep3B-hCG orthotopic HCC xenografts were used to study sorafenib resistance. Vehicle control HCC tumors rapidly progressed as demonstrated by levels of urinary βhCG whereas all sorafenib-treated mice initially displayed stabilized tumor growth. In Figure1A, the tumor growth rate (defined as the relative hCG increase per day) for ‘control’ tumors was observed to be 72.4±57.6 mIU/mg/day relative to responding mice at -0.96±57.6 mIU/mg/day (P < .001). After 38 days of therapy, tumors began to progress (hCG > 200 mIU/mg, hCG rate increase from 0.8±7.5 to 29.1±14.6 mIU/mg/day, P < .001), reflecting resistance to therapy (22). Sustaining treatment led to irregular hCG changes, but permanently stopping therapy following resistance resulted in accelerated tumor growth (147.6±130.2 vs 38.7±34.3 mIU/mg/day, P < .001). Tumor samples were obtained to reflect control, sorafenib-sensitive, early and late acquired resistance, and discontinuation of therapy postprogression (“stop”). Tumor plus liver mass was statistically significantly higher in late resistant vs sensitive tumors (t test P = .001) in agreement with secreted hCG levels (Supplementary Figure1A, available online).
Figure 1.
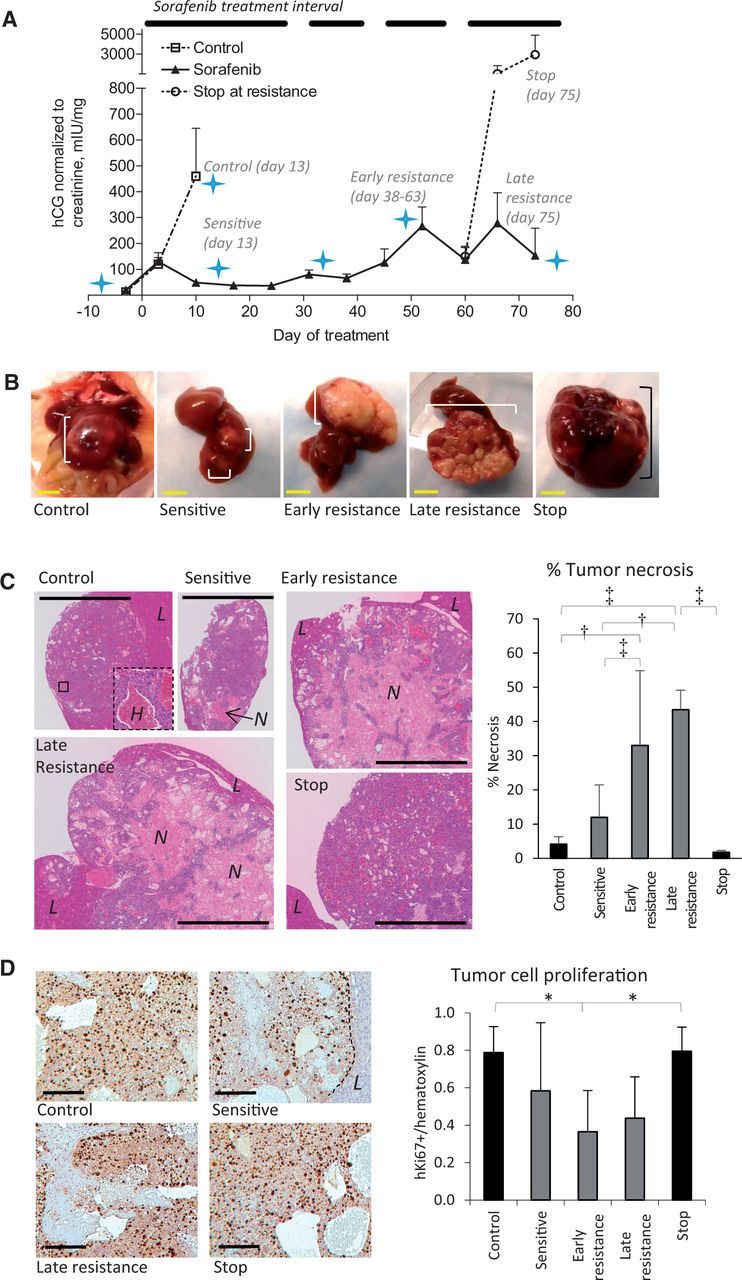
Characteristics of sorafenib-resistant orthotopic hepatocellular carcinoma (HCC) xenografts. A) Levels of βhCG (urinary hCG/creatinine) in orthotopic Hep3B-hCG tumor-bearing mice treated with vehicle or 30 mg/kg oral sorafenib are shown. The treatment interval is indicated. Mice were imaged (star) or sacrificed at the indicated time points to study sensitive and resistance disease. Therapy was stopped for two weeks in a subgroup of mice after the development of resistance to study resistance reversibility (“stop” group). n = 13 vehicle, 41 sorafenib (day -3). B) Hep3B-hCG tumors (square brackets) are shown in situ and excised with liver intact. Note that sorafenib-treated tumors are nonhemorrhagic and irregular. C) Representative low-magnification images of hematoxylin and eosin (H&E)–stained tumors are shown from each of the groups analyzed. An inset in the control tumor shows a highly hemorrhagic area (‘H’), which was characteristic of control and stop tumors. The percent of tumor necrosis statistically significantly increased over time during treatment unless therapy was discontinued (analysis of variance [ANOVA] P < .0001). L = liver; N = necrosis. D) Tumor cells regardless of treatment had a high proliferative index based on human Ki67 immunostaining (images at left), with a trend toward decreased cell proliferation during sorafenib sensitivity (ANOVA P = .01). Scale bars = 5 mm (yellow) and 100 µm (black). n = 6/group. *P < .05, †P < .01, ‡P < .001. Differences across experimental groups were evaluated by one-way ANOVA and Bonferroni’s multiple comparison test. Statistical tests were two-sided. Error bars represent standard deviation.
Control tumors typically grew as smooth, red, hemorrhagic nodules whereas sorafenib-treated tumors became white and irregularly shaped (Figure 1B) and were highly necrotic except for the tumor rim or small viable tumor cell islands within the core. Control and stop tumors were mostly viable and filled with red blood cell pools (Figure 1C). Sorafenib treatment statistically significantly increased the percentage of necrotic tissue (Figure 1C). Resistance was neither associated with induction of cancer cell proliferation nor associated with decreased cancer cell apoptosis (Figure 1D; Supplementary Figure 1B, available online). Sorafenib-sensitive tumors did not have reduced levels of ERK phosphorylation or cancer cell proliferation implicating minimal direct tumor targeting by sorafenib (Figure 1D; Supplementary Figure 1C, available online) though, of note, statistically significantly reduced cancer cell proliferation was observed by early resistance.
Analysis of Markers of Angiogenesis
We examined whether angiogenesis re-induction (4–7) might explain acquired resistance to sorafenib. Tumors were co-stained for CD34, a tumor endothelial cell marker in HCC (27) and the pericyte marker α-smooth muscle actin (αSMA). CD34+ microvessels were abundant and uniformly distributed throughout control tumors but were statistically significantly depleted in sensitive and in resistant groups (Figure 2, A and B). Resistant tumors lacked CD34+ vessel hotspots, indicating a lack of rebound vascularization. However, persistent CD34+ vessels were frequently associated with large auto-fluorescent cells reminiscent of hepatocytes (Figure 2A; Supplementary Figure 2A, available online). Stopping therapy caused CD34+ vessels to return to control levels (Figure 2B). The proportion of CD31 and Ki67-positive proliferating vessels mirrored this pattern (Figure 2C). The proportion of αSMA+ pericyte-coated vessels did not change statistically significantly between control or sensitive and early resistance groups, arguing against enhanced vessel maturation as a mechanism of resistance (Figure 2D). αSMA+ myofibroblasts were a characteristic feature of stop tumors, which surrounded NG2+ pericyte-covered CD34+ vessels in multiple layers (Supplementary Figure 2, B and C, available online) and formed extensive networks across stop tumors. αSMA+ cells were also noted during late resistance in necrotic areas of tumor (Supplementary Figure 2, C and D, available online). Collagen I expression corresponded to areas of high fibroblast density. Collagen (I or III) deposition along the tumor-liver interface was rare (Supplementary Figure 2E, available online). Sorafenib treatment led to increased expression of the hypoxia marker carbonic anhydrase (CA) IX (Figure 2, E and F). CAIX expression appeared most extensive in sensitive tumors, suggesting partial improvement of tumor oxygenation in resistant tumors, but results were not statistically significant (P > .05).
Figure 2.
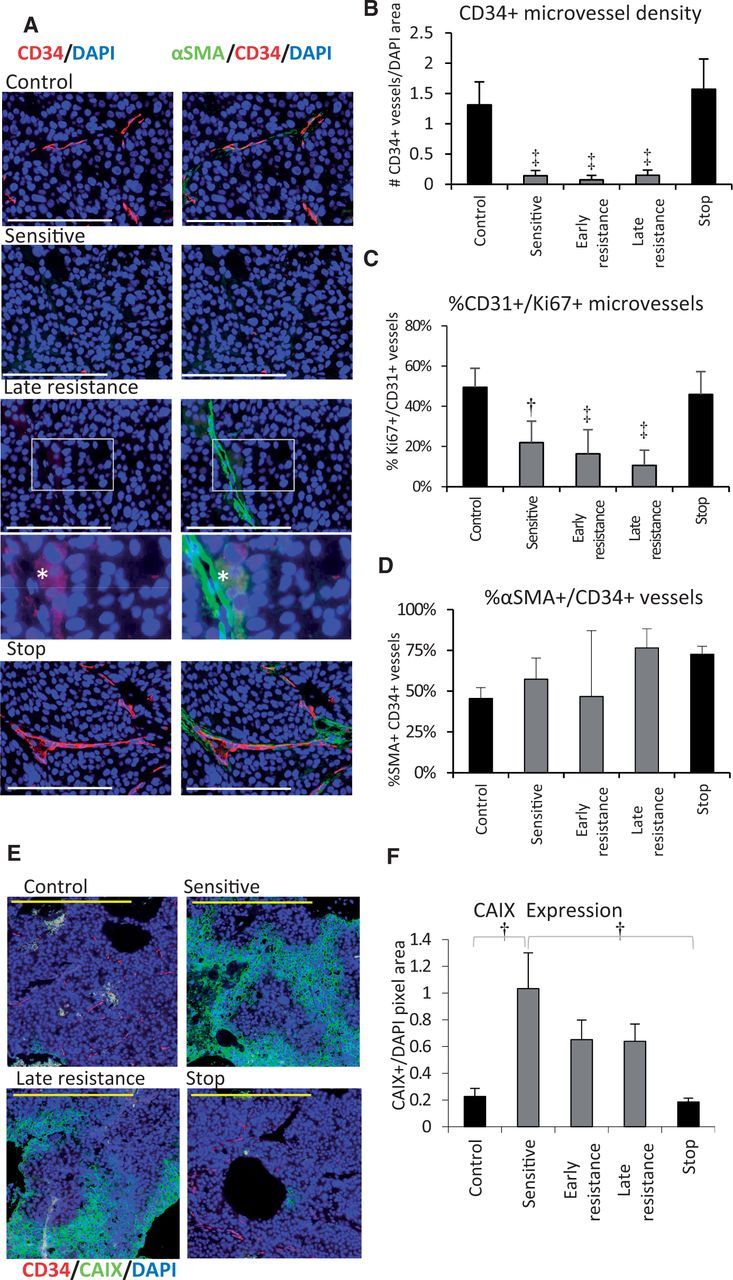
Tumor angiogenesis during sorafenib treatment. A) Immunofluorescent images of Hep3B-hCG angiogenic microvessel density by tumor staining for CD34+ microvessels (red), αSMA pericytes (green), and nuclei (DAPI; blue). CD34/DAPI merge are shown in the left column and CD34/αSMA/DAPI merge at right. During resistance, CD34-negative/αSMA+ vessel-like structures adjacent to autofluorescent cells became evident (*), shown magnified with enhanced contrast. B) CD34+ microvessel density normalized to DAPI statistically significantly decreased during treatment and rebounded after stopping therapy (analysis of variance [ANOVA] P < .001, ‡P < .001 vs control or stop groups). C) The proportion of tumor microvessels (CD31, green) containing proliferative endothelial cells (Ki67+) was also suppressed throughout treatment (ANOVA P < .001, †P < .01, and ‡P < .001 vs control or stop groups). Scale bars = 200 µm (white) and 100 µm (yellow). D) The proportion of %αSMA+ pericyte-covered CD34+ vessels was not statistically significantly associated with sorafenib sensitivity or with the early development of resistance (P > .05, ANOVA P = .002). E) Immunofluorescence staining for CAIX (green) as a hypoxia marker in hepatocellular carcinoma tumors. F) Quantification of CAIX expression by immunohistochemistry. Statistically significantly upregulated CAIX levels occurred during treatment (ANOVA P = .002). n = 6/group. *P < .05, †P < .01. Data were analyzed by one-way ANOVA and Bonferroni’s multiple comparison test. Error bars represent standard deviation.
Global Ultrasound Perfusion Imaging During Sorafenib Treatment
We used ultrasound imaging to examine changes in tumor perfusion. The microbubble contrast agent used remains strictly intravascular, allowing accurate assessment of tumor perfusion (28). Pretreatment and control Hep3B-hCG tumors were highly perfused (Figure 3A), but contrast uptake was dramatically reduced by sorafenib treatment (Figure 3B).
Figure 3.

Global analysis of hepatocellular carcinoma (HCC) tumor perfusion during sorafenib treatment using contrast-enhanced ultrasound imaging. Representative parametric maps of peak enhancement (PE), an indicator of tissue blood volume, show changes in tumor perfusion in a (A) vehicle-treated and (B) sorafenib-treated mouse. Red represents regions of high PE, blue are areas of low PE, and black represents no perfusion. C) Average PE values decreased statistically significantly two weeks after sorafenib therapy (P < .001, †P < .001 vs pretreatment), but further changes were not statistically significant for the following weeks. No statistically significant changes occurred in vehicle-treated mice (P = .07) whereas a statistically significant change was observed between vehicle- and sorafenib-treated mice by week 2 (*P < .05). Vehicle control mice were sacrificed after week 2. D) Wash-in rate, used as an indicator of rate of blood flow, showed no statistically significant changes over time, including during periods of drug resistance. Statistically significant changes were only observed between pre- and post-treatment for both sorafenib (P < .001, †P < .001)- and vehicle (paired t test *P < .05)-treated groups. n = 4 (vehicle), n = 11 (sorafenib). Global perfusion changes were tested by repeated measures one-way analysis of variance. Error bars represent standard deviation.
To quantify global perfusion changes, peak enhancement (PE) and wash-in rate (WIR), which are indicators of tumor blood volume and flow rate, respectively, were measured from the time intensity curve. Each declined statistically significantly after initial treatment but remained relatively unchanged afterwards (Figure 3, C and D), indicating no evidence of rebound reperfusion associated with sorafenib resistance.
Histopathological Signs of Local Invasion
Based on histopathological criteria defined for liver metastases and HCCs (13,29), we observed that control and sensitive tumors had a predominantly ‘pushing’ growth pattern characterized by compression of the hepatocyte plates parallel to the tumor-liver interface (Figure 4A). By early resistance, the tumor growth pattern became highly infiltrative. Tumor ‘buds’ (cell clusters of ≤ 5 cells in diameter [30]) and larger tumor nests were evident along the invasive front, resulting in the incorporation of liver parenchyma into the tumor (Figure 4B). We also observed increased lymphovascular invasion and hepatic satellite nodule development during resistance (Figure 4, B and C), additional signs that resistant tumors became more invasive.
Figure 4.
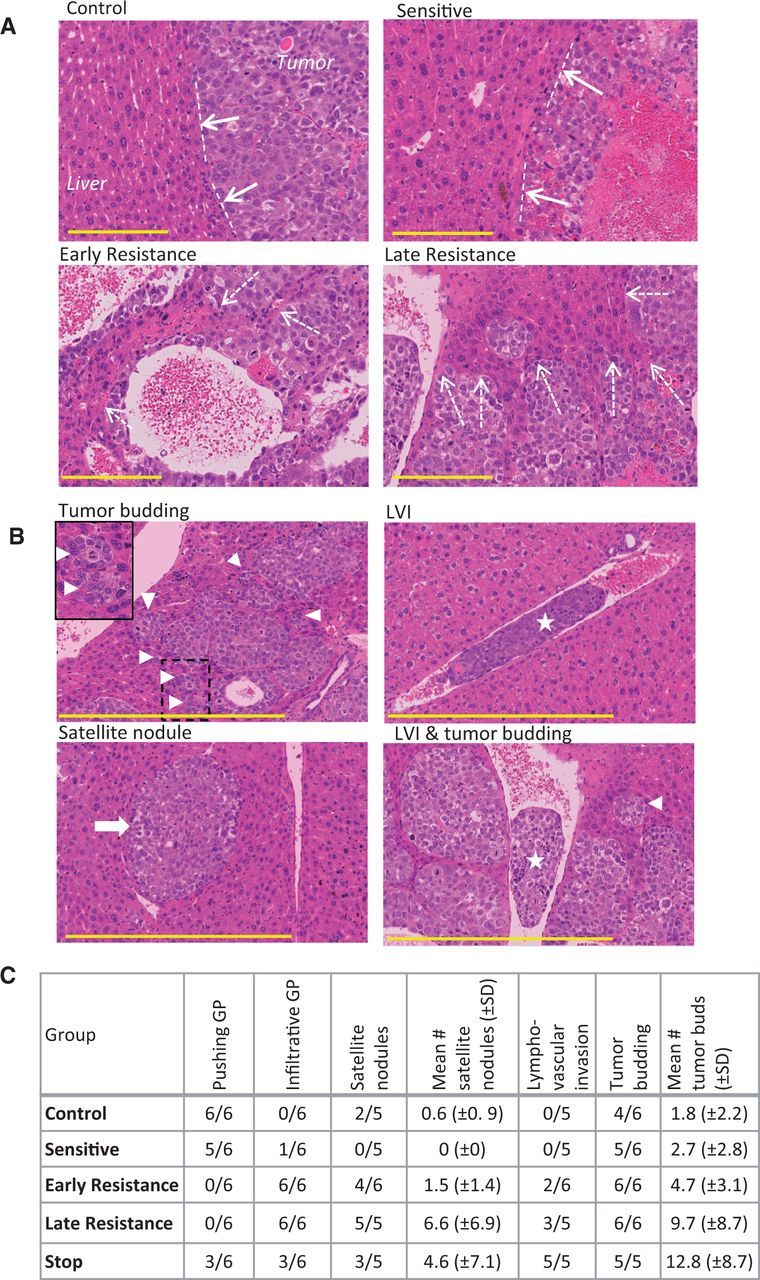
Histopathological signs of invasion in hepatocellular carcinoma (HCC) xenografts. A) Tumor growth patterns were predominantly pushing in control and sensitive tumors (dashed lines and solid arrows) and were mostly infiltrative growth (resistance phases), leading to tumor incorporation of liver parenchyma (dashed arrows). Tumors were stained with hematoxylin and eosin. B) Tumor budding (triangle; box demonstrates magnified area), lymphovascular invasion (LVI; star), and satellite nodules (arrow), additional signs of tumor aggressiveness, were common in resistant tumors. C) The prevalence of some of the invasive tumor features tended to increase from control and sensitive to resistant tumors, with a mixed phenotype in stop group tumors. (n = 6 per group). Scale bar = 200 µm. GP = growth pattern.
Analysis of Vessel Co-option in Sorafenib-Treated HCCs
We hypothesized that invasive tumor growth and incorporation of liver parenchyma in the absence of angiogenesis re-induction meant that sorafenib-treated HCC tumor cells were co-opting the normal liver vasculature (12). Tumors were co-stained for CD31 (to detect all blood vessel types) and human lamin A/C (to detect human cancer cells) and counterstained with hematoxylin and eosin to reveal normal anatomical liver structures (Figure 5A). This allowed us to identify five distinct types of vessels in Hep3B-hCG tumors: 1) tumor-embedded vessels (TVs), defined as CD31+ vessels bordered only by lamin A/C+ tumor cells (Figure 5B); 2) connective tissue vessels (CTVs), which were CD31+ vessels bordered by fibroblasts (Figure 5B); 3) hepatocyte vessels (HVs), which were CD31+ vessels bordered by hepatocytes (Figure 5C); 4) hepatic central veins (CVs) (Figure 5D); and 5) normal vessels of the portal triads (PTs) (Figure 5E; and Supplementary Figure 3A). Because vessel types 3 through 5 are vascular structures of the normal liver, their presence within the tumor mass is evidence for vessel co-option.
Figure 5.
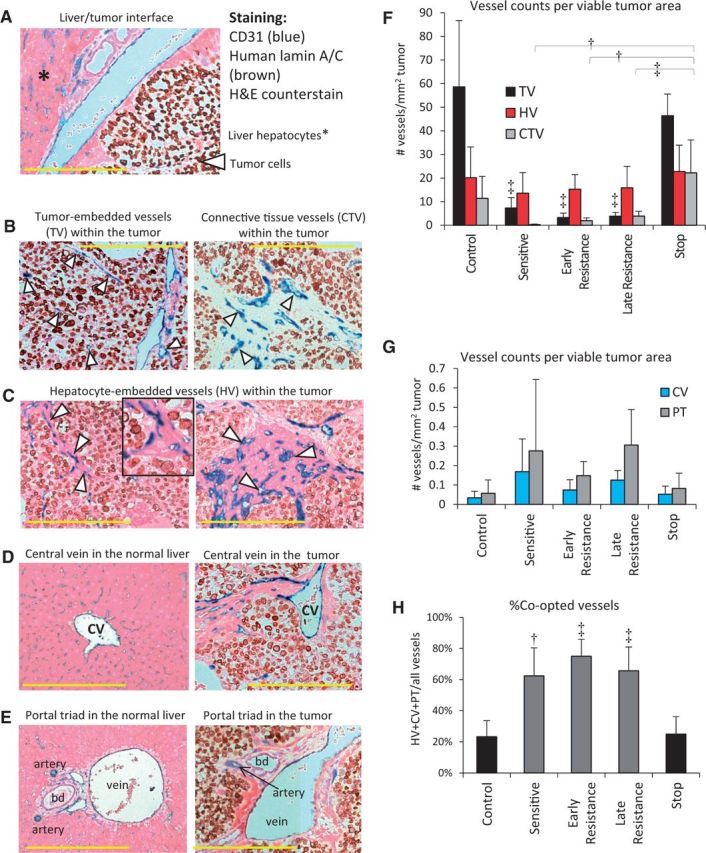
Evidence of liver vessel co-option in hepatocellular carcinoma (HCC) xenografts. A) Tumor sections were stained for human lamin-A/C (brown), hematoxylin and eosin, and CD31 (blue) to differentiate between co-opted liver parenchyma- and tumor-derived vessels. B. Non-co-opted vessels, the tumor-embedded vessels (TVs), and connective tissue vessels (CTVs) are surrounded by tumor cells or fibroblasts, respectively. C) Hepatocyte-embedded vessels (HVs) were the most common microvessel structures found in sorafenib-treated Hep3B-hCG tumors, varying from single-layered hepatocytes (left) to large patches of hepatocytes associated with CD31+ vessels (right). Inset shows magnified HVs. D) Central veins (CVs), shown in the liver (left), were also observed in the tumor. E) The vessels of portal triads (PTs) were also observed in the liver (left) as well as in the tumor. F) TVs were characteristic of control tumors, and they diminished during sorafenib treatment (analysis of variance [ANOVA] P < .001, ‡P < .001 vs control and stop groups), after which HVs predominated (ANOVA P = .53). After initial depletion by sorafenib treatment, CTVs tended to re-emerge over time, particularly after stopping therapy (ANOVA P < .001). Examples shown are from control (B, left), stop (B, right), and early or late resistant tumors (C-E). G) Tumor-incorporated PTs and CVs tended to increase in prevalence during treatment (ANOVA P = .14 and P = .08, respectively). H) The % co-opted (HV+CV+PT) out of total vessels statistically significantly increased during sorafenib treatment (ANOVA P < .001). bd = bile duct. Scale bar = 300 µm; n = 5-6/group. Triangle = vessel type indicated. †P < .01, ‡P < .001. Data were analyzed by one-way ANOVA and Bonferroni’s multiple comparison test. Error bars represent standard deviation.
We examined the abundance of these different vessel types in control and sorafenib treated tumors. TVs and CTVs prevailed in control tumors but were drastically reduced during sensitive, early, and late resistance phases, respectively. These vessels then statistically significantly rebounded in stop tumors (Figure 5F). Similar data was obtained by normalization to total, rather than viable tumor area (Supplementary Figure 3B, available online). In contrast, the quantity of HVs remained relatively stable across groups; however, during early resistance they statistically significantly outnumbered TVs (Figure 5F). Portal triads and central veins were found across all tumor groups, but their levels were more variable than HVs, with a trend toward differences across groups (ANOVA P = .14 and P = .08, respectively) (Figure 5G). Relative to control tumors, the incidence of PTs increased statistically significantly by late resistance (P < .05). While HVs appeared to die and disappear in the necrotic cores of resistant tumors large liver vessels did not, thus appearing more stable (Supplementary Figure 3A, available online). Importantly, HCC tumors switched to a blood supply provided by vessel co-option, with 23.3±10.3% of total vessels provided by vessel co-option in control tumors to as high as 75.0±10.9% provided by vessel co-option during early resistance (Figure 5H). Stopping therapy caused a return of co-opted vessels to baseline levels (Figure 5H).
MicroRNA Screen and Expression of EMT Pathway Genes
We performed unbiased human microRNA sequencing on control, sensitive, and late resistant tumors, followed by bioinformatic analysis to identify pathways that were statistically significantly upregulated during sorafenib resistance. Interestingly, four of the top eight identified upregulated pathways were involved in cellular motility and invasion: axonal guidance, EMT, STAT3, and Wnt/β-catenin signaling (Supplementary Table 1 and Supplementary Figure 4A, available online).
Because of their potential contribution to increased HCC invasion, we validated the expression of several EMT-related genes by qRT-PCR. In late resistant vs control or sensitive tumors, we observed statistically significant upregulation of transcripts for vimentin, ZEB1, and ZEB2 (both pro-EMT transcription factors) (Figure 6A). Loss of E-cadherin was observed between control and sensitive groups (P < .05), but this did not persist into resistance (Figure 6A). Statistically significant changes in expression of Snail1, Snail2, and N-cadherin occurred but were not clearly associated with resistance or sorafenib sensitivity and in some cases were downregulated (Figure 6A; Supplementary Figure 4B, available online). We noted a corresponding increase in vimentin protein expression by cancer cells in late resistant compared with control tumors (Figure 6B; Supplementary Figure 4C, available online). Vimentin induction appeared to begin by early resistance (P > .05 vs control or sensitive) when increased signs of invasiveness became evident (Figure 4). Stop tumors were a hybrid of low- and high-expressing areas, indicating a partial reversal in vimentin expression upon therapy discontinuation (Figure 6B). In agreement with the morphological changes associated with EMT, Hep3B-hCG cells adopted a mesenchymal morphology during sorafenib treatment in vitro (Supplementary Figure 4D, available online). However, tumor cells did not acquire a mesenchymal morphology in vivo and maintained an epithelial morphology instead (Figure 4). Thus, sorafenib treatment appears to result in EMT-like changes during drug resistance that coincided with invasive tumor growth and vessel co-option.
Figure 6.
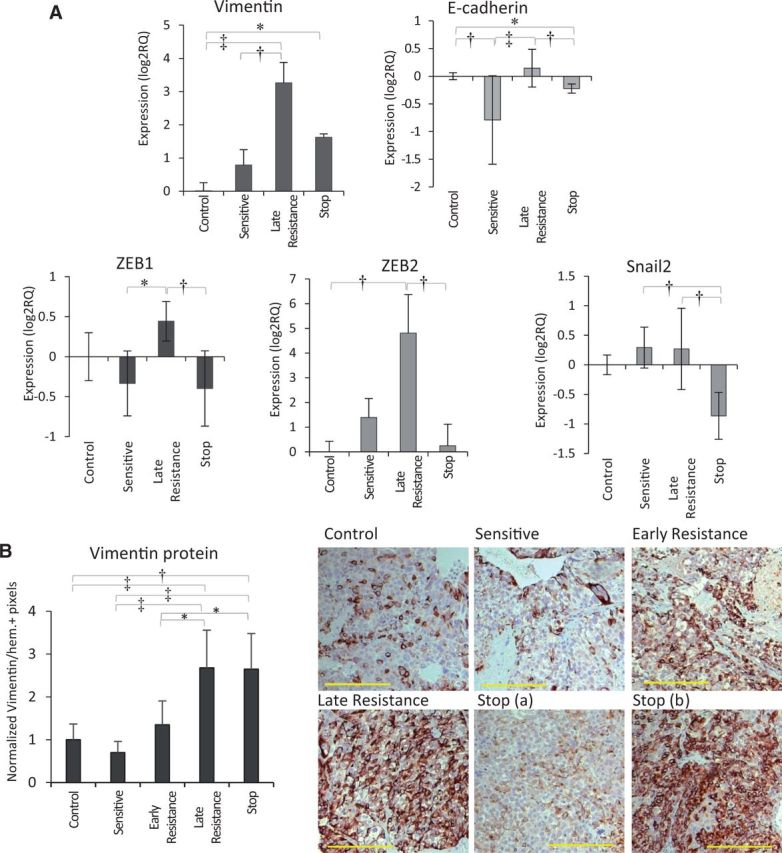
Pro-invasive and EMT-like signaling in tumor cells during sorafenib resistance. A) Analysis of EMT-associated genes indicated statistically significant upregulation of vimentin (H = 26.85, P < .001) and ZEB2 (H = 15.69, P = .001) mRNA during sorafenib resistance. Statistically significant changes in E-cadherin (H = 23.49, P < .001) and Snail2 (H = 16.12, P = .001) were also observed including reduction of E-cadherin between control and sensitive groups (P < .01). n = 3/group. Data were analyzed by Kruskal-Wallis followed by Dunn’s multiple comparison test. B) Vimentin protein expression by immunohistochemical analysis was statistically significantly upregulated from sensitive to late resistance phases (P < .01), with a mixed phenotype in stop tumors (analysis of variance [ANOVA] P < .001; scale bar = 200 µm). n = 6 per group. Vimentin protein expression was analyzed by one-way ANOVA and Bonferroni’s multiple comparison test. *P < .05, †P < .01, ‡P < .001. All statistical tests were two-sided. Error bars represent standard deviation.
Tumor Biomarkers of Sorafenib Resistance
We also evaluated secreted factors in Hep3B-hCG tumor lysates. Increased levels of three were statistically significantly associated with sensitivity (human VEGF-A) or treatment resistance (mouse VEGF-A and osteopontin (OPN)) with, despite near-complete inhibition of angiogenesis during these time points (Table 1 and Figure 2B). Mouse Ang2 levels tended to increase from sensitive to resistance timepoints (p > 0.05) but were statistically significantly upregulated after stopping therapy. Mouse VEGF-A, mouse OPN, and human VEGF-A each returned to baseline after stopping treatment and correlated negatively with TV density but positively with the percentage of vessel co-option (Supplementary Figure 5, A and B, available online).
Table 1.
Concentration of angiogenesis-associated growth factors and cytokines in HCC tumor lysates
| Factor | Group* |
Units† | P† | ||||
|---|---|---|---|---|---|---|---|
| Control | Sensitive | Early resistance | Late resistance | Stop | |||
| human bFGF | 85.7 ± 24.9 | 101.3 ± 47.8 | 132.8 ± 35.5 | 127.9 ± 15.0 | 114.7 ± 49.5 | pg/mg | .23 |
| human VEGF-A | 95.9 ± 20.5 | 973.7 ± 323.0§ | 938.8 ± 273.7§ | 1396.9 ± 618.1§ | 106.2 ± 54.7‖ | ng/mg | <.001 |
| mouse VEGF-A | 32.3 ± 20.5 | 139.8 ± 74.3 | 390.5 ± 147.6§ | 696.1 ± 307.2§,‖ | 137.7 ± 77.4 | ng/mg | <.001 |
| mouse Ang1 | 75.0 ± 39.2 | 146.1 ± 62.3 | 99.1 ± 85.3 | 87.3 ± 40.0 | 96.8 ± 81.9 | pg/mg | .28 |
| mouse Ang2 | 207.1 ± 73.2 | 50.1 ± 25.6 | 131.5 ± 85.7 | 231.7 ± 172.2 | 538.7 ± 328.8§,‖ | pg/mg | <.001 |
| mouse G-CSF | 129.2 ± 45.0 | 275.8 ± 203.5 | 836.2 ± 997.3 | 128.6 ± 54.9 | 524.7 ± 840.3 | pg/mg | .21 |
| mouse OPN | 1.6 ± 0.9 | 2.4 ± 0.6 | 7.0 ± 2.0 | 15.5 ± 7.8§,‖ | 4.1 ± 2.2 | ng/mg | <.001 |
| mouse SDF-1 | 82.5 ± 25.3 | 112.9 ± 28.3 | 90.1 ± 31.9 | 119 ± 29.7 | 104.5 ± 39.3 | pg/mg | .25 |
| mouse PDGF-AB | 6.9 ± 1.6 | 6.3 ± 2.0 | 6.8 ± 3.6 | 6.0 ± 1.3 | 6.3 ± 2.2 | pg/mg | .96 |
| mouse PDGF-BB | 14.5 ± 5.4 | 27.5 ± 13.7 | 38.4 ± 28.2 | 22.9 ± 7.7 | 14.2 ± 6.0 | pg/mg | .05 |
*n = 6 per group. Ang = angiopoietin; bFGF = basic fibroblast growth factor; G-CSF = granulocyte-colony stimulating factor; HDD = hepatocellular carcinoma; OPN = osteopontin; PDGF = platelet-derived growth factor; SDF-1 = stromal-derived factor-1; VEGF = vascular endothelial growth factor.
†Concentrations are normalized to lysate total protein concentration.
‡Data were analyzed by one-way analysis of variance and Bonferroni’s multiple comparison test.
§Values statistically significantly different (P < .05) from control tumors.
‖Values statistically significantly different (P < .05) from sensitive tumors.
High-Resolution Contrast Ultrasound Imaging of Sorafenib-Treated HCCs
We evaluated whether higher-resolution, contrast-enhanced imaging might differentiate between tumor perfusion by angiogenesis vs vessel co-option. Out-of-plane frames were removed from contrast enhancement cineloops, and perfusion parameters were extracted from 3x3 pixel areas, a methodology that improved image resolution (Figure 7A). Networks of large vessels were thus exposed spanning across sorafenib-treated tumors. Structurally, similar networks were visible within the same mice across time points, suggesting that some of these vessels persisted prior to sorafenib treatment (Figure 7B). A highly perfused (high-contrast) thin tumor rim developed after five weeks of sorafenib treatment.
Figure 7.
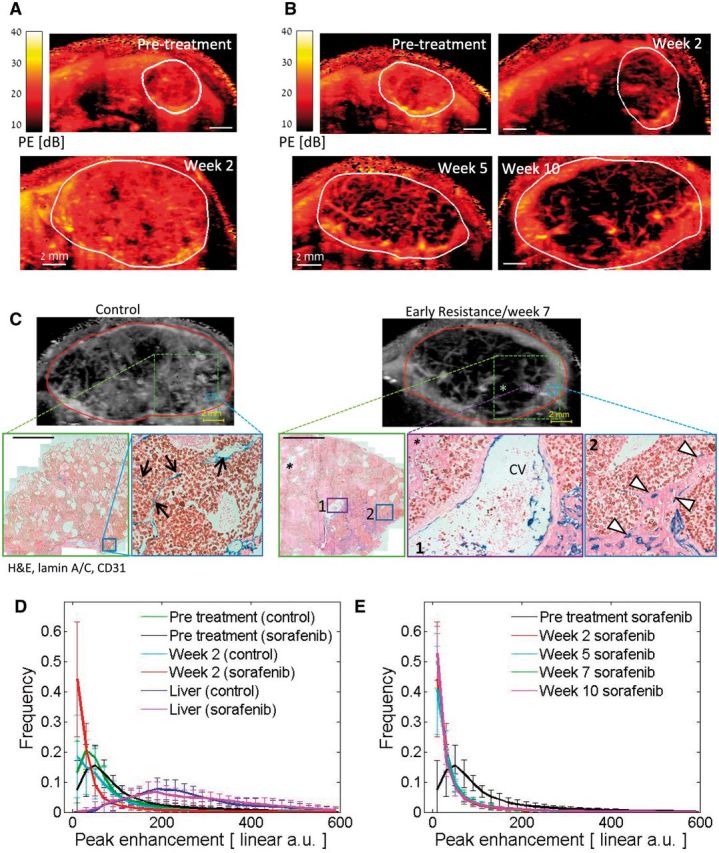
Local perfusion analysis of sorafenib-treated hepatocellular carcinoma (HCC) tumors. A) Representative peak enhancement (PE, representing blood volume) maps of a vehicle control-treated mouse pretreatment and after two weeks. B) PE maps of a sorafenib-treated mouse weeks 2-10. Resistance typically occurs weeks 5-6. C) Examples of contrast-enhanced ultrasound images (top) and corresponding histological sections and features of HCC tumors stained for CD31 (blue), human lamin A/C (brown), and hematoxylin and eosin. The expanded regions (boxes) demonstrate that high tumor-embedded vessel (TV, black arrows) or hepatocyte vessel (HV, white triangles) densities correspond to high-contrast regions in control vs sorafenib-resistant tumors, respectively (scale bar = 2 mm). Large vessels evident in sonograms resemble the large liver vessels within the tumor, such as central veins (CVs), shown here. * = necrotic region. D) Histograms of the local PE values in control and sorafenib-treated tumors are shown pretreatment and after two weeks of therapy. Following treatment, the frequency of the PE measurements in the lowest interval increased while the values in 27 of the other 29 PE intervals reduced statistically significantly (P < .05). Changes in the PE value distribution of the control group were not statistically significant (P > .05). PE distribution in the normal liver is indicated by the dashed lines. E) Similar distributions of PE values were observed between weeks 2, 5, 7 and 10 on sorafenib therapy. The mean values ± standard deviations are presented for every interval of PE values. n = 4 (vehicle), n = 11 (sorafenib). PE frequencies were tested using two-sided two-sample t tests.
Based on histology of a parallel subset of tumors, the uniform high-contrast enhancement regions of control tumors corresponded to areas primarily occupied by tumor-embedded vessels whereas the hyper-intense rim of resistant tumors mapped to the HV vessel–dense invasive tumor front, which rarely contained TVs (Figure 7C). HV vessels appeared perfused with red blood cells visible within their lumen (Supplementary Figure 6, available online). Large vascular structures and nonperfused tumor regions corresponded to large liver vessels and areas with high necrosis, respectively. Thus, the functional vasculature correlated well with histological features, including the abundance of co-opted vs non-co-opted vessel subtypes (Figure 5, F-H). Notably, high tumor rim enhancement did not reflect regions of angiogenic rebound but rather areas of vessel co-option.
A wide range of PE values was observed in both the tumor and the liver, with distinct differences in their overall distributions (Figure 7D). Following initial sorafenib treatment, PE distributions shifted dramatically relative to untreated tumors (Figure 7D): A statistically significant increase in the frequency of the lowest PE intervals (ie, to smaller capillaries, poorly or nonperfused/necrotic tissues), as well as a decrease in 27 of the other 29 PE intervals (P < .01), was observed. Over weeks 2 to 10 of prolonged sorafenib therapy, PE distribution remained unchanged (Figure 7E). Distribution of functional vessels did not take on control-like patterns, further supporting a lack of rebound angiogenesis during treatment, whereas the absence of change in the PE distribution in the lowest intervals mimicked the stability of HV densities. Thus, analysis of measured relative blood volume (PE) shows patterns consistent with vessel co-option but not angiogenesis.
Discussion
Both preclinical and clinical evidence shows that tumors can co-opt pre-existing blood vessels as well as, or instead of, utilizing angiogenesis (12). However, the role of vessel co-option in acquired resistance to anti-angiogenic therapy has not been explored. Based on the evidence presented here, we propose that vessel co-option can facilitate acquired resistance to anti-angiogenic therapy in HCC. Upon sorafenib treatment, tumors are depleted of angiogenic vessels, but some co-opted pre-existing vessels remain. While angiogenesis is continually suppressed, the cancer cells then undergo EMT-like molecular changes that enable them to infiltrate the liver parenchyma and co-opt additional pre-existing liver vessels, ultimately facilitating resistance and resumption of tumor growth. Many of these changes are partially reversed by stopping therapy.
Our results have important implications. First, we show that cancer cells acquire EMT-like properties without a full mesenchymal switch, which facilitates infiltration of the liver tissue and vessel co-option. Preclinical studies have shown that anti-angiogenic therapy can increase local invasion (31,32) and resistant HCC cells can undergo EMT during TKI treatment (33). Because retrospective analyses showed that advanced metastatic disease does not typically become more aggressive in patients treated with angiogenesis inhibitors, the relevance of these findings has been unclear (34). Moreover, the physiological relevance of EMT during tumor progression is controversial (35,36). Most tumor types do not lose epithelial characteristics, and they more frequently invade and metastasize collectively as cell clusters rather than as single cells (36,37). We propose that the increased local invasiveness and changes in expression of epithelial and/or mesenchymal genes observed with anti-angiogenic therapy (which may not be accompanied by increased metastasis) is physiologically relevant because it permits tumors to co-opt pre-existing vessels. The PI3K/AKT signaling pathway is one potential mediator of this effect during sorafenib treatment (33), but at present such molecular mechanisms are unknown.
Second, although we observed elevated expression of pro-angiogenic growth factors upon sorafenib treatment, we did not detect a parallel vascular rebound effect as assessed by global tumor perfusion or histology. Instead, regions of enhanced perfusion during resistance corresponded with incorporated liver parenchyma (ie, vessel co-option). The lack of angiogenic rebound in this model may explain why therapies designed to target VEGF-independent angiogenesis have failed in HCC (8). Although the role of the observed upregulated secreted factors remains unclear, two of the factors, osteopontin (OPN) and VEGF, can stimulate HCC invasion (38,39), which may contribute to the increased vessel co-option upon sorafenib treatment.
Studies examining tumor perfusion changes in patients who have acquired resistance to anti-angiogenic therapy have shown conflicting results. While some studies in RCC or glioblastoma patients suggest an angiogenic rebound (9–11), other studies suggest changes that could reflect vessel co-option because tumors appear more invasive at progression (40) or contain ‘normal’ looking vessels (41). In agreement with the latter, our imaging data demonstrated a shift in vessel function (peak enhancement) during sorafenib treatment that was maintained into resistance time points. This further suggests that a switch from relying on angiogenesis to vessel co-option occurs during acquired resistance to sorafenib in HCC.
The main limitation of this study was that only one preclinical model was analyzed for potential resistance mechanisms. We have also observed vessel co-option in a second sorafenib-resistant orthotopic model using MHCC-97H cells (data not shown); therefore, this phenomenon may be applicable to other xenografts. A second limitation is the lack of corroborating data suggesting that vessel co-option occurs clinically in sorafenib-resistant HCC patients. A ‘replacement’ growth pattern in which sinusoidal vessels are co-opted by infiltrating HCC cells has been observed in HCC patients (29,42).
In summary, increased local infiltration of cancer cells that facilitates vessel co-option may explain the reversible acquired resistance phenotype observed in tumors treated with TKIs. To prevent acquired resistance mediated by vessel co-option, it may be necessary to combine anti-angiogenic therapy with drugs that target tumor invasiveness. Combination with chemotherapy might also be used to mitigate the pro-invasive effects of anti-angiogenic therapy (43). Alternatively, further research may reveal that both angiogenic and co-opted vessels have some unique properties that enable them both to be targeted.
Funding
Canadian Liver Foundation graduate studentship (EAK); Canadian Institutes of Health Research (CIHR) Grant #5814 and International Association for Cancer Research (Worldwide Cancer Research) (RSK); CIHR MOP 12164 and VisualSonics, Inc (FSF). Funding from Breakthrough Breast Cancer, which recently merged with Breast Cancer Campaign to form Breast Cancer Now (ARR, FD).
Notes
The study funders had no role in the design of the study; the collection, analysis, or interpretation of the data; the writing of the manuscript; or the decision to submit the manuscript for publication.
We thank Cassandra Cheng for her excellent secretarial assistance.
RSK is on the scientific advisory board of Angiocrine Biosciences and received honoraria from Regeneron Pharmaceuticals and Neovacs, Paris. FSF discloses research support and consulting with VisualSonics, Inc.
Supplementary Material
References
- 1.Llovet JM, Ricci S, Mazzaferro V, et al. Sorafenib in advanced hepatocellular carcinoma. N Engl J Med. 2008;359(4):378–390. [DOI] [PubMed] [Google Scholar]
- 2.Cheng AL, Kang YK, Chen Z, et al. Efficacy and safety of sorafenib in patients in the Asia-Pacific region with advanced hepatocellular carcinoma: a phase III randomised, double-blind, placebo-controlled trial. Lancet Oncol. 2009;10(1):25–34. [DOI] [PubMed] [Google Scholar]
- 3.Wilhelm SM, Adnane L, Newell P, Villanueva A, Llovet JM, Lynch M. Preclinical overview of sorafenib, a multikinase inhibitor that targets both Raf and VEGF and PDGF receptor tyrosine kinase signaling. Mol Cancer Ther. 2008;7(10):3129–3140. [DOI] [PubMed] [Google Scholar]
- 4.Sennino B, McDonald DM. Controlling escape from angiogenesis inhibitors. Nat Rev Cancer. 2012;12(10):699–709. [DOI] [PMC free article] [PubMed] [Google Scholar]
- 5.Vasudev N, Reynolds A. Anti-angiogenic therapy for cancer: current progress, unresolved questions and future directions. Angiogenesis. 2014;17(3):471–494. [DOI] [PMC free article] [PubMed] [Google Scholar]
- 6.Casanovas O, Hicklin DJ, Bergers G, Hanahan D. Drug resistance by evasion of antiangiogenic targeting of VEGF signaling in late-stage pancreatic islet tumors. Cancer Cell. 2005;8(4):299–309. [DOI] [PubMed] [Google Scholar]
- 7.Mazzieri R, Pucci F, Moi D, et al. Targeting the ANG2/TIE2 axis inhibits tumor growth and metastasis by impairing angiogenesis and disabling rebounds of proangiogenic myeloid cells. Cancer Cell. 2011;19(4):512–526. [DOI] [PubMed] [Google Scholar]
- 8.Llovet JM, Hernandez-Gea V. Hepatocellular carcinoma: reasons for phase III failure and novel perspectives on trial design. Clin Cancer Res. 2014;20(8):2072–2079. [DOI] [PubMed] [Google Scholar]
- 9.Smith AD, Lieber ML, Shah SN. Assessing tumor response and detecting recurrence in metastatic renal cell carcinoma on targeted therapy: importance of size and attenuation on contrast-enhanced CT. Am J Roentgenol. 2010;194(1):157–165. [DOI] [PubMed] [Google Scholar]
- 10.Vasudev NS, Goh V, Juttla JK, et al. Changes in tumour vessel density upon treatment with anti-angiogenic agents: relationship with response and resistance to therapy. Br J Cancer. 2013;109(5):1230–1242. [DOI] [PMC free article] [PubMed] [Google Scholar]
- 11.Nowosielski M, Wiestler B, Goebel G, et al. Progression types after antiangiogenic therapy are related to outcome in recurrent glioblastoma. Neurology. 2014;82(19):1684–1692. [DOI] [PubMed] [Google Scholar]
- 12.Donnem T, Hu J, Ferguson M, et al. Vessel co-option in primary human tumors and metastases: an obstacle to effective anti-angiogenic treatment? Cancer Med. 2013;2(4):427–436. [DOI] [PMC free article] [PubMed] [Google Scholar]
- 13.Vermeulen PB, Colpaert C, Salgado R, et al. Liver metastases from colorectal adenocarcinomas grow in three patterns with different angiogenesis and desmoplasia. J Pathol. 2001;195(3):336–342. [DOI] [PubMed] [Google Scholar]
- 14.Pezzella F, Di Bacco A, Andreola S, Nicholson AG, Pastorino U, Harris AL. Angiogenesis in primary lung cancer and lung secondaries. Eur J Cancer. 1996;32(14):2494–2500. [DOI] [PubMed] [Google Scholar]
- 15.Pezzella F, Pastorino U, Tagliabue E, et al. Non-small-cell lung carcinoma tumor growth without morphological evidence of neo-angiogenesis. Am J Pathol. 1997;151(5):1417–1423. [PMC free article] [PubMed] [Google Scholar]
- 16.Naresh KN, Nerurkar AY, Borges AM. Angiogenesis is redundant for tumour growth in lymph node metastases. Histopathology. 2001;38(5):466–470. [DOI] [PubMed] [Google Scholar]
- 17.Jeong HS, Jones D, Liao S, et al. Investigation of the lack of angiogenesis in the formation of lymph node metastases. J Natl Cancer Inst. 2015;107(9):djv155. [DOI] [PMC free article] [PubMed] [Google Scholar]
- 18.Fumagalli E, Coco P, Morosi C, Bertulli R, Casali PG, et al. Sunitinib rechallenge in two advanced GIST patients after third-line anti-tyrosine kinase therapy. J Clin Oncol. 2010;28(Suppl);e20519. [Google Scholar]
- 19.Nozawa M, Yamamoto Y, Minami T, et al. Sorafenib rechallenge in patients with metastatic renal cell carcinoma. BJU Int. 2012;110(6 Pt B):E228–E234. [DOI] [PubMed] [Google Scholar]
- 20.Albiges L, Choueiri T, Escudier B, et al. A Systematic Review of Sequencing and Combinations of Systemic Therapy in Metastatic Renal Cancer. Eur Urol. 2015;67(1):100–110. [DOI] [PubMed] [Google Scholar]
- 21.Kuczynski EA, Sargent DJ, Grothey A, Kerbel RS. Drug rechallenge and treatment beyond progression–implications for drug resistance. Nat Rev Clin Oncol. 2013;10(10):571–587. [DOI] [PMC free article] [PubMed] [Google Scholar]
- 22.Tang TC, Man S, Xu P, et al. Development of a resistance-like phenotype to sorafenib by human hepatocellular carcinoma cells is reversible and can be delayed by metronomic UFT chemotherapy. Neoplasia. 2010;12(11):928–940. [DOI] [PMC free article] [PubMed] [Google Scholar]
- 23.Hammers HJ, Verheul HM, Salumbides B, et al. Reversible epithelial to mesenchymal transition and acquired resistance to sunitinib in patients with renal cell carcinoma: evidence from a xenograft study. Mol Cancer Ther. 2010;9(6):1525–1535. [DOI] [PMC free article] [PubMed] [Google Scholar]
- 24.Zhang L, Bhasin M, Schor-Bardach R, et al. Resistance of renal cell carcinoma to sorafenib is mediated by potentially reversible gene expression. PLoS One. 2011;6(4):e19144. [DOI] [PMC free article] [PubMed] [Google Scholar]
- 25.Tang TC, Man S, Lee CR, Xu P, Kerbel RS. Impact of metronomic UFT/cyclophosphamide chemotherapy and antiangiogenic drug assessed in a new preclinical model of locally advanced orthotopic hepatocellular carcinoma. Neoplasia. 2010;12(3):264–274. [DOI] [PMC free article] [PubMed] [Google Scholar]
- 26.Riechelmann RP, Chin S, Wang L, et al. Sorafenib for metastatic renal cancer: the Princess Margaret experience. Am J Clin Oncol. 2008;31(2):182–187. [DOI] [PubMed] [Google Scholar]
- 27.Ruck P, Xiao JC, Kaiserling E. Immunoreactivity of sinusoids in hepatoblastoma: an immunohistochemical study using lectin UEA-1 and antibodies against endothelium-associated antigens, including CD34. Histopathology. 1995;26(5):451–455. [DOI] [PubMed] [Google Scholar]
- 28.Foster FS, Burns PN, Simpson DH, Wilson SR, Christopher DA, Goertz DE. Ultrasound for the visualization and quantification of tumor microcirculation. Cancer Metastasis Rev. 2000;19(1-2):131–138. [DOI] [PubMed] [Google Scholar]
- 29.Nakashima T, Kojiro M, Kawano Y, et al. Histologic growth pattern of hepatocellular carcinoma: relationship to orcein (hepatitis B surface antigen)-positive cells in cancer tissue. Hum Pathol. 1982;13(6):563–568. [DOI] [PubMed] [Google Scholar]
- 30.Mitrovic B, Schaeffer DF, Riddell RH, Kirsch R. Tumor budding in colorectal carcinoma: time to take notice. Mod Pathol. 2012;25(10):1315–1325. [DOI] [PubMed] [Google Scholar]
- 31.Pàez-Ribes M, Allen E, Hudock J, et al. Antiangiogenic therapy elicits malignant progression of tumors to increased local invasion and distant metastasis. Cancer Cell. 2009;15(3):220–231. [DOI] [PMC free article] [PubMed] [Google Scholar]
- 32.Ebos JML, Lee CR, Cruz-Munoz W, Bjarnason GA, Christensen JG, Kerbel RS. Accelerated metastasis after short-term treatment with a potent inhibitor of tumor angiogenesis. Cancer Cell. 2009;15(3):232–239. [DOI] [PMC free article] [PubMed] [Google Scholar]
- 33.van Malenstein H, Dekervel J, Verslype C, et al. Long-term exposure to sorafenib of liver cancer cells induces resistance with epithelial-to-mesenchymal transition, increased invasion and risk of rebound growth. Cancer Lett. 2013;329(1):74–83. [DOI] [PubMed] [Google Scholar]
- 34.Blagoev K, Wilkerson J, Stein W, Motzer R, Bates S, Fojo A. Sunitinib does not accelerate tumor growth in patients with metastatic renal cell carcinoma. Cell Rep. 2013;3(2):277–281. [DOI] [PMC free article] [PubMed] [Google Scholar]
- 35.Tarin D, Thompson EW, Newgreen DF. The fallacy of epithelial mesenchymal transition in neoplasia. Cancer Res. 2005;65(14):5996–6000. [DOI] [PubMed] [Google Scholar]
- 36.Chui MH. Insights into cancer metastasis from a clinicopathologic perspective: Epithelial-Mesenchymal Transition is not a necessary step. Int J Cancer. 2013;132(7):1487–1495. [DOI] [PubMed] [Google Scholar]
- 37.Friedl P, Locker J, Sahai E, Segall JE. Classifying collective cancer cell invasion. Nat Cell Biol. 2012;14(8):777–783. [DOI] [PubMed] [Google Scholar]
- 38.Bachelder RE, Wendt MA, Mercurio AM. Vascular endothelial growth factor promotes breast carcinoma invasion in an autocrine manner by regulating the chemokine receptor CXCR4. Cancer Res. 2002;62(24):7203–7206. [PubMed] [Google Scholar]
- 39.Chen R, Xia Y, Xue T, Ye S. Osteopontin promotes hepatocellular carcinoma invasion by up-regulating MMP-2 and uPA expression. Mol Biol Rep. 2011;38(6):3671–3677. [DOI] [PubMed] [Google Scholar]
- 40.Wick W, Wick A, Weiler M, Weller M. Patterns of progression in malignant glioma following anti-VEGF therapy: perceptions and evidence. Curr Neurol Neurosci Rep. 2011;11(3):305–312. [DOI] [PubMed] [Google Scholar]
- 41.de Groot JF, Fuller G, Kumar AJ, et al. Tumor invasion after treatment of glioblastoma with bevacizumab: radiographic and pathologic correlation in humans and mice. Neuro Oncol. 2010;12(3):233–242. [DOI] [PMC free article] [PubMed] [Google Scholar]
- 42.Sugihara S, Kojiro M, Nakashima T. Ultrastructural study of hepatocellular carcinoma with replacing growth pattern. Acta Pathol Jpn. 1985;35(3):549–559. [DOI] [PubMed] [Google Scholar]
- 43.Paez-Ribes M, Man S, Xu P, Kerbel RS. Potential pro-invasive or metastatic effects of preclinical antiangiogenic therapy are prevented by concurrent chemotherapy. Clin Cancer Res. 2015;21(24):5488–5498. [DOI] [PubMed] [Google Scholar]
Associated Data
This section collects any data citations, data availability statements, or supplementary materials included in this article.