

Abstract
Gastric cancer (GC) remains a malignant disease with high mortality. Patients are frequently diagnosed in advanced stages where survival prognosis is poor. Thus, there is high medical need to find novel drug targets and treatment strategies. Recently, the comprehensive molecular characterization of GC subtypes revealed mutations in the small GTPase RHOA as a hallmark of diffuse-type GC. RHOA activates RHO-associated protein kinases (ROCK1/2) which regulate cell contractility, migration and growth and thus may play a role in cancer. However, therapeutic benefit of RHO-pathway inhibition in GC has not been shown so far. The ROCK1/2 inhibitor 1-(5-isoquinoline sulfonyl)-homopiperazine (HA-1077, fasudil) is approved for cerebrovascular bleeding in patients. We therefore investigated whether fasudil (i.p., 10 mg/kg per day, 4 times per week, 4 weeks) inhibits tumor growth in a preclinical model of GC. Fasudil evoked cell death in human GC cells and reduced the tumor size in the stomach of CEA424-SV40 TAg transgenic mice. Small animal PET/CT confirmed preclinical efficacy. Mass spectrometry imaging identified a translatable biomarker for mouse GC and suggested rapid but incomplete in situ distribution of the drug to gastric tumor tissue. RHOA expression was increased in the neoplastic murine stomach compared with normal non-malignant gastric tissue, and fasudil reduced (auto) phosphorylation of ROCK2 at THR249 in vivo and in human GC cells in vitro. In sum, our data suggest that RHO-pathway inhibition may constitute a novel strategy for treatment of GC and that enhanced distribution of future ROCK inhibitors into tumor tissue may further improve efficacy.
Abbreviations: GC, gastric cancer; CEA, carcinoembryonic antigen; FASU, fasudil; FTICR, fourier transform ion cyclotron resonance; MALDI-MSI, matrix-assisted laser desorption/ionization mass spectrometry imaging; MAPK, mitogen-activated protein kinase; MLC, myosin light chain; PET/CT, positron emission/computer tomography; ROCK, Rho-associated kinase; SV40, simian virus 40; TAg, large T-Antigen; WB, Western blot; WT, wild-type
Introduction
Gastric cancer (GC) is the third leading cause of cancer-related death world-wide [1], [2]. Patients frequently present with advanced stage GC where curative treatment is not possible and the 5-year overall survival rate is less than 30%. Thus, novel treatment options need to be developed. Comprehensive genomic approaches have recently classified molecular subtypes of GC into at least four different genetic profiles [3], [4], [5]. In this context, three seminal papers corroborated the small GTPase RHOA as a major oncogenic driver mutation for the diffuse-type GC in humans (Kakiuchi et al., 2014 [5]; Wang et al., 2014 [4]; TCGA, 2014 [3]). The RHOA-signaling pathway is activated by integrins, growth factor, cytokine and G-protein-coupled receptors in response to signals from extracellular matrix and adhesion molecules, hormones and nutrients [6]. Active GTP-bound RHOA binds to a wide series of downstream effectors (>20), for example the RHO-associated protein kinases (ROCK1/2), and leads to an allosteric activation of the serine/threonine kinase domain and to autophosphorylation [7], [8], [9], [10]. The ROCK1 and 2 enzymes are partially redundant, although tissue specific distribution has been reported. They phosphorylate an array of substrate proteins including cytoskeleton components such as myosin light chain (MLC) that promote cell contractility, adhesion and migration in normal and malignant cells. Thereby, ROCKs regulate cellular functions such as growth, invasion and cell viability and are involved in hypertension, Alzheimer's disease and cancer [11], [12], [13]. Hence, ROCK1/2 are attractive drug targets for disease prevention or therapy. Potent and selective ROCK1/2 inhibitors are under current (pre)clinical development, with fasudil [1-(5-isoquinoline sulfonyl)-homopiperazine] (HA-1077) approved for the clinical treatment of cerebral vasospasms during subarachnoid hemorrhage in China and Japan [14]. The compound has been shown to exert anti-tumor efficacy in rodent xenografts including breast, myeloma, lung, melanoma, glioblastoma and head-and-neck cancer [15], [16], [17], [18].
RHO and ROCK isoforms are expressed in human GC cells [19], [20], and RHOA expression and/or mutations have been associated with poor clinical prognosis in patients with diffuse GC [21], [22], [23]. Inhibition of RHOA/ROCK signaling promotes apoptosis and reduces proliferation of human GC cells [24], [25], [26]. We therefore hypothesized that pharmacological inhibition of ROCK1/2 by fasudil may exert therapeutic benefit in vivo, in mice with spontaneous genetically driven gastric carcinoma as a preclinical model of human GC. The transgenic C57BL/6 J mouse strain CEA424-SV40 TAg expresses the viral oncogene “large T-antigen” (TAg) from the Simian Virus 40 (SV40) under the control of the promoter of the human carcinoembryonic antigen (CEA) specifically in the lower part of the stomach (pylorus) and develops highly proliferative intraepithelial gastric carcinomas within 2 months of age and with 100% penetrance [27]. We show here both in situ drug distribution and metabolism together with preclinical efficacy of fasudil on tumor growth in vivo in murine GC and in vitro in human GC cell lines. In sum, our data propose that inhibition of the “oncogenic driver” RHO signaling pathway by marketed ROCK1/2 inhibitors may constitute a future novel therapy of human GC that could be further improved by next generation drugs with enhanced tumor penetration.
Materials and Methods
Animals
Transgenic CEA424-SV40 TAg C57BL/6 J mice with gastric carcinoma were described elsewhere [27], [28]. Animal studies were conducted in agreement with ethical guidelines of the University of Heidelberg and approved by the government authorities (Az 35–9185.82/G-176/12).
Reagents
Acetonitrile (ACN), trifluoroacetic acid (TFA) and general chemicals were from Merck (Darmstadt, Germany) or Sigma-Aldrich (Steinheim, Germany). Fasudil was from Selleckchem (Houston, TX). Antibodies were phosphorylated (P) P-ROCK2 (T249, #ab83514, Abcam, Cambridge, UK), Ki67 (#550609), unphosphorylated/general (G) G-ROCK2 (#610624) (both from BD Biosciences, Heidelberg, Germany), RHOA (STA-403-A-CB, Biocat, Heidelberg, Germany), P-MLC2 (#3671), P-ERK1/2(p44/p42) (#4370), G-ERK1/2(p44/p42) (#9102), P-P38 (#4511), G-P38 (#9218) (all from Cell Signaling), HSP90 (sc-7947, Santa Cruz Biot., CA). MALDI peptide calibration standard II (#222570), 2,5-dihydroxybenzoic acid (DHB, #209813) and indium tin oxide (ITO) slides were from Bruker Daltonik (Bremen, Germany), Isopentane (GPR RECTAPUR) from VWR (Darmstadt, Germany), FSC22 Frozen Section Compound from Leica Biosystems (Wetzlar, Germany) and Tissue-Tek Cryomolds from Sakura Finetek (Heppenheim, Germany). [18F]-FDG was purchased from ZAG Zyklotron AG (Karlsruhe, Germany).
Cell Culture and Assays
Human embryonic kidney cells transformed with SV40 large T-Antigen (HEK293T) and GC cell lines (AGS, MKN45) (all from the American Type Culture Collection, Rockville, MD) were maintained as described previously [29]. Cell viability was measured by 1-(4,5-dimethylthiazol-2-yl) 3,5-diphenyl-formazan (MTT) assay (Roche Diagnostics GmbH, Mannheim, Germany) as recommended by the manufacturer.
Protein Extraction, GTPase Pull-Down, Immunoprecipitation (IP) and Western Blot (WB)
All methodologies were performed as described before [30]. RHOA GTPase pull-down assay was performed as recommended by the manufacturer (STA-403-A-CB, Biocat, Heidelberg, Germany).
Immunohistochemistry (IHC) and Immunofluorescence (IF) Microscopy
Hematoxylin-eosin (H&E) and antibody stainings were performed as described [29], [30]. For IHC, 3,3′-diaminobenzidine was used as a substrate (brown color). IF stainings were analyzed using a fluorescence microscope (Axiovert 200 M, Carl Zeiss MicroImaging GmbH, Germany) and software (Axiovision, release 4.4). Manual counting of signals (n > 50 per field, n = 5 fields per image) was done with Image J (imagej.nih.gov/ij).
Reverse Transcription PCR (RT-PCR) and Quantitative PCR (qPCR)
Primers are listed in Table S1. All methods were conducted as published [30], [31].
MALDI-MS Imaging
Male C57BL/6 J and CEA424-SV40 TAg transgenic mice (C57BL6 background) (3 months of age, average body weight 20 g) received food and water ad libitum until 3 h before drug administration. Fasudil monohydrochloride [1-(5-isoquinolinesulfonyl)-homopiperazine] (HA-1077) was dissolved in sterile PBS and administered i.p. as a single dose of 30 mg/kg. Animals were treated for 10, 30, or 60 min before being sacrificed. For imaging studies [32], [33], [34], stomach and liver tissues were dissected, washed with PBS and immediately frozen in cryomolds above a pre-cooled isopentane bath in liquid N2. Organs were stored at −80°C until analysis. Frozen organs were mounted onto a pre-cooled metal chuck using a minimal amount of tissue freezing medium and cut into 10 μm sections using a cryostat CM1950 (Leica Biosystems, Nussloch, Germany) at a temperature of −15°C. Tissue sections were thaw-mounted onto ITO slides and subsequently desiccated at room temperature (RT) for two hours until matrix application. DHB matrix was prepared at a concentration of 60 mg/ml in ACN/H2O/TFA (50:49.5:0.5, v/v/v). Matrix application to the tissue sections was performed by spray coating using a SunCollect sprayer (SunChrom, Friedrichsdorf, Germany). The matrix was applied in five layers in ascending flow rates (10, 15, 20, 20, 20 μL/min). Data acquisition was performed on an UltrafleXtreme MALDI-TOF/TOF mass spectrometer (Bruker Daltonik, Bremen, Germany) equipped with a 2000 Hz Smartbeam-II laser. Spectra and images were acquired in the positive reflectron ion mode within the mass range of m/z 100–1500 Da using the FlexControl 3.4 software (Bruker Daltonik). Prior to analysis, the acquisition method was calibrated externally on the ITO slide using the DHB matrix peak (m/z 155.0344), Fasudil (m/z 292.1114), Donepezil (m/z 380.2220) and the peptide calibration Standard II (Bruker Daltonik). Fasudil imaging was performed using the FlexImaging 3.0 software (Bruker Daltonik) by accumulating 500 laser shots per measurement spot at a raster width of 100, 50, or 25 μm as indicated. For MALDI-MS/MS imaging of fasudil, a window range of ±3 Da was utilized for parent mass selection and fragment spectra were acquired from each position by accumulating 500 shots using a calibrated LIFT method. The piperazine fragment was selected for the MS/MS imaging process for both fasudil and hydroxyfasudil due to its superior sensitivity. Fourier transform ion cyclotron resonance (FTICR) MS analysis was performed at Bruker Daltonik (in Bremen, Germany) on a 12 T instrument (solariX, Bruker Daltonik) equipped with a dual ESI/MALDI ion source using FT MS Control 2.1 (Bruker Daltonik). MS/MS single spectra on tissue for molecule identification purposes were acquired using sustained off resonance irradiation (SORI, notch window of 0.1 Da) in the ICR cell with an upfront quadrupole isolation window of 10 Da by recording 10 scans using the ions generated by accumulating 200 laser shots each on the tissue. Imaging data were total ion count (TIC) or DHB matrix (m/z window 154.8–155.3) normalized and visualized by FlexImaging 3.0.
PET/CT Imaging
Female CEA424-SV40 TAg transgenic mice (C57BL6/J background) (2 months of age, average body weight 20 g) received repetitive injections of fasudil (i.p., 10 mg/kg*day, 4 times per week) or PBS (control) for 4 weeks, respectively (n = 12 animals per group). Fasudil dissolved in sterile PBS was administered i.p. as a single dose of 10 mg/kg per day. The animals had access to food and water ad libitum until 3 h before radioactive tracer administration. Mice were anesthetized by inhalation of a mixture of O2/isofluorane and injected with a single dose of [18F]-FDG (~5 MBq in 150 μl sterile 0.9% (w/v) NaCl solution) in the tail vein (i.v.). For optimal tracer distribution, mice were kept under anesthesia for 60 min below a red warming lamp. One to 3 mice were measured using the multi-animal transport system (MATS, Bruker Biospin, Ettlingen, Karlsruhe, Germany). A dynamic scan starting 60 p.i. was performed over 30 min, and a subsequent CT image was acquired using a tri-modal Bruker Albira II small-animal PET/SPECT/CT (Bruker Biospin GmbH) [35], [36]. Thereafter, mice were sacrificed and organs snap-frozen or fixed in formalin for paraffin embedding. 3D-reconstruction software and calculation of standard uptake volume (SUV) and tumor volume (in cm3) within the region of interest (ROI) was conducted reconstructing images with 35 iterations and using PMOD v.3.608 for data analysis (PMOD, Zurich, Switzerland) as published [35], [36]. To reduce reader bias, the images were analyzed rater-blinded.
Statistics
Results are means ± S.E. from at least 5 animals per genotype or 3 independent experiments from different cell passages. The software Graphpad Prism (version 4.0) was used to analyze the data. P<.05 was considered significant. All tests were unpaired and two-tailed.
Results
Expression of RHOA and ROCK1/2 in Human and Murine GC Cells and Tissues
To test for expression and activity of RHO-pathway components, the HEK293T cell line [37] was used as an appropriate in vitro model for ROCK1/2 inhibition. This cell line had been transformed by the SV40 large T-antigen (TAg), the same viral oncogene which was overexpressed in the transgenic mouse model used in this study [27], and TAg shown to alter cell migration and invasion by interfering with the regulation of cytoskeleton components by small GTPases (Rac1, Cdc42) [38], [39]. To measure RHOA activity, pull-down assays were conducted using recombinant GST-rhotekin as bait for GTP-bound active RHOA. WBs of the precipitates detected only low amounts of active RHOA in contrast to total RHOA protein in the input controls. This observation was the same for HEK293T and GC cell lines (AGS, MKN45) (Figure 1A). WB analysis of total cell lysates (TCLs) confirmed the steady-state expression of RHOA and ROCK2 proteins in cycling cells (Figure 1B). In AGS cells, which had been treated with fasudil (FASU) for 30 h, the amount of phosphorylated ROCK2 at T249 (P-ROCK2) was reduced by ~26% (n = 3, P= .0006 FASU vs. PBS, t-test) compared to total ROCK2. Phosphorylation of the cognate ROCK1/2 substrate myosin light chain-2 (MLC2) was also decreased confirming the in vitro efficacy of the compound. RT-qPCRs on total RNA, extracted from cycling cells, corroborated expression of RHOA and ROCK1/2 mRNAs (S1). These results indicated that the fasudil targets ROCK1/2 are expressed in human TAg- transformed and GC cell lines, however, the RHOA enzyme was not in an active state as suggested from the RHOA mutations identified in human GC tissue [4], [5], [6].
Figure 1.

Expression of RHOA and ROCK2 in human transformed and GC cell lines.
A, Human GC cell lines (AGS, MKN45) and HEK293 cells transformed with large T-antigen (TAg) express total RHOA but not active RHOA protein. Cells were grown to confluency followed by GST-pulldown from TCLs using recombinant rhotekin-GDS protein as bait for precipitation of active GTP-bound RHOA protein. Precipitated active RHOA was then detected together with total RHOA protein (“input” = TCL before pulldown) by Western blots (WB) using a RHOA p21 Ab. O.D. values from bands in gels were normalized to HSP90 (loading control) and calculated as -fold ± S.E. compared with control (n = 3 per cell line; input P= .039 and pulldown P= .021 MKN45 vs. AGS, Kruskal Wallis test). Quantitative analyses and representative gels are shown.
B, Cells were treated with vehicle (PBS, −) or fasudil (FASU, +) for 30 hours before WB of total cell lysates. O.D. values from bands in gels were normalized to HSP90 (loading control) and calculated as -fold ± S.E. (n = 3 per cell line; P= .0006 FASU vs. PBS, t-test) compared with vehicle control. Quantitative analyses and representative gels are shown.
C, ROCK1/2 inhibition promotes cell death. Cells were treated with vehicle (PBS) or increasing concentrations of fasudil for 48 hours, and cell viability was measured by colorimetric MTT assay after 2 days. O.D. values were calculated as % ± S.E. (n = 3 per cell line, P= .0078 and P= .0001 FASU vs. PBS, Mann-Whitney U test) compared with vehicle control.
To test whether ROCK-inhibition reduces cell viability in vitro, AGS and MKN45 cells were grown to confluency and treated with vehicle (PBS) or increasing concentrations of fasudil for 48 h. Cell viability was measured by colorimetric MTT assay (Figure 1C). Fasudil reduced cell viability to 35 ± 2% (at 0.2 mM in AGS) and 52 ± 6% (at 0.5 mM in MKN45) compared with vehicle-treated cells (n = 3 per cell line, P< .01 FASU vs. PBS, Mann-Whitney U test).
We next asked whether the targets of fasudil are also present in mouse tissues in vivo. WB analysis of total tissue lysates evinced a significantly increased expression of RHOA (2-fold; P= .0084) and P-ROCK2 (11-fold; P= .0306) protein (n = 5 mice per genotype, NT vs. TU; t-test) in gastric tumor tissue (TU) compared with normal gastric tissue (NT) of CEA424-SV40 TAg mice (Figure 2A) RT-qPCRs on total RNA extracted from mouse tissues confirmed expression of Rhoa and Rock1/2 mRNAs (S1). To determine RHOA activity in vivo, pull-down assays were conducted in total tissue lysates from NT and TU stomachs. WBs detected no GTP-bound active RHOA. However, there was again a 4-fold increase in total RHOA protein in TU compared to NT tissue (Figure 2B). These results indicated that gastric tumors of CEA424-SV40 TAg mice express elevated levels of RHOA and phosphorylated ROCK1/2, proposing this pathway as a target for the ROCK-inhibitor fasudil.
Figure 2.

Expression of RHOA and ROCK2 in murine GC tissue.
A, Elevated expression of RHOA and P-ROCK2 proteins in murine GC tissue. Total tissue lysates from WT normal (NT) and transgenic stomachs with gastric tumors (TU) were subjected to WB using general and phosphorylation-specific Abs. Representative gels are shown. O.D. values of bands in gels were normalized to HSP90 and calculated as -fold ± S.E. (n = 5 mice, *P< .05 NT vs. TU, t-test).
B, Murine gastric tumor tissue expressed high amount of total RHOA but not active RHOA protein. Pull-down assays for GTP-bound RHOA from whole tissue lysates were performed as in Figure 1. HSP90 was not precipitated and served as a control for equal loading (input). O.D. values from band in gels were calculated as in A (n = 3 mice, P= .0875 NT vs. TU, t-test).
MALDI-MSI Detects Fasudil Distribution to Normal Stomach and Gastric Tumor Tissue in CEA424-SV40 TAg Mice
In order to visualize the in situ distribution of fasudil and its pharmacologically active metabolite hydroxyfasudil, wild-type (WT) and transgenic CEA424-SV40 TAg mice received an intraperitoneal (i.p.) injection of a single 30 mg/kg dose of fasudil or PBS as vehicle control before being sacrificed. Frozen tissues were collected for MALDI-MSI and histological processing. Because the half-life of fasudil is very short (9.3 min at 10 mg/kg i.p. in mice) [40], the time points 0, 10, 30 and 60 min were selected for analysis (n = 2 CEA424-SV40 TAg and n = 1 WT animal per time point) (Figure 3A). The parent drug was detected in liver tissue already 10 min after administration of the compound (Figure 3B). Metabolism to hydroxyfasudil occurred rapidly (Figure 3C). The half-life of hydroxyfasudil is approximately four times longer than that of fasudil (36.4 min at 10 mg/kg i.p. in mice) [40]. The mass spectra demonstrated that fasudil and hydroxyfasudil rapidly accumulated in the WT and transgenic liver tissues within 10–30 min after drug administration (Figure 3D).
Figure 3.

MALDI-MS drug imaging in liver tissue from WT and CEA424-SV40 TAg mice.
A, In situ detection of fasudil and its active metabolite hydroxyfasudil in mouse liver by MALDI MSI following i.p. dosing. Drug distribution in liver was measured using an UltrafleXtreme MALDI-TOF/TOF instrument. Fasudil signals were first measured in MS mode at a raster size of 100 μm and subsequently confirmed in MS/MS mode measuring with a 50 μm offset in x and y direction on the same tissue. The hydroxyfasudil signal was confirmed by MS/MS measurements on an adjacent measurement region. Displayed are TIC normalized ion images of absolute signal intensities in arbitrary units. Note that fasudil distributes and metabolizes rapidly to hydroxyfasudil in liver tissue.
B, Structural formula of fasudil with characteristic MS/MS fragment. C, Structural formula of hydroxyfasudil with characteristic MS/MS fragment.
D, DHB matrix peak normalized drug and metabolite signal intensities of WT (n = 4) and CEA424-SV40 TAg (n = 8) mice. Normalized signal intensities of fasudil and hydroxyfasudil were added and displayed for the control animals (ctrl) and the 10 min, 30 min and 60 min time points for one WT and two tumor animals each. Statistical analysis was performed using the 1-way ANOVA Dunnett's Multiple Comparison Test (n = 3 mice per group, *P< .05).
More importantly, fasudil was visualized by mass spectrometry in all anatomical stomach regions. Fasudil distribution into stomach and its metabolism to the active metabolite hydroxyfasudil were effective (Figure 4A). HE-staining of corresponding cryosections was performed to assess the histopathology and to delineate the tumor foci and the overall anatomy of the organ. An unbiased comparison of MS signals in the tumor region vs. stroma tissue was performed by fold-change calculations and statistical tests. Several masses were specifically elevated in the tumor area and can be considered putative tumor markers. One of them, m/z 798.5, was used to highlight the tumor area in the MS images (Figure 4A). Distribution of the drug to tumorous and non-tumorous tissue was not homogeneous. Fasudil signal intensities were higher in columnar epithelia of the gastric corpus and in parts in the squamous epithelia of the forestomach. There was no obvious enrichment of fasudil or hydroxyfasudil in the tumor areas compared with the non-malignant regions of the stomach. The distribution of hydroxyfasudil was identical to its precursor. Nevertheless, a significant amount of fasudil (Figure 4B) and hydroxyfasudil (Figure 4C) was able to distribute to the gastrointestinal tumor. These findings suggested that the drug reached the target organ of interest (S2) without being selective for tumor cells (S3). The putative tumor marker with the precise mass 798.541 was identified as potassium adducted phosphatidylcholine PC(34:1) by MALDI FTICR (Fourier transform ion cyclotron resonance) tandem mass spectrometry (S4). In situ distribution of this PC, as assessed by MALDI-FTICR imaging (S5) corroborated the notion that tumor regions can be precisely identified and located. Importantly, PC(34:1)+K+ has been described by Uehara et al. [41] as a marker of gastric carcinoma in patients. Our results suggest that it may be a translational marker from mice to humans.
Figure 4.

MALDI-MS drug imaging in stomach tissue from CEA424-SV40 TAg mice.
A, MALDI-MSI showing an overlay of signals for fasudil, hydroxyfasudil and the lipid tumor marker candidate PC(34:1)+K+ in regions of the mouse normal stomach and GC tissue. Cryosections from fasudil-treated CEA424-SV40 TAg mice were analyzed 30 min after i.p. dosing. Drug distribution was measured in positive ion reflector mode at a spatial resolution of 50 μm (above) and 25 μm (below) with 500 laser shots per position. The colored scale bars indicate the signal intensity as absolute values in arbitrary units. Merge: Displayed are the TIC-normalized ion images of PC (green), fasudil (red) and hydroxyfasudil (blue) of the dosed stomach tissue. The representative MALDI-MSI image is shown together with the corresponding H&E staining.
B, Fasudil distributes to gastric tumor tissue. Cryosections from eight CEA424-SV40 TAg mice were analyzed. Three regions of interest (ROIs) of a size of 1 mm2 (equivalent to 100 spectra) were selected arbitrarily in the tumor region of the control animals (n = 2) and in the tumor region of the fasudil treated animals (n = 6). Spectra were normalized to the DHB matrix peak and signal intensities of the PBS-treated control tumors (−) were compared with fasudil-treated tumors (+). Average signals of fasudil and C, hydroxyfasudil in tumors were elevated compared with control (*P= .0006 TU FASU vs. TU PBS for fasudil and *P= .0004 TU FASU vs. TU PBS for hydroxyfasudil; Mann-Whitney U tests).
PET/CT Imaging Visualizes Preclinical Efficacy of Fasudil in GC of CEA424-SV40 TAg Mice
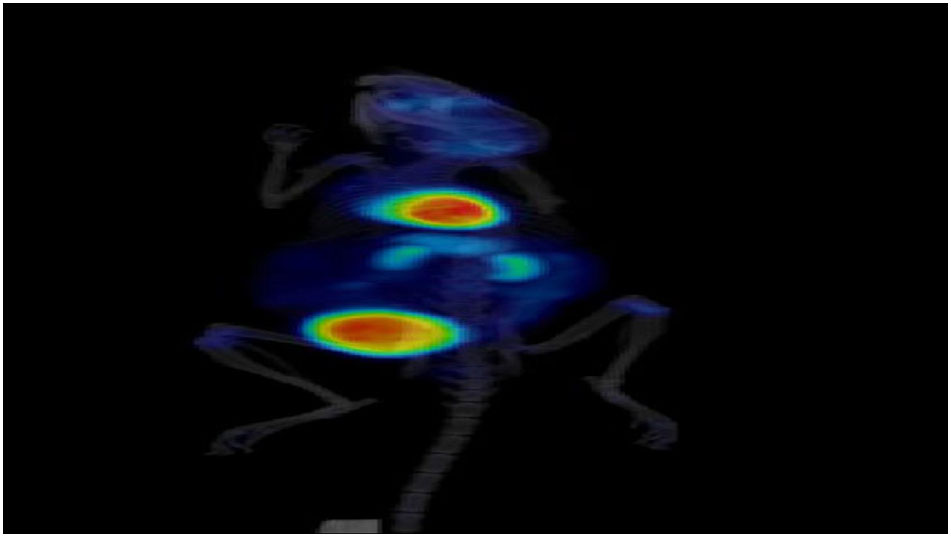
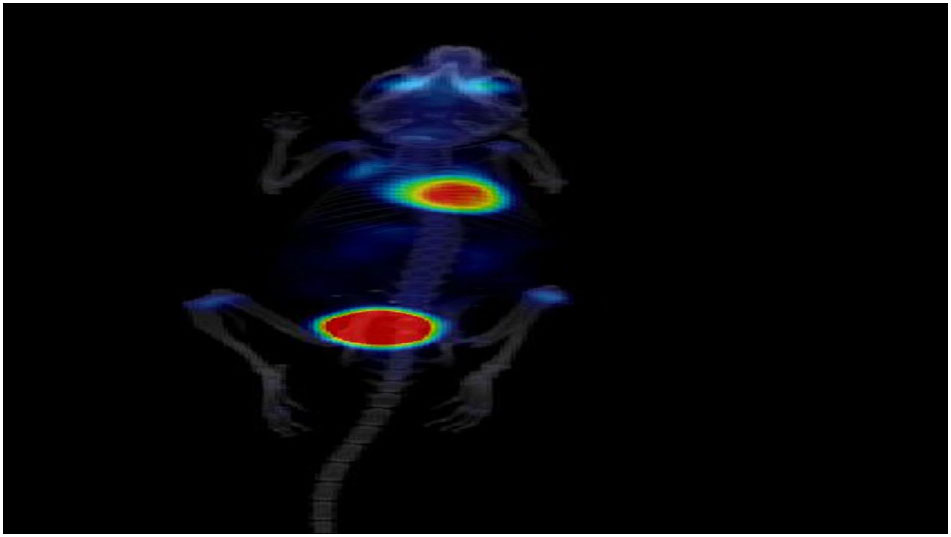
To determine whether ROCK1/2-inhibition inhibits tumor growth in vivo, transgenic (CEA424-SV40 TAg) mice received an intraperitoneal (i.p.) injection of 10 mg/kg dose (4 times per week) of fasudil or PBS for a total time frame of 4 weeks. Mice were deprived of food for 3 hours and then anesthetized and i.v. injected with [18F]-FDG for PET/CT imaging. The overlay of PET/CT images from treated and control mice (Figure 5A) demonstrated that the gastric tumor was localized below the heart and between the kidneys in the paraxial mode of 3D-visualization. High-resolution images of axial and coronal views are presented in the supplement (S6, S7 and movies). WT mice stomachs did not emit any signal in the equivalent anatomical area (not shown). Quantitative calculation of the 3D tumor volumes revealed reduction of [18F]-FDG uptake and signal intensity from 0.071 ± 0.013 to 0.030 ± 0.009 cm3 (n = 12 mice per group, P= .0089 FASU vs. PBS over all SUV ranges, Mann-Whitney U test) by fasudil compared with PBS controls (Figure 5B).
Figure 5.

Preclinical efficacy of fasudil in gastric tumors of CEA424-SV40 TAg mice.
A, 3D PET/CT in situ detection of gastric tumors in mouse stomachs. Signals from [18F]-FDG uptake in fasudil-treated (4 weeks) and PBS-control CEA424-SV40 TAg mice were analyzed by PET and CT imaging and overlay. Representative images of two animals per group are shown. Signal intensity from [18F]-FDG uptake is presented as a graded color code with a SUVbw range of 0.5–10. Legend: tu, tumor; bl, bladder. The white arrow points at the gastric tumor between the two kidneys and below the heart.
B, 3D quantification of the tumor volumes by PET/CT. Signals from [18F]-FDG uptake values were calculated as mean (cm3) ± S.E. (n = 12 mice per group, P= .0089 FASU vs. PBS over all SUV ranges, Mann-Whitney U test). Representative histological images and quantitative analyses are shown. Legend: tu, tumor; sm, smooth muscle; gl, normal gland (pylorus).
C, 2D quantification of the tumor areas. H&E stained paraffin sections of fasudil-treated (4 weeks) and PBS-control CEA424-SV40 TAg mice were measured. Tumor areas (marked with dotted lines) were calculated as mean (mm2) ± S.E. (n = 23 mice per group, P= .0021 FASU vs. PBS, Mann-Whitney U test).
D, 2D quantification of tumor proliferation. Paraffin sections of fasudil-treated (4 weeks) and PBS-control CEA424-SV40 TAg mice were subjected to immunohistochemistry (IHC) using Ki-67 Ab. The number of Ki-67 positive cells was calculated as means ± S.E. (n = 4 mice per group, P= .0407 FASU vs. PBS, ttest).
After acquisition of live imaging, mice were sacrificed, and tissues were collected and snap-frozen or formalin fixed and processed for paraffin embedding. Measurement of the tumor regions on HE-stained tissue sections of the stomachs revealed a decrease of the 2D tumor areas from 1.696 ± 0.096 to 1.254 ± 0.100 mm2 (n = 23 mice per group, P= .0021 FASU vs. PBS , Mann-Whitney U test) by fasudil compared with the PBS controls (Figure 5C). Detection of Ki-67 by immunohistochemistry (IHC) showed that the number of proliferating cells in the gastric tumor was reduced in fasudil-treated mice from 150 ± 25 to 68 ± 19 compared with PBS controls (1 field = 0.3 mm2, n = 5 fields per mouse, n = 4 mice per group, P= .0407 FASU vs. PBS, t-test) (Figure 5D). There were no signs of massive intratumoral necrosis or drug-related apoptosis upon fasudil administration. Taken together, this data demonstrated for the first time that RHO-pathway inhibition reduces growth of GC in vivo.
Fasudil Lowers RHO-Pathway Signaling in Murine GC
To confirm the expression of the fasudil target RHOA in situ, immunofluorescence microscopy was performed on paraffin sections of stomachs (Figure 6A). RHOA was readily detectable in both fasudil-treated and PBS-control gastric tumor tissue but not in non-neoplastic stomach regions (corpus) of the same transgenic animals. The staining intensity of two exemplary down-stream target proteins of the RHO-pathway, p38 and ERK1/2(p44/p42), by phosphorylation-specific Abs was decreased in tumor regions of treated mice (S8). We finally asked whether fasudil also diminishes ROCK2 phosphorylation in vivo. To this end, fresh frozen samples of liver tissue from fasudil-treated and PBS-control tumor-bearing CEA424-SV40 TAg mice were subjected to total protein lysate extraction followed by ex vivo immunoprecipitation (“IP”) of P-ROCK2 and detection by P-ROCK2 Ab (“IB”) (Figure 6B). The quantification of WBs evinced that fasudil treatment decreased P-ROCK2 protein from a mean optical density (O.D.) value of 20.95 ± 18.59 to 0.72 ± 0.37 (n = 8 mice per group, P= .0379 Ab FASU vs. Ab PBS, Mann-Whitney U test) compared with PBS-injected controls. Collectively, these results emphasized that ROCK1/2-inhibitors are able to physically reach the target organ of interest, the normal and malignant stomach tissue, and exert long-term preclinical efficacy to reduce tumor growth and lower the activity of the RHO-signaling pathway in vivo, thus proposing ROCK1/2 as a potential novel target for treatment of human GC.
Figure 6.

Fasudil lowers RHO-pathway signaling in gastric tumors of CEA424-SV40 Tag mice.
A, In situ detection of elevated RHOA protein by immunofluorescence microscopy in murine GC compared with normal gastric tissue (corpus). FFPE sections from stomachs of fasudil-treated and PBS-control CEA424-SV40 TAg mice were subjected to triple-color staining. Legend: Red, RHOA; Green, Actin (phalloidin); blue, nuclei (DAPI); magnification ×400. Representative images are shown.
B, Fasudil inhibits RHOA-pathway activity in murine GC. Whole tissue lysates from fasudil-treated and PBS-control CEA424-SV40 TAg mice were subjected to immunoprecipitation (IP) with P-ROCK2 Ab, followed by WB detection (IB) using the same Ab. HSP90 was not precipitated and served as a control for equal loading (input). O.D. values from band in gels were normalized to HSP90 and calculated as -fold ± S.E. (n = 8 mice per group, P= .0379 Ab FASU vs. Ab PBS, Mann-Whitney U test).
Discussion
In this study, we demonstrate for the first time that pharmacological inhibition of the RHOA-ROCK1/2 signaling pathway inhibits tumor growth in a genetically driven mouse model of GC. Three recent Nature publications [3], [4], [5] evinced that mutations in components of the RHO-signaling pathway (RHOA, ARHGAP) frequently occur in patients with diffuse GC. Genomic data from the TCGA Network [3] (as reviewed in [1], [2]) proposed that similar to colorectal cancer, GC disease can be subdivided into at least four different subtypes, resulting in a novel classification system that is likely to replace the traditional (“Lauren”) distinction of intestinal, diffuse and mixed types of GC which was based mainly on histomorphological criteria [42]. The new classification system may thus be of high relevance for future strategies in diagnosis, prognosis and treatment of patients. It is expected to open novel options for cancer therapy and response prediction in personalized medicine, where cases are stratified according their RHOA mutation characteristics as now routinely implemented for BRAF/NRAS/KRAS mutations in colorectal cancer and melanoma patients. These novel four subtypes [3] comprise diffuse genomically stable GC with RHOA-mutations, anti-viral immune response (EBV), chromosomal instability (CIN) and epigenetic/methylator (MSI) phenotypes, very similar to the subclassification of colorectal cancer, indicating a conserved cascade of genetic alterations in the upper and lower gastrointestinal tract.
Pharmacological inhibitors of the RHO-signaling pathway have been under (pre) clinical development for many years [11], [12], [13]. The downstream effector kinases ROCK1/2 of RHOA are attractive targets for small molecule inhibitors, and fasudil is a first-in-class ROCK inhibitor that has been approved for the treatment of patients with cerebrovascular complication in Asia. Because RHOA mutations have been identified as major oncogenic drivers of the diffuse type of GC [3], [4], [5], we tested the hypothesis that inhibition of the RHO-signaling pathway shall reduce gastric tumor growth in vivo. We resorted to a transgenic mouse model of GC [27], where the viral oncogene SV40 large T-antigen is expressed as a transgene under the human CEA promoter specifically in the lower stomach (pylorus) of the mice, and which has been successfully subjected to pharmacological intervention by us before [32], [43], [44]. This tumor is characterized by early onset (within 4 weeks of age), a high proliferation index and up-regulation of stem cell (Wnt/Notch) [45] and neuroendocrine differentiation signatures [28] culminating in a small cell carcinoma of the lower part of the mouse stomach, the pylorus. At late stages, microinvasion and prolaps of luminal tumor nests toward the upper duodenum can be observed. Due to the anatomical localization, the dedifferentiated histomorphology, the highly proliferative nature and genetic signatures (e.g. for cell adhesion and migration [28]), we employed this mouse strain as a surrogate model for human diffuse GC. Our identification of PC(34:1)+K+ , which has earlier been described as a marker of human GC [41], as an equivalent marker of CEA424-SV40 TAg transgenic mouse carcinoma supports this view and suggests that this phosphatidylcholine may be a suitable lipidomic biomarker in future translational studies. The identity of the lipid tumor marker was established by MALDI TOF MS/MS and FTICR-MS/MS.
In this model, drug-target engagement was suggested by imaging methodologies and ex vivo biochemical analyses. MALDI-MSI [32] confirmed rapid in situ distribution and metabolism [40] of fasudil and its metabolite hydroxyfasudil in liver and normal stomach tissue of wild-type (WT) mice and in gastric tumor tissue of transgenic mice. Unexpectedly, the highest ion intensities for the two compounds were located in the non-malignant upper part of the stomach (corpus), whereas lower signal intensities were found in the tumor regions of the lower stomach (pylorus).
Drug penetration into tumor tissues is a major issue for efficient treatment of cancers, especially of those tumors with strong desmoplastic reactions and fibrosis, such as in pancreatic cancer, where the stroma establishes an impermeable physical barrier to chemo- and targeted therapy [46], [47]. If this principle holds true for primary or metastatic GC is unknown. In previous studies on drug-target engagement [32] in CEA424-SV40 TAg mice, we evinced that the protein of interest is modified within the gastric tumor region of interest, indicating that the drug reaches the cancer cells to bind to the target protein. Accelerated drug metabolism in metabolically active tumor tissue can also explain the different intensities compared with normal tissue [48]. In contrast to histone acetylation as a readout for epigenetic drug action in situ [32], [43], suitable mass targets for detection of ROCK1/2 inhibition are currently lacking for detection by MALDI-MSI and constitute a challenge for future developments.
Nonetheless, we confirmed the presence of the drug target proteins by methods not based on imaging. Expression of RhoA mRNA and RHOA protein was visible in immunofluorescence microscopy and upon ex vivo WBs and PCR. The TCGA-powered genetic studies [3], [4], [5] did not clarify whether the observed RHOA gene mutations in human GC samples result in a gain (GOF) or loss (LOF) of RHOA protein function. Thus, it remains elusive if the GTPase activity or the recruitment of downstream effectors of the mutant RHOA protein is altered in a positive or negative mode. Experimental evidence is lacking, but the stakes are for a gain of protein function similar to the oncogenic driver mutations in the KRAS gene, which lead to RAS proteins locked in a GTP-bound constitutively active state that drives initiation and progression of pancreatic, lung and colorectal cancer. Previous in vitro studies proposed that RHO-signaling is active in human GC cell lines [19], [20] and the malignant phenotypes of those cells can be reversed by ROCK1/2-inhibition [24], [25], [26]. However, the function of RHOA in vivo remained unknown. We collected a priori evidence that a GOF is likely for our GC mouse model. Total protein levels of RHOA and its cognate substrate ROCK1/2 but not RHOA activities were elevated in gastric tumor tissue compared to adjacent normal stomach tissue of the transgenic mice. We were unable to detect elevated RHOA activity in GST-pulldown assays using the substrate rhotekin as bait in whole tissue lysates of mice stomachs. Nonetheless, we could see an increase of active phosphorylated ROCK1/2 protein, another candidate of a diverse set of RHOA downstream substrates [6], [11]. Concluding from these data, a GOF of RHOA protein was stated for our model. If this holds true for human samples and other mouse models of GC has to be studied in the future.
After having collected evidence that both drug and target are present in the tumor, the preclinical efficacy of fasudil was monitored in living animals by PET/CT and post mortem by histopathological examination. Consistent with the known high metabolic and proliferative activity of the gastric tumor [27], [28], [45], [18F]-FDG uptake was clearly visible in an anatomical area corresponding to the localization of the pylorus, below the heart and above the two kidney signals. The 3D tumor volume (SUV (ccm)) was significantly reduced in therapy vs. control mice. The 4-weeks treatment with a daily dose of fasudil (10 mg/kg) not only diminished [18F]-FDG uptake in living mice, but also post mortem histopathological analysis confirmed reduction of the 2D tumor area and the proliferation marker Ki-67 in situ. We could also prove that phosphorylation of ROCK1/2 proteins were lowered in fasudil-treated mice compared with controls. In contrast, total amounts of RHOA proteins in the tumor were unaffected by the drug, because fasudil acts down-stream of RHOA. Collectively, we demonstrated in the present study that RHOA-pathway inhibition attenuated gastric cancer growth in vivo. Remaining important issues are to explore if RHOA mutations are also frequent in murine GC in the present transgenic model and other state-of-the-art murine GC models. Secondly, it has to be assessed whether RHOA mutations in human or rodent tumors result in a GOF or LOF of RHOA protein levels and/or GTPase activity. Our collaborators have recently shown that RHOA mutations in diffuse type of GC do not correlate with a poor prognosis in patients [22], [23]. Others [49], [50] observed that increased staining positivity for small GTPase signaling pathway components (including RHOA and ROCK1) in IHC studies predicts metastasis and a poor survival prognosis of GC patients. The latter reports are in line with our findings, because we observed increased total RHOA protein in tumors but not elevated GTPase activity. Nonetheless, this may also have been caused by experimental limitations, since rhotekin is only one of many (>20) substrates of RHOA [6]. Thus, future experiments have to decide if RHOA mutations render the GTPase more active, or the increase in total protein amounts of RHOA accounts for the activation of the ROCK1/2 signaling pathway in tumors. In sum, our data propose inhibition of the RHOA-ROCK1/2-pathway as a novel therapy also for human GC.
The following are the supplementary data related to this article.
M1 Supporting PET/CT movie. Tumor animal with PBS = control.
M2 Supporting PET/CT movie. Tumor animal with fasudil = therapy.
Primer sequences.
Figure S1. Supporting RT-qPCR analyses.
(A) Expression of RHOA and ROCK1/2 mRNAs in human transformed (HEK293T) and GC (AGS, MKN45) cell lines. CT values from RT-qPCRs were normalized to human beta 2-microglobulin (B2M) and calculated as fold ± S.E. (n = 3 per cell line).
(B) Expression of RhoA and Rock1/2 mRNAs in vivo. Data from RT-qPCRs normalized to mouse B2m are presented as in A (n = 5 mice per genotype, n.s. NT vs. TU). Representative agarose gels from RT-PCRs are shown below.
Figure S2. MALDI MS/MS imaging confirms drug distribution to gastric tissue. Whole stomach cryosections of fasudil-treated (30 minutes) and PBS-treated (control) tumor-bearing CEA424-SV40 TAg mice were subjected to MALDI tandem mass spectrometry imaging using an UltrafleXtreme MALDI-TOF/TOF instrument. (A) Fasudil distribution was first measured in MS mode at a raster size of 100 µm and subsequently confirmed in MS/MS mode measuring with a 50-µm offset in x and y direction on the same tissue. (B) MS/MS spectra of the control tissue (gray) and the dosed tissue (red). The insert shows the specific fragment m/z 99 Da which was selected for the ion image.
Figure S3. Fasudil is able to distribute to gastric tumor tissue. Whole stomach cryosections were analyzed as in S2. (A) Displayed are the DHB matrix peak normalized ion images of the tumor marker PC(16:0/18:1)+K+ (green) and fasudil (red) of three exemplary dosed stomach tissue sections. (B) Examples for average spectra of 25 single spectra from the tumor regions of a PBS control (Tumor−) and fasudil-dosed animal (Tumor+) and of the nonmalignant gastric region of a fasudil-dosed animal (Corpus+). The red box indicates the fasudil peak in the spectra.
S4 FTICR tandem mass spectrometry identifies the tumor marker candidate as PC(34:1)+K+. A single spectrum generated by accumulating 200 shots directly from the GC stomach tissue is displayed. Characteristic fragments are depicted in the structural formula.
Figure S5. FTICR-MS confirms MALDI TOF signals in stomach tissue. A section of 9 mm2 was analyzed by MALDI FTICR MS to confirm analyte masses with a higher mass accuracy. Images were recorded with a spatial resolution of 100 µm. FT-MS images of fasudil (m/z 292.11), hydroxyfasudil (m/z 308.10), and the tumor marker PC(16:0/18:1)+K+ (m/z 798.5410) are shown.
Figure S6. High-resolution coronal PET/CT images confirm preclinical efficacy of fasudil. Coronal view of PET/CT overlay images of exemplary PBS-treated (“control 1”) and fasudil-treated (“therapy 3”) tumor-bearing CEA424-SV40 TAg mice. In addition to the tumor, [18F]-FDG uptake was also visible in the brain, heart, kidneys, knees, and bladder. Animals from Figure 5A are shown.
Figure S7. High-resolution axial PET/CT images confirm preclinical efficacy of fasudil. Axial view of CT (left), PET (middle) and overlay (PET/CT) images of exemplary PBS-treated (“control 1”) and fasudil-treated (“therapy 3”) tumor-bearing CEA424-SV40 TAg. Animals are from Figure.5A.
Figure S8. Fasudil reduces MAPK signaling in gastric tumors of CEA424-SV40 Tag mice. Immunofluorescence microscopy of (un)phosphorylated p38 (A, B) and ERK1/2 (p44/42) (C, D) kinases in murine GC compared with normal gastric mouse stomach tissues (corpus). FFPE sections from stomachs of fasudil-treated and PBS-control CEA424-SV40 TAg mice were subjected to triple-color staining. Legend: red = MAPK, green = Actin (phalloidin), blue = nuclei (DAPI [nuclei]; magnification ×400. Representative images are shown.
Author Contributions
Conception and design: E.B., C.H., B.W., M.E.
Development of methodology: Sa. S., Bj. M., J.F., Bo. M., M.R., A.-M.S.
Acquisition of data: E.B., I.H., Sa. S., J.F., M.R., A.-M.S.
Analysis and interpretation of data: E.B., I.H., Sa. S., J.F., M.R., A.-M.S.
Writing, review, and/or revision of the manuscript: E.B., I.H., Sa. S., M.R., C.H., B.W., St. S., M.E.
Administrative, technical, or material support: A.-M.S.
Study supervision: E.B., C.H.
Acknowledgements
We want to thank Sandra Schneider and Frank Herweck for excellent technical assistance.
Footnotes
Financial support: This study was supported by a grant to E.B. from the Deutsche Forschungsgemeinschaft (DFG BU2285) and to C.H. from the German Federal Ministry of Education and Research (17001X11 and 03FH018IN4) and from Baden-Württemberg Ministry of Science and Culture “ZAFH ABIMAS” (ZO IV and EFRE funding). This work was also funded by the BMBF (Project M2oBiTE “Molecular Bioanalytics and Theranostics” 13GW0091B to C.H. and 13GW0091E to B.W.) and the DFG (Project Small Animal PET/CT INST 91027/11). M.E. received funding from ZOBEL (Center of Geriatric Biology and Oncology) and Land Baden-Württemberg (Perspektivförderung).
Disclosure of Potential Conflicts of Interest: J.F. is an employee of Bruker Daltonik GmbH. No potential conflicts of interest exist for the other authors.
References
- 1.McLean MH, El-Omar EM. Genetics of gastric cancer. Nat Rev Gastroenterol Hepatol. 2014;11:664–674. doi: 10.1038/nrgastro.2014.143. [DOI] [PubMed] [Google Scholar]
- 2.Tan P, Yeoh KG. Genetics and molecular pathogenesis of gastric adenocarcinoma. Gastroenterology. 2015;149:1153–1162. doi: 10.1053/j.gastro.2015.05.059. [DOI] [PubMed] [Google Scholar]
- 3.Network CGAR Comprehensive molecular characterization of gastric adenocarcinoma. Nature. 2014;513:202–209. doi: 10.1038/nature13480. [DOI] [PMC free article] [PubMed] [Google Scholar]
- 4.Wang K, Yuen ST, Xu J, Lee SP, Yan HH, Shi ST, Siu HC, Deng S, Chu KM, Law S. Whole-genome sequencing and comprehensive molecular profiling identify new driver mutations in gastric cancer. Nat Genet. 2014;46:573–582. doi: 10.1038/ng.2983. [DOI] [PubMed] [Google Scholar]
- 5.Kakiuchi M, Nishizawa T, Ueda H, Gotoh K, Tanaka A, Hayashi A, Yamamoto S, Tatsuno K, Katoh H, Watanabe Y. Recurrent gain-of-function mutations of RHOA in diffuse-type gastric carcinoma. Nat Genet. 2014;46:583–587. doi: 10.1038/ng.2984. [DOI] [PubMed] [Google Scholar]
- 6.Heasman SJ, Ridley AJ. Mammalian Rho GTPases: new insights into their functions from in vivo studies. Nat Rev Mol Cell Biol. 2008;9:690–701. doi: 10.1038/nrm2476. [DOI] [PubMed] [Google Scholar]
- 7.Doran JD, Liu X, Taslimi P, Saadat A, Fox T. New insights into the structure–function relationships of Rho-associated kinase: a thermodynamic and hydrodynamic study of the dimer-to-monomer transition and its kinetic implications. Biochem J. 2004;384:255–262. doi: 10.1042/BJ20040344. [DOI] [PMC free article] [PubMed] [Google Scholar]
- 8.Dvorsky R, Blumenstein L, Vetter IR, Ahmadian MR. Structural insights into the interaction of ROCKI with the switch regions of RhoA. J Biol Chem. 2004;279:7098–7104. doi: 10.1074/jbc.M311911200. [DOI] [PubMed] [Google Scholar]
- 9.Couzens AL, Saridakis V, Scheid MP. The hydrophobic motif of ROCK2 requires association with the N-terminal extension for kinase activity. Biochem J. 2009;419:141–148. doi: 10.1042/BJ20081376. [DOI] [PubMed] [Google Scholar]
- 10.Jacobs M, Hayakawa K, Swenson L, Bellon S, Fleming M, Taslimi P, Doran J. The structure of dimeric ROCK I reveals the mechanism for ligand selectivity. J Biol Chem. 2006;281:260–268. doi: 10.1074/jbc.M508847200. [DOI] [PubMed] [Google Scholar]
- 11.Schofield AV, Bernard O. Rho-associated coiled-coil kinase (ROCK) signaling and disease. Crit Rev Biochem Mol Biol. 2013;48:301–316. doi: 10.3109/10409238.2013.786671. [DOI] [PubMed] [Google Scholar]
- 12.Mueller BK, Mack H, Teusch N. Rho kinase, a promising drug target for neurological disorders. Nat Rev Drug Discov. 2005;4:387–398. doi: 10.1038/nrd1719. [DOI] [PubMed] [Google Scholar]
- 13.Loirand G, Pacaud P. The role of Rho protein signaling in hypertension. Nat Rev Cardiol. 2010;7:637–647. doi: 10.1038/nrcardio.2010.136. [DOI] [PubMed] [Google Scholar]
- 14.Satoh S, Ikegaki I, Kawasaki K, Asano T, Shibuya M. Pleiotropic effects of the rho-kinase inhibitor fasudil after subarachnoid hemorrhage: a review of preclinical and clinical studies. Curr Vasc Pharmacol. 2014;12:758–765. doi: 10.2174/1570161112666140613115813. [DOI] [PubMed] [Google Scholar]
- 15.Ying H, Biroc SL, Li WW, Alicke B, Xuan JA, Pagila R, Ohashi Y, Okada T, Kamata Y, Dinter H. The Rho kinase inhibitor fasudil inhibits tumor progression in human and rat tumor models. Mol Cancer Ther. 2006;5:2158–2164. doi: 10.1158/1535-7163.MCT-05-0440. [DOI] [PubMed] [Google Scholar]
- 16.Xia Y, Cai XY, Fan JQ, Zhang LL, Ren JH, Chen J, Li ZY, Zhang RG, Zhu F, Wu G. Rho kinase inhibitor fasudil suppresses the vasculogenic mimicry of B16 mouse melanoma cells both in vitro and in vivo. Mol Cancer Ther. 2015;14:1582–1590. doi: 10.1158/1535-7163.MCT-14-0523. [DOI] [PubMed] [Google Scholar]
- 17.Miyamoto C, Maehata Y, Motohashi K, Ozawa S, Ikoma T, Hidaka K, Wada-Takahashi S, Takahashi SS, Yoshino F, Yoshida A. Fasudil, a Rho kinase inhibitor, suppresses tumor growth by inducing CXCL14/BRAK in head and neck squamous cell carcinoma. Biomed Res. 2014;35:381–388. doi: 10.2220/biomedres.35.381. [DOI] [PubMed] [Google Scholar]
- 18.Deng L, Li G, Li R, Liu Q, He Q, Zhang J. Rho-kinase inhibitor, fasudil, suppresses glioblastoma cell line progression in vitro and in vivo. Cancer Biol Ther. 2010;9:875–884. doi: 10.4161/cbt.9.11.11634. [DOI] [PubMed] [Google Scholar]
- 19.Lin MT, Lin BR, Chang CC, Chu CY, Su HJ, Chen ST, Jeng YM, Kuo ML. IL-6 induces AGS gastric cancer cell invasion via activation of the c-Src/RhoA/ROCK signaling pathway. Int J Cancer. 2007;120:2600–2608. doi: 10.1002/ijc.22599. [DOI] [PubMed] [Google Scholar]
- 20.Pan Y, Bi F, Liu N, Xue Y, Yao X, Zheng Y, Fan D. Expression of seven main Rho family members in gastric carcinoma. Biochem Biophys Res Commun. 2004;315:686–691. doi: 10.1016/j.bbrc.2004.01.108. [DOI] [PubMed] [Google Scholar]
- 21.Huang KH, Lan YT, Chen MH, Chao Y, Lo SS, Li AF, Wu CW, Chiou SH, Yang MH, Shyr YM. The correlation between rhoa expression and clinicopathological characteristics in gastric cancer patients after curative surgery. World J Surg. 2015;39:2289–2299. doi: 10.1007/s00268-015-3095-4. [DOI] [PubMed] [Google Scholar]
- 22.Rocken C, Behrens HM, Boger C, Kruger S. Clinicopathological characteristics of RHOA mutations in a Central European gastric cancer cohort. J Clin Pathol. 2015 doi: 10.1136/jclinpath-2015-202980. [epub ahead of print] [DOI] [PMC free article] [PubMed] [Google Scholar]
- 23.Ushiku T, Ishikawa S, Kakiuchi M, Tanaka A, Katoh H, Aburatani H, Lauwers GY, Fukayama M. RHOA mutation in diffuse-type gastric cancer: a comparative clinicopathology analysis of 87 cases. Gastric Cancer. 2015 doi: 10.1007/s10120-015-0493-0. [epub ahead of print] [DOI] [PMC free article] [PubMed] [Google Scholar]
- 24.Xu XT, Song QB, Yao Y, Ruan P, Tao ZZ. Inhibition of RhoA/ROCK signaling pathway promotes the apoptosis of gastric cancer cells. Hepatogastroenterology. 2012;59:2523–2526. doi: 10.5754/hge12147. [DOI] [PubMed] [Google Scholar]
- 25.Sun HW, Tong SL, He J, Wang Q, Zou L, Ma SJ, Tan HY, Luo JF, Wu HX. RhoA and RhoC-siRNA inhibit the proliferation and invasiveness activity of human gastric carcinoma by Rho/PI3K/Akt pathway. World J Gastroenterol. 2007;13:3517–3522. doi: 10.3748/wjg.v13.i25.3517. [DOI] [PMC free article] [PubMed] [Google Scholar]
- 26.Liu N, Bi F, Pan Y, Sun L, Xue Y, Shi Y, Yao X, Zheng Y, Fan D. Reversal of the malignant phenotype of gastric cancer cells by inhibition of RhoA expression and activity. Clin Cancer Res. 2004;10:6239–6247. doi: 10.1158/1078-0432.CCR-04-0242. [DOI] [PubMed] [Google Scholar]
- 27.Thompson J, Epting T, Schwarzkopf G, Singhofen A, Eades-Perner AM, van Der Putten H, Zimmermann W. A transgenic mouse line that develops early-onset invasive gastric carcinoma provides a model for carcinoembryonic antigen-targeted tumor therapy. Int J Cancer. 2000;86:863–869. doi: 10.1002/(sici)1097-0215(20000615)86:6<863::aid-ijc16>3.0.co;2-4. [DOI] [PubMed] [Google Scholar]
- 28.Ihler F, Vetter EV, Pan J, Kammerer R, Debey-Pascher S, Schultze JL, Zimmermann W, Enders G. Expression of a neuroendocrine gene signature in gastric tumor cells from CEA 424-SV40 large T antigen-transgenic mice depends on SV40 large T antigen. PLoS One. 2012;7:e29846. doi: 10.1371/journal.pone.0029846. [DOI] [PMC free article] [PubMed] [Google Scholar]
- 29.Burgermeister E, Xing X, Rocken C, Juhasz M, Chen J, Hiber M, Mair K, Shatz M, Liscovitch M, Schmid RM. Differential expression and function of caveolin-1 in human gastric cancer progression. Cancer Res. 2007;67:8519–8526. doi: 10.1158/0008-5472.CAN-07-1125. [DOI] [PubMed] [Google Scholar]
- 30.Friedrich T, Richter B, Gaiser T, Weiss C, Janssen KP, Einwachter H, Schmid RM, Ebert MP, Burgermeister E. Deficiency of caveolin-1 in Apc(min/+) mice promotes colorectal tumorigenesis. Carcinogenesis. 2013;34:2109–2118. doi: 10.1093/carcin/bgt142. [DOI] [PubMed] [Google Scholar]
- 31.Ebert MP, Tanzer M, Balluff B, Burgermeister E, Kretzschmar AK, Hughes DJ, Tetzner R, Lofton-Day C, Rosenberg R, Reinacher-Schick AC. TFAP2E-DKK4 and chemoresistance in colorectal cancer. N Engl J Med. 2012;366:44–53. doi: 10.1056/NEJMoa1009473. [DOI] [PubMed] [Google Scholar]
- 32.Munteanu B, Meyer B, von Reitzenstein C, Burgermeister E, Bog S, Pahl A, Ebert MP, Hopf C. Label-free in situ monitoring of histone deacetylase drug target engagement by matrix-assisted laser desorption ionization-mass spectrometry biotyping and imaging. Anal Chem. 2014;86:4642–4647. doi: 10.1021/ac500038j. [DOI] [PubMed] [Google Scholar]
- 33.Fulop A, Porada MB, Marsching C, Blott H, Meyer B, Tambe S, Sandhoff R, Junker HD, Hopf C. 4-Phenyl-alpha-cyanocinnamic acid amide: screening for a negative ion matrix for MALDI-MS imaging of multiple lipid classes. Anal Chem. 2013;85:9156–9163. doi: 10.1021/ac4018154. [DOI] [PubMed] [Google Scholar]
- 34.Schulz S, Gerhardt D, Meyer B, Seegel M, Schubach B, Hopf C, Matheis K. DMSO-enhanced MALDI MS imaging with normalization against a deuterated standard for relative quantification of dasatinib in serial mouse pharmacology studies. Anal Bioanal Chem. 2013;405:9467–9476. doi: 10.1007/s00216-013-7393-0. [DOI] [PubMed] [Google Scholar]
- 35.Litau S, Seibold U, Vall-Sagarra A, Fricker G, Wangler B, Wangler C. Comparative assessment of complex stabilities of radiocopper chelating agents by a combination of complex challenge and in vivo experiments. ChemMedChem. 2015;10:1200–1208. doi: 10.1002/cmdc.201500132. [DOI] [PubMed] [Google Scholar]
- 36.Niedermoser S, Chin J, Wangler C, Kostikov A, Bernard-Gauthier V, Vogler N, Soucy JP, McEwan AJ, Schirrmacher R, Wängler B. In Vivo Evaluation of 18F-SiFAlin-modified TATE: A potential challenge for 68Ga-DOTATATE, the clinical gold standard for somatostatin receptor imaging with PET. J Nucl Med. 2015;56:1100–1105. doi: 10.2967/jnumed.114.149583. [DOI] [PubMed] [Google Scholar]
- 37.Stepanenko AA, Dmitrenko VV. HEK293 in cell biology and cancer research: phenotype, karyotype, tumorigenicity, and stress-induced genome-phenotype evolution. Gene. 2015;569:182–190. doi: 10.1016/j.gene.2015.05.065. [DOI] [PubMed] [Google Scholar]
- 38.Nunbhakdi-Craig V, Craig L, Machleidt T, Sontag E. Simian virus 40 small tumor antigen induces deregulation of the actin cytoskeleton and tight junctions in kidney epithelial cells. J Virol. 2003;77:2807–2818. doi: 10.1128/JVI.77.5.2807-2818.2003. [DOI] [PMC free article] [PubMed] [Google Scholar]
- 39.Martel C, Harper F, Cereghini S, Noe V, Mareel M, Cremisi C. Inactivation of retinoblastoma family proteins by SV40 T antigen results in creation of a hepatocyte growth factor/scatter factor autocrine loop associated with an epithelial-fibroblastoid conversion and invasiveness. Cell Growth Differ. 1997;8:165–178. [PubMed] [Google Scholar]
- 40.Koumura A, Hamanaka J, Kawasaki K, Tsuruma K, Shimazawa M, Hozumi I. Fasudil and ozagrel in combination show neuroprotective effects on cerebral infarction after murine middle cerebral artery occlusion. J Pharmacol Exp Ther. 2011;338:337–344. doi: 10.1124/jpet.110.177675. [DOI] [PubMed] [Google Scholar]
- 41.Uehara T, Kikuchi H, Miyazaki S, Iino I, Setoguchi T, Hiramatsu Y, Ohta M, Kamiya K, Morita Y, Tanaka H. Overexpression of lysophosphatidylcholine acyltransferase 1 and concomitant lipid alterations in gastric cancer. Ann Surg Oncol. 2015 doi: 10.1245/s10434-015-4459-6. [epub ahead of print] [DOI] [PubMed] [Google Scholar]
- 42.Correa P, Haenszel W, Tannenbaum S. Epidemiology of gastric carcinoma: review and future prospects. Natl Cancer Inst Monogr. 1982;62:129–134. [PubMed] [Google Scholar]
- 43.Regel I, Merkl L, Friedrich T, Burgermeister E, Zimmermann W, Einwachter H, Herrmann K, Langer R, Röcken C, Hofheinz R. Pan-histone deacetylase inhibitor panobinostat sensitizes gastric cancer cells to anthracyclines via induction of CITED2. Gastroenterology. 2012;143:99–109. doi: 10.1053/j.gastro.2012.03.035. [DOI] [PubMed] [Google Scholar]
- 44.Burgermeister E, Friedrich T, Hitkova I, Regel I, Einwachter H, Zimmermann W, Röcken C, Perren A, Wright MB, Schmid RM. The Ras inhibitors caveolin-1 and docking protein 1 activate peroxisome proliferator-activated receptor gamma through spatial relocalization at helix 7 of its ligand-binding domain. Mol Cell Biol. 2011;31:3497–3510. doi: 10.1128/MCB.01421-10. [DOI] [PMC free article] [PubMed] [Google Scholar]
- 45.Vetter E, Kronast M, Tolge M, Zimmermann W. Lgr5-expressing stem cells are not the cells of origin of pyloric neuroendocrine carcinomas in mice. J Pathol. 2015 doi: 10.1002/path.4629. [epub ahead of print] [DOI] [PubMed] [Google Scholar]
- 46.Minchinton AI, Tannock IF. Drug penetration in solid tumours. Nat Rev Cancer. 2006;6:583–592. doi: 10.1038/nrc1893. [DOI] [PubMed] [Google Scholar]
- 47.Choi IK, Strauss R, Richter M, Yun CO, Lieber A. Strategies to increase drug penetration in solid tumors. Front Oncol. 2013;3:193. doi: 10.3389/fonc.2013.00193. [DOI] [PMC free article] [PubMed] [Google Scholar]
- 48.Galluzzi L, Kepp O, Vander Heiden MG, Kroemer G. Metabolic targets for cancer therapy. Nat Rev Drug Discov. 2013;12:829–846. doi: 10.1038/nrd4145. [DOI] [PubMed] [Google Scholar]
- 49.Wu YJ, Tang Y, Li ZF, Li Z, Zhao Y, Wu ZJ, Su Q. Expression and significance of Rac1, Pak1 and Rock1 in gastric carcinoma. Asia Pac J Clin Oncol. 2014;10:e33–e39. doi: 10.1111/ajco.12052. [DOI] [PMC free article] [PubMed] [Google Scholar]
- 50.Li LH, Luo Q, Zheng MH, Pan C, Wu GY, Lu YZ, Feng B, Chen XH, Liu BY. P21-activated protein kinase 1 is overexpressed in gastric cancer and induces cancer metastasis. Oncol Rep. 2012;27:1435–1442. doi: 10.3892/or.2012.1664. [DOI] [PubMed] [Google Scholar]
Associated Data
This section collects any data citations, data availability statements, or supplementary materials included in this article.
Supplementary Materials
M1 Supporting PET/CT movie. Tumor animal with PBS = control.
M2 Supporting PET/CT movie. Tumor animal with fasudil = therapy.
Primer sequences.
Figure S1. Supporting RT-qPCR analyses.
(A) Expression of RHOA and ROCK1/2 mRNAs in human transformed (HEK293T) and GC (AGS, MKN45) cell lines. CT values from RT-qPCRs were normalized to human beta 2-microglobulin (B2M) and calculated as fold ± S.E. (n = 3 per cell line).
(B) Expression of RhoA and Rock1/2 mRNAs in vivo. Data from RT-qPCRs normalized to mouse B2m are presented as in A (n = 5 mice per genotype, n.s. NT vs. TU). Representative agarose gels from RT-PCRs are shown below.
Figure S2. MALDI MS/MS imaging confirms drug distribution to gastric tissue. Whole stomach cryosections of fasudil-treated (30 minutes) and PBS-treated (control) tumor-bearing CEA424-SV40 TAg mice were subjected to MALDI tandem mass spectrometry imaging using an UltrafleXtreme MALDI-TOF/TOF instrument. (A) Fasudil distribution was first measured in MS mode at a raster size of 100 µm and subsequently confirmed in MS/MS mode measuring with a 50-µm offset in x and y direction on the same tissue. (B) MS/MS spectra of the control tissue (gray) and the dosed tissue (red). The insert shows the specific fragment m/z 99 Da which was selected for the ion image.
Figure S3. Fasudil is able to distribute to gastric tumor tissue. Whole stomach cryosections were analyzed as in S2. (A) Displayed are the DHB matrix peak normalized ion images of the tumor marker PC(16:0/18:1)+K+ (green) and fasudil (red) of three exemplary dosed stomach tissue sections. (B) Examples for average spectra of 25 single spectra from the tumor regions of a PBS control (Tumor−) and fasudil-dosed animal (Tumor+) and of the nonmalignant gastric region of a fasudil-dosed animal (Corpus+). The red box indicates the fasudil peak in the spectra.
S4 FTICR tandem mass spectrometry identifies the tumor marker candidate as PC(34:1)+K+. A single spectrum generated by accumulating 200 shots directly from the GC stomach tissue is displayed. Characteristic fragments are depicted in the structural formula.
Figure S5. FTICR-MS confirms MALDI TOF signals in stomach tissue. A section of 9 mm2 was analyzed by MALDI FTICR MS to confirm analyte masses with a higher mass accuracy. Images were recorded with a spatial resolution of 100 µm. FT-MS images of fasudil (m/z 292.11), hydroxyfasudil (m/z 308.10), and the tumor marker PC(16:0/18:1)+K+ (m/z 798.5410) are shown.
Figure S6. High-resolution coronal PET/CT images confirm preclinical efficacy of fasudil. Coronal view of PET/CT overlay images of exemplary PBS-treated (“control 1”) and fasudil-treated (“therapy 3”) tumor-bearing CEA424-SV40 TAg mice. In addition to the tumor, [18F]-FDG uptake was also visible in the brain, heart, kidneys, knees, and bladder. Animals from Figure 5A are shown.
Figure S7. High-resolution axial PET/CT images confirm preclinical efficacy of fasudil. Axial view of CT (left), PET (middle) and overlay (PET/CT) images of exemplary PBS-treated (“control 1”) and fasudil-treated (“therapy 3”) tumor-bearing CEA424-SV40 TAg. Animals are from Figure.5A.
Figure S8. Fasudil reduces MAPK signaling in gastric tumors of CEA424-SV40 Tag mice. Immunofluorescence microscopy of (un)phosphorylated p38 (A, B) and ERK1/2 (p44/42) (C, D) kinases in murine GC compared with normal gastric mouse stomach tissues (corpus). FFPE sections from stomachs of fasudil-treated and PBS-control CEA424-SV40 TAg mice were subjected to triple-color staining. Legend: red = MAPK, green = Actin (phalloidin), blue = nuclei (DAPI [nuclei]; magnification ×400. Representative images are shown.