

Abstract
The propagation of mechanical signals through nonlinear fibrous tissues is much more extensive than through continuous synthetic hydrogels. Results from recent studies indicate that increased mechanical propagation arises from the fibrous nature of the material rather than the strain-stiffening property. The relative importance of different parameters of the fibrous network structure to this propagation, however, remains unclear. In this work, we directly compared the mechanical response of substrates of varying thickness subjected to a constant cell traction force using either a nonfibrous strain-stiffening continuum-based model or a volume-averaged fiber network model consisting of two different types of fiber network structures: one with low fiber connectivity (growth networks) and one with high fiber connectivity (Delaunay networks). The growth network fiber models predicted a greater propagation of substrate displacements through the model and a greater sensitivity to gel thickness compared to the more connected Delaunay networks and the nonlinear continuum model. Detailed analysis of the results indicates that rotational freedom of the fibers in a network with low fiber connectivity is critically important for enhanced, long-range mechanosensing. Our findings demonstrate the utility of multiscale models in predicting cells mechanosensing on fibrous gels, and they provide a more complete understanding of how cell traction forces propagate through fibrous tissues, which has implications for the design of engineered tissues and the stem cell niche.
Keywords: cell traction, fiber mechanics, mechanical environment, mechanosensing, connectivity
1. Introduction
Cells sense and respond to the physical attributes of their environment in a manner that profoundly affects the development, homeostasis, and repair of tissues [1–3]. These attributes, which include substrate dimensionality, stiffness, porosity, and topology, are also important to consider in a number of strategies in regenerative medicine, such as in designing the stem cell niche [4,5]. As such, a number of experimental and computational studies have sought to identify the role that each attribute of the mechanical environment plays in directing various cell activities, including cell migration [6], proliferation [7], differentiation [8], and extracellular matrix (ECM) remodeling [9,10].
A popular experimental technique used to study the effect of ECM stiffness on cell behavior is to culture cells on polyacrylamide (PA) [11,12], polydimethylsiloxane [13], or other substrates with known elastic modulus values. These substrates are used primarily because they are inexpensive and readily available biocompatible materials whose mechanical properties are tunable over a range of biologically relevant stiffnesses [8,11]. Another important advantage is that mechanical analysis of the experiments is greatly simplified compared to native tissues due to the linear elastic, homogeneous, and isotropic properties of these synthetic materials. Although the use of such materials has revealed much about the mechanobiology of various cell types, these materials are limited in that they are not directly comparable to the ECM that these cells reside in. The profile of the material properties of the ECM can be categorized as substantially more complicated (i.e., nonlinear, anelastic, heterogeneous, and anisotropic). Much of this character derives from the fibrous nature of the ECM and the fact that these fibers are often connected into networks that organize into hierarchical structures at each scale of the tissue. Experiments on fibrous substrates, such as fibrin and collagen, have demonstrated that the cellular response is quite different than for a nonfibrous substrate of comparable bulk stiffness [14–17].
Several computational models have been developed that have helped further our understanding of how cells interact mechanically with their substrates [18–25]. For example, Sen et al. modeled a contracting cell placed on a linear elastic PA gel and computed the deformations and strain field using finite element (FE) analysis [21]. They calculated a mechanosensing length scale through the depth of the gel that decreased from a few microns to a few hundred nanometers with increasing gel stiffness. Others, using similar theoretical treatments, predict that the gel effective stiffness decreases with increasing substrate thickness, reaching an asymptotic depth of 50 μm [22,23], or a depth approaching the lateral dimension of a cell [25,26]. These studies indicate that the combination of material properties and gel geometry dictates the amount of load sharing between the gel and the underlying rigid substrate in opposition to the applied cell traction force, and thus the extent of depth sensing by a cell.
These continuum-based models, however, do not include discrete fiber networks that account for nonaffine fiber–fiber interactions. As a result, continuum models may underestimate long-range mechanical sensing observed for cells on fibrous substrates where sensing distances up to several hundred microns have been reported [15,27,28]. Recently, several models that incorporate fiber networks have been proposed [14,29–32]. Aghvami et al. used a multiscale FE model to demonstrate that long-range force transmission from other cell clusters and from the gel boundaries controls fiber remodeling in a cell-compacted collagen gel [29]. Notbohm et al. developed a nonlinear FE model for a fiber network representing fibrin gels and showed that cells in a fibrous matrix induce deformations that propagate longer distances than predicted by linear elasticity [30]. Abhilash et al. presented an FE model for 2D discrete fiber networks created with linear elastic fibers and also captured cell-mediated collagen alignment, deformations, and long-range force transmission [31]. Previously, our group constructed FE models with either a hyperelastic constitutive equation or a set of volume-averaged fiber networks to simulate gel deformations produced by a single cell in order to understand whether the enhanced fibroblast mechanosensing observed experimentally on fibrous gels was due to nonlinear material stiffening or to the properties of the fiber networks themselves [14]. Simulation results suggest that the increase in cell spreading area on fibrous gels compared to PA gels of comparable bulk stiffness is better predicted when fiber networks are explicitly represented in the model. However, it remains unclear what attributes of fiber network structure account for enhanced mechanosensing of physical boundaries and neighboring cells within sparse fibrous tissues and tissue models.
In this work, we present a detailed investigation of how differences in the representation of fiber network structure, particularly with respect to fiber connectivity, contribute to mechanical transmission of cell traction forces into the surrounding substrate. Specifically, we directly compared the mechanical response of substrates of varying thickness to a constant cell traction force using either a nonlinear hyperelastic constitutive equation or a volume-averaged fiber network model consisting of either low connectivity growth networks or high connectivity Delaunay networks. In addition, all models used the same rectangular FE geometries and boundary conditions, which allowed for a more direct comparison of the simulation results than in previous work [14].
2. Methods
In this work, we comprehensively compare a continuum-based finite element (FE) model (continuum model) that uses a third-order strain energy density function to describe material nonlinear strain-stiffening behavior with a multiscale fiber network FE model (fiber model) that consists of a set of fiber networks that are either characterized as growth networks or Delaunay networks (c.f. Secs. 2.2 and 2.3, respectively). The nonlinear response of the fiber model primarily derives from nonaffine rotations and stretch of the individual crosslinked fibers of the network. To facilitate direct comparisons between the different types of models formulated to describe different physical attributes of the system, the parameters governing each model were selected so that the shear stress–strain response of each model matched the macroscopic mechanical behavior of a 2 mg/mL acellular fibrin gel (data obtained from Ref. [33]) representative of those used as substrates for the study of cell mechanosensing.
2.1. Models and Boundary Conditions.
The propagation of cell traction forces through deformable substrates of increasing thickness was assessed by considering one-element wide, rectangular FE meshes representing a spatial scale of 75 μm × 4 μm × (10–200) μm (length, width, and thickness). Three FE meshes consisting of trilinear hexahedral elements were created in abaqus cae (v. 6.12-1; ABAQUS, Providence, RI). These meshes had thicknesses of 10 μm, 30 μm, 50 μm, and 200 μm, respectively.
A schematic of the model is shown in Fig. 1. It depicts a single cell applying a constant inward traction force on the surface of a finite thickness gel. The model possesses axes of symmetry on the left surface and the front and back surfaces. For the left surface, the nodes were fixed in x and z and free in y (i.e., nodes were free to move up and down through the thickness). For the front and back surfaces, the nodes were fixed in z and free in x and y (i.e., nodes were free to move along the length and thickness). For the bottom and right surfaces, the nodes were fixed in x, y, and z, and for the top surface, the nodes were free in x, y, and z. A small subset of 22 nodes on the top surface was designated as focal adhesion nodes contained with the focal adhesion area at the front of the cell. A total cell traction force of 6 nN, which is equivalent to a cell traction stress of about 250 Pa (within the range of those reported from traction force microscopy studies [34,35]), was applied to these nodes by equally dividing this total force among the nodes and over 55 equally spaced steps. A region on the top surface starting 9 μm from the left surface and extending an additional 6 μm in length was designated as the focal adhesion area for comparison with our previous work [14]. Since large stress gradients develop in this region, the mesh in this area (a region measuring 24 μm × 5 μm (length and thickness)) was locally refined until there was less than a 1% change in the total nodal displacement at the end of the simulation with further mesh refinement.
Fig. 1.

Schematic of the FE model. Cell traction forces are applied to the FE nodes (red) associated with the focal adhesion area on the FE top surface. For the fiber model, 3D growth or Delaunay fiber networks similar to the microstructures found in fibrous gels were compared to the nonlinear continuum model.
2.2. Continuum Model.
The effects of material nonlinearity (strain stiffening) were investigated using FE models constructed in abaqus (v. 6.12-1; ABAQUS, Providence, RI) with C3D8 (trilinear hexahedral) elements. We selected a third-order (cubic) reduced polynomial strain energy function given by
| (1) |
where is the strain energy density, is the first strain invariant, , , and are material constants, is a compressibility term, and is the elastic volume strain [36]. Note that combines the Poisson's ratio, and shear modulus, G, via the relationship . We selected this strain energy function because it is of the same form as the third-order reduced polynomial used in our earlier preliminary investigation, and it is able to match the nonlinear stiffening behavior of fibrous gels [14]. We refer to this model throughout the paper as the continuum model.
2.3. Fiber Model.
The fiber model employed herein uses a multiscale modeling framework that has been used extensively to model multiscale phenomena is a variety of fibrous materials, including collagen gels [29,37–39], electrospun scaffolds [40], and fibrous tissues [41,42]. The model consists of a Galerkin FE representation of the macroscopic scale and a set of microscopic crosslinked fiber networks that are coupled via volume averaging theory [37]. The fiber networks essentially function as complex constitutive equations that relate nonaffine microscopic network fiber kinematics to macroscopic stress. In order for the model to converge, the fiber networks must be in force equilibrium and the macroscopic stresses must balance. The force, F, associated with a fiber is described by a phenomenological exponential force–strain relation proposed by Billiar and Sacks [43] that is given as
| (2) |
where Ef is the Young's modulus in the limit of small strain, Af is the cross-sectional area of a fiber, B is a fitting parameter that controls the nonlinearity of the force, is the Lagrangian strain, and is the fiber stretch ratio. The macroscopic volume-averaged Cauchy stress of the fiber network, , is calculated as
| (3) |
where is the local microscopic stress, V is the volume of the fiber network, and xi and are the components of the position and force on the boundary nodes, respectively. A macroscopic-level (i.e., continuum-level) neo-Hookean stress is added to this volume-averaged stress to give the total macroscopic stress in order to limit the compressibility of the fiber networks [41]. This stress component only acts at the macroscopic scale and is independent of the volume-average fiber network stress. Here, we employ a compressible formulation of the neo-Hookean constitutive equation given as
| (4) |
where represents the compressible neo-Hookean stress [44], G is the shear modulus, is Poisson's ratio, J is the determinant of the deformation tensor, and B is the left Cauchy–Green deformation tensor.
The expression for the macroscopic stress balance is
| (5) |
where u is the displacement of the network boundary, and n is the unit normal vector.
2.3.1. Fiber Networks.
The microscale is represented by a set of fiber networks that are centered at the integration points of the FE elements. The fibers are connected by crosslinks that are modeled as ball joints that rotate freely. As a result, the angles between fibers change as the fibers stretch, compress, and rotate in order to satisfy force equilibrium. Two microstructurally distinct types of networks were investigated in this study. The first type of network is referred to as a growth network because the algorithm used to produce the network follows rules that are based on a process by which monomeric biomolecules may stochastically self-assemble into fibers (c.f. Ref. [45]). The second type of network we investigated is referred to as a Delaunay network because the networks are generated from Delaunay triangulation [42]. Both types of networks were constructed in matlab, and a collection of distinct networks with the following properties were obtained:
Growth network model: Networks containing 338 ± 30 crosslinked fibers, with nondimensional individual fiber lengths of 0.28 ± 0.23, a total nondimensional fiber length of 94.79 ± 7.21, a fiber connectivity of 3 (i.e., the number of fibers connecting at a crosslink), and 3D orientation tensor (defined below) eigenvalues of 0.29 ± 0.02, 0.33 ± 0.01, and 0.38 ± 0.02.
Delaunay network model: Networks containing 470 ± 9 crosslinked fibers, with nondimensional individual fiber lengths of 0.38 ± 0.16, a total nondimensional fiber length of 178.35 ± 6.49, a fiber connectivity of 13.26 ± 3.75, and 3D orientation tensor eigenvalues of 0.31 ± 0.01, 0.33 ± 0.01, and 0.36 ± 0.01.
Three-dimensional fiber network orientation and strength of alignment can be quantified with the length-weighted orientation tensor, , defined as
| (6) |
where is the length of fiber i, is the angle fiber i makes with the horizontal axis in the x–y plane, is the angle the fiber i makes with the z-axis, and the sum is over all of the fibers, NF, in the network. The eigenvalues and eigenvectors of then correspond to the magnitudes and principal direction of network fiber alignment, respectively, with an isotropic network possessing eigenvalues of [0.33 0.33 0.33] and a completely aligned network possessing eigenvalues of [0 0 1]. Networks in this study were produced so that they were nominally isotropic in all three dimensions. To facilitate visualization, changes in fiber organization and alignment in response to cell traction were quantified using the two-dimensional orientation tensor, , which is given as
| (7) |
The three-dimensional tensor reduces to the two-dimensional tensor when . The degree of anisotropy, , a metric of strength of network fiber alignment, can be defined as , where and are the minor and major eigenvalues of , respectively. Here, the eigenvalues for an isotropic network correspond to [0.5 0.5] and , and for a completely aligned network, these values correspond to [0 1] and [38]. The change in fiber alignment with respect to the initial network configuration can also be defined as , where is the initial strength of network fiber alignment.
2.4. Model Parameters.
Model parameters were selected in order to match the mechanical behavior of a 2 mg/mL acellular fibrin gel in simple shear [14,15]. Continuum and fiber models (described below) were subjected to equivalent boundary conditions and deformations as described in the experiment. Model parameters were selected until the mechanical response fit the experimental data of the test (Fig. 2).
Fig. 2.

Shear simulation results fitted to experimental data for a 2 mg/mL acellular fibrin gel from Ref. [33]. Model parameters were selected to match the nonlinear increase in stress with strain.
2.5. Effective Stiffness.
The stiffness the cell “senses” as a function of the substrate mechanical properties and thicknesses was assessed by calculating the effective stiffness of the system, . Effective stiffness describes a substrate's resistance to deformation upon application of a shear force on the surface of the substrate; this stiffness can differ from the bulk modulus of the substrate due to material nonlinearity and/or fiber interactions. Here effective stiffness was calculated in a manner analogous to that of Mehrotra et al. [22] as
| (8) |
where F is the total traction force exerted by the cell on the substrate, A is the undeformed focal adhesion area, is the mean displacement of the nodes, and is the mean radius of the focal adhesion area. Note that in all models, the force boundary conditions were constant and the only variable that changed was . Thus, for the given traction force applied, a lower displacement at the “focal adhesions” resulted in a higher effective stiffness.
2.6. Computational Resources.
Due to the substantial computational costs associated with the large number of degrees-of-freedom in the fiber network models (i.e., eight fiber networks in each element with more than 1000 degrees-of-freedom per network), simulations were run using a custom parallelized C code with message passing interface (MPI) on high-performance computing resources (ITS Helium Cluster, University of Iowa) utilizing a single 12-core node (Intel Xenon processor with either 24 GB or 144 GB of memory and Infiniband connectivity). The CPU time and wall time for these simulations ranged from approximately 18 h to 1128 h, and from 4 h to 227 h, respectively, depending on the job size. All continuum models were run in abaqus and all postprocessing was done using matlab on a local CoreTM i7-2600 HP desktop computer.
3. Results
The simulation cases considered in this study were designed to ask the following questions: (1) does the experimentally observed long-distance sensing of cells on fibrous gels originate from nonlinearity in the bulk material properties or from some aspect of the fiber structure, and (2) if it is the fiber structure how do differences in idealization of the microstructure affect model predictions. To answer the first question, we compared the continuum model to a growth network fiber model, and to answer the second question, we compared a growth network fiber model to a Delaunay network fiber model.
3.1. Comparison Between Continuum Model and Growth Network Fiber Model.
Material parameters were selected for each model (Table 1) so that the simulated shear stress–strain curves approximated an experimentally generated fibrin gel shear stress–strain curve up to a shear strain of 50% (Fig. 2). The material properties were chosen for each model to match the fibrin gel's nonlinear response at low to midlevel strains because the shear strains developed in the simulations for the applied cell traction force were less than 40%.
Table 1.
Material parameters values used for each model
| Continuum model | C10 = 130 Pa; C20 = 120 Pa; C30 = 125 Pa; v = 0.49 |
| Growth network model | nN; B = 0.2; G = 10 Pa; v = 0.49 |
| Delaunay network model | nN; B = 3; G = 10 Pa; v = 0.49 |
Application of a constant horizontal cell traction force on the gel surface produced comparable magnitudes and patterns in the stress (Fig. 3) and displacement fields (Fig. 4) between the continuum and growth network models for all thicknesses. The largest maximum principal stresses were found in the focal adhesion (FA) area in all models. The average principal stresses in this region were approximately 30–40% lower in the continuum model than in the growth network model for all thicknesses (Table 2). The largest displacements in the models were also found in the FA area. These displacements were between 1.7 and 2.1 times lower in the continuum model than in the growth model and increased with increasing gel thickness.
Fig. 3.

Maximum principal stress for 10 μm, 30 μm, and 50 μm thick gels in response to 6 nN of traction force. Stress contours for the (a) continuum model, the (b) growth network model, and the (c) Delaunay network model. Black nodes correspond to the inner and outer nodes of the focal adhesion area where the traction forces were applied.
Fig. 4.

Displacement fields for 10 μm, 30 μm, and 50 μm thick gels in response to 6 nN of traction force for the (a) continuum model, the (b) growth network model, and the (c) Delaunay network model. Black nodes correspond to the inner and outer nodes of the focal adhesion area where the traction forces were applied.
Table 2.
Average principal stress and displacements in focal adhesion (FA) regions
| Thickness (μm) | Continuum | Growth | Delaunay | |
|---|---|---|---|---|
| Principal stress (Pa) | 10 | 266 ± 119 | 366 ± 204 | 368 ± 199 |
| 30 | 278 ± 124 | 420 ± 206 | 385 ± 190 | |
| 50 | 277 ± 122 | 444 ± 191 | 387 ± 192 | |
| 200 | 275 ± 121 | 445 ± 175 | 391 ± 183 | |
| FA displacement (μm) | 10 | 1.7 ± 0.1 | 2.9 ± 0.2 | 2.1 ± 0.1 |
| 30 | 2.0 ± 0.2 | 3.9 ± 0.2 | 2.5 ± 0.1 | |
| 50 | 2.1 ± 0.2 | 4.2 ± 0.2 | 2.6 ± 0.1 | |
| 200 | 2.1 ± 0.2 | 4.5 ± 0.2 | 2.7 ± 0.1 |
A closer look at the nodal displacements along the length of the top surface of 10 μm, 30 μm, and 50 μm thick gels can be found in Fig. 5. Here, it can be seen that the nodal displacement magnitudes for the models were highest in the FA area (indicated by the gray band) and were substantially larger and extended laterally much farther for the growth network model. Peak nodal displacement magnitudes increased with gel thickness for all models, with the most pronounced increases occurring for the growth network model. As a result, the effective stiffness was much lower for the growth model compared to the continuum model (Fig. 6(a)). The sensitivity of effective stiffness to substrate thickness was further assessed by normalizing effective stiffness to the effective stiffness values obtained at 10 μm (Fig. 6(b)). Although the effective stiffness in both models decreased with increasing substrate thickness, the growth network model was much more sensitive to changes in the gel thickness than the continuum model. The effective stiffness in the growth network model decreased 26% from 10 μm to 30 μm compared to a 15% decrease over the same range for the continuum model, 7% compared to 5% from 30 μm to 50 μm, and 7% compared to 0% from 50 μm to 200 μm, respectively.
Fig. 5.

Magnitude of displacement along the length of the FE domain for nodes at the top surface of (a) 10 μm, (b) 30 μm, and (c) 50 μm thick gels for the growth network, Delaunay network, and continuum models. Shaded regions indicate which FE nodes were associated with the focal adhesion area.
Fig. 6.
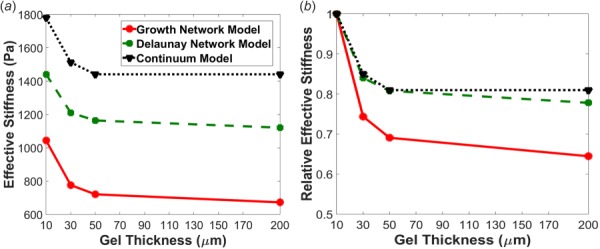
Comparison of (a) effective stiffness and (b) relative effective stiffness normalized to the 10 μm thick gel for each model. The plot of relative effective stiffness demonstrates that there was a larger change in stiffness with thickness in the growth network, indicating this type of network is more sensitive to mechanical transmission.
3.2. Comparison Between Growth Network and Delaunay Network Fiber Models.
The role of fiber network microstructure in the model was also assessed by comparing differences between growth network fiber and Delaunay network fiber models. Even though the shear response of the Delaunay network model closely followed the growth network model in approximating the experimental data, the model simulations produced noticeably different results in response to the applied cell traction force. The average principal stresses in the FA area (Table 2) were comparable to the growth network model (Figs. 3(b) and 4(b)), but mostly lower for the Delaunay network model, particularly as the thickness increased (Figs. 3(c) and 4(c)). The Delaunay network model average nodal displacements, however, were nearly 1.5 times lower (Table 2). In addition, the effective stiffness of the Delaunay network model was higher than the growth network model (Fig. 6(a)), but it showed less sensitivity to an increase in gel thickness and closely followed the normalized effective stiffness profile of the continuum model (Fig. 6(b)). Force propagation both laterally and into the depth of the gel was also much lower and less sensitive to an increase in gel thickness in the Delaunay network. An assessment of this was made by arbitrarily locating the vertical distance at which nodal displacements dropped below 0.9 μm. For the growth network model, this vertical distance was approximately 5.0 μm, 17.5 μm, and 30.0 μm away from the focal adhesion area for gel thicknesses of 10 μm, 30 μm, and 50 μm, respectively. This distance was much less extensive in the Delaunay network model, extending approximately 3.1 μm, 5.0 μm, and 5.0 μm for gel thicknesses of 10 μm, 30 μm, and 50 μm, respectively.
To further explore the basis for the greater sensitivity to substrate thickness observed in the growth network model, the accompanying changes in fiber microstructural reorganization in both fiber network models were also assessed. For both growth and Delaunay network models, networks that were initially nominally isotropic underwent a greater amount of realignment near where the traction forces were applied (i.e., the focal adhesion area) than networks farther away (Fig. 7). The fiber realignment () and the magnitude of the change in fiber alignment with respect to the initial network configuration in the unloaded state (Δα) also grew with increasing gel thickness and were much higher in the growth network model (see Supplemental Movies S1–S3, which are available under the “Supplemental Materials” tab for this paper on the ASME Digital Collection) than in the Delaunay network model (see Supplemental Movies S4–S6, which are available under the “Supplemental Materials” tab for this paper on the ASME Digital Collection). For example, if one considers the same block of 25 elements on the top surface and from the left surface to the outer edge of the cell for all thicknesses, the change in fiber alignment () was 0.35 ± 0.10, 0.39 ± 0.06, and 0.40 ± 0.08 in the growth network model and 0.32 ± 0.16, 0.35 ± 0.16, and 0.36 ± 0.14 in the Delaunay network model, for gel thicknesses of 10 μm, 30 μm, and 50 μm, respectively. The average strength of fiber alignment () also grew with increasing gel thickness and was higher in the growth network model, 0.50 ± 0.10, 0.53 ± 0.07, and 0.54 ± 0.07, than in the Delaunay network model, 0.41 ± 0.17, 0.44 ± 0.15, and 0.44 ± 0.14, for gel thicknesses of 10 μm, 30 μm, and 50 μm, respectively. This pattern of enhanced network reorganization with increasing gel thickness seems to have occurred because the increasing distance of the rigid lower boundary from the gel surface reduced the constraints on fiber rotational freedom, which in turn facilitated more fiber alignment and the lower effective stiffnesses observed in thicker gels. This effect was likely more prominent in the growth network model because of the lower degree of connectivity among the fibers in the network, which translated into less restrictions on fiber movement and greater displacements in the model compared to the more connected networks in the Delaunay network model. In addition, finite elements which had networks with a change in network fiber alignment of Δα > 0.1 were detected at vertical distances of approximately 10 μm, 30 μm, and 40 μm away from the focal adhesion area for gel thicknesses of 10 μm, 30 μm, and 50 μm, respectively. This propagation was again much less extensive in the Delaunay network model, extending only as far as approximately 10 μm regardless of gel thickness.
Fig. 7.

(a) Growth network model and (b) Delaunay network model fiber network realignments for 10 μm, 30 μm, and 50 μm thick gels in response to 6 nN of traction force. The color map indicates the change in the degree of fiber alignment () from the initial, nominally isotropic, traction-free configuration. Also, depicted is the principal direction of fiber alignment (white lines). For clarity, principal directions are only shown for those elements with > 0.1.
A detailed view of how two networks in the 10 μm thick growth network model reorganized in response to the cell traction force is depicted in Fig. 8. The first network (Fig. 8(a), Supplemental Movie S7 is available under the “Supplemental Materials” tab for this paper on the ASME Digital Collection), which was located outside the focal adhesion area underneath the inner region of the cell, gradually elongated in the vertical direction while compressing laterally and rotating slightly to the right to produce a small shearing motion. At the conclusion of the simulation (i.e., step 55), 75% of the fibers in this network were in tension (0.17 ± 0.32 nN) and 22% of the fibers were in compression (−0.16 ± 0.37 nN). Combined, these tensile and compressive forces corresponded to an average network fiber force of 0.10 ± 0.35 nN (maximum and minimum fiber forces of 2.01 nN and −2.14 nN, respectively). A second network (Fig. 8(b), Supplemental Movie S8 is available under the “Supplemental Materials” tab for this paper on the ASME Digital Collection), located directly under and inside the inner boundary of the focal adhesion area, experienced a much larger shearing motion with fibers aligning diagonally toward the direction of the applied force. At step 55, 78% of the fibers were in tension (0.42 ± 0.55 nN) and 21% were in compression (−0.22 ± 0.39 nN), which corresponded to an average fiber force of 0.28 ± 0.59 nN (maximum and minimum fiber forces of 2.57 nN and −2.57 nN, respectively).
Fig. 8.

Growth fiber network behavior at selected locations. The direction of fiber alignment is shown on the 10 μm case displacement field for > 0.1, the orange circles indicate the inner and outer boundaries of the focal adhesion area, and the lettered white circles indicate the locations of networks A and B shown below. Network organization, fiber forces, and fiber anisotropy index are shown for the initial, middle, and final steps of the simulation. Fiber force histograms are also shown for the middle and final step of the simulation.
Differences in Delaunay network reorganization were also evident. Changes in network shape and volume were slightly less pronounced, and a much higher fraction of fibers were in compression than tension. For example, 54% (Fig. 9(a), Supplemental Movie S9 is available under the “Supplemental Materials” tab for this paper on the ASME Digital Collection) and 49% (Fig. 9(b), Supplemental Movie S10 is available under the “Supplemental Materials” tab for this paper on the ASME Digital Collection) of the fibers in networks at equivalent locations as in the growth network model were in compression at step 55. As a result, the average fiber forces in the network were −0.05 ± 0.35 nN (maximum and minimum fiber forces of 0.88 nN and −0.81 nN, respectively) and 0.10 ± 0.60 nN (maximum and minimum fiber forces of 2.20 nN and −0.96 nN, respectively) for networks A and B, respectively. The change in the strength of fiber alignment () was lower midway through the simulation in the Delaunay network model than in the growth network model but became more comparable once the entire cell traction force was applied.
Fig. 9.

Delaunay fiber network behavior at selected locations. The direction of fiber alignment is shown on the 10 μm case displacement field for > 0.1, the orange circles indicate the inner and outer boundaries of the focal adhesion area, and the lettered white circles indicate the locations of networks A and B. Network organization, fiber forces, and fiber anisotropy index are shown for the initial, middle, and final steps of the simulation. Fiber force histograms are also shown for the middle and final step.
4. Discussion
In conducting this comprehensive comparison of model differences between nonlinear continuum and fiber-based FE models, we found that (1) the growth network model predicted much larger displacements both laterally and through the depth than the continuum model for the same amount of traction force due to the ability of the fibers to rotate and stretch, and that (2) the representation of the network was critically important, particularly with respect to fiber connectivity. The low fiber connectivity in the growth network model fostered greater fiber realignment and displacement propagation into the gel with a greater sensitivity to the gel thickness than in the highly connected Delaunay network model. The Delaunay network model exhibited reduced displacement propagation, fiber realignment, and thickness sensitivity such that these model predictions approached those of the nonlinear continuum model. These results highlight the importance of fiber connectivity and its role in extending the distance that mechanical information is transmitted from the boundaries, which could have implications for the design of engineered soft tissues and stem cell niches.
To facilitate model comparisons, the material parameters for all three models were selected so that the model response to shear matched a fibrin gel shear test. Even though this mode of shear deformation most closely resembled that of the applied cell traction force, other modes of deformation (as well as small differences in how each model matched the mechanical response) likely contributed to the differences in the mechanical responses observed among the models, particularly with respect to the non-normalized effective stiffness. Because the applied traction force and model geometry was equivalent in each model, the effective stiffness was only dependent on the inverse of the mean displacements in the FA area. These displacements were small in all models, but the differences were large enough that the non-normalized effective stiffness for the growth network model was much lower than for the other two models. These results, together with the larger displacement propagation distances in both the vertical and horizontal directions, indicate that the growth network model was locally “softer” than the other two models even though all three models have comparable bulk material properties in shear.
Because the effective stiffness values are based on relatively small displacements, the differences between models could also reflect how well each model fit the experimental shear data. To check for this possibility, we also chose to calculate metrics based on the sensitivity of each individual model to an increase in gel thickness. The normalized effective stiffness also indicates that the growth network model was much more sensitive to changes in gel thickness than the other two models (Fig. 6(b)). This increased sensitivity is reflected in the observation that there was still a small increase in the mean displacement in the FA area of 7.1% between the 50 μm and 200 μm gels for the growth network model, but there was only a 3.8% increase for the Delaunay network model and no change for the continuum model over the same span of gel thicknesses. This result can be interpreted to mean that the depth at which the rigid boundary still has some influence was much greater for the growth network model. We also calculated the critical gel thickness, hcrit, and saturation maximum displacement, uinf, for each model (Table 3) according to the equation used by us previously [14] and given per Sen et al. [21]: , where umax is the maximum surface displacement and h is the gel thickness. hcrit represents the gel thickness at which the maximum surface displacement reaches half of the value obtained for a gel of semi-infinite thickness, and uinf is the saturation displacement reached on a semi-infinite gel. Both uinf and hcrit were much higher for the growth networks, which also supports the notion that mechanical communication and depth sensitivity are enhanced in the growth networks.
Table 3.
Fit parameters for critical thickness, hcrit, and saturation maximum surface displacement, uinf, for each model
| Model | uinf (μm) | hcrit (μm) |
|---|---|---|
| Continuum | 2.27 | 1.66 |
| Delaunay network | 2.85 | 2.45 |
| Growth network | 4.82 | 5.39 |
The traction forces applied to the gel are shared between the gel and the rigid underlying substrate in a manner that is dependent on the thickness of the gel [22]. As the gels get thicker, a saturation thickness is reached at which the rigid substrate no longer has an influence on the mechanical response to the applied tractions, and all of the applied load is carried by the gel (i.e., the gel can be considered semi-infinite). We consider this saturation thickness as representative of the cell's maximum possible depth sensing distance for a given traction force. The introduction of fibers into the model extended this distance compared to a nonlinear continuum model, particularly with respect to the growth networks, which due to their low degree of fiber connectivity, had fibers with greater rotational freedom. As the distance of the rigid lower boundary increased, the fibers in the networks experienced greater realignment toward the lower boundary compared to the more connected (and therefore more constrained) fibers in the Delaunay network model. This had the twofold effect of making the growth network model appear softer locally and of extending the depth of fiber realignment and force propagation.
The results from this study support the growing body of experimental and theoretical work that indicates that the fibrous nature of biological gels is responsible for enhanced long-distance cell mechanosensing compared to nonfibrous gels [14–17,30,46–48]. Several of these theoretical studies have found that the mechanosensing length scale of a cell increases when fibers are accounted for in the model [14,30,46,48]. For example, Ma et al. developed an image-based 2D FE model of two cells separated by a distance of ∼100 μm and surrounded by a network of linear elastic collagen fibers embedded in a soft nonfibrous material with mechanical properties selected from the literature [46]. This model also found that forces were only transmitted long distances from one contracting cell to the other when the fibers were explicitly accounted for due to improved force transmission along aligned fibers. If the surrounding material was represented instead by a homogeneous nonlinear strain-hardening material, then the stresses rapidly decayed a short distance away from the cells and no mechanical communication occurred between the two cells. Another key property of the networks that facilitates fiber alignment and the transmission of long-range mechanical signals is the low compressive resistance of the fibers (relative to the tensile stiffness), which Notbohm et al. also reported and referred to as microbuckling [30]. In this context, microbuckling does not refer to a mechanism of failure, but instead means that less energy is needed for fibers in the network to compress in order to accommodate the realignment of other network fibers in tension. In our simulations, even with microbuckling, a highly connected network, such as the Delaunay network, exhibited reduced depth sensing compared to a network with low connectivity (i.e., growth network) because the ability of fibers to rotate and realign was reduced. Thus, from our point of view, those network properties that facilitate fiber reorientation (i.e., low fiber connectivity, microbuckling, and rotational freedom at the crosslinks) work together to enhance long-range force transmission.
The mechanics of fiber networks are dependent on a number of network properties, such as the density of fibers and crosslinks, the distribution of fiber lengths and fiber orientations, the fiber connectivity (number of fibers connecting at a crosslink), and the nature of the crosslinks (e.g., a freely rotating ball joint or a fixed joint). Exploration of all of these complex relationships was beyond the scope of this study and is reviewed elsewhere [49,50]. Instead, we chose to limit our analysis to two fundamentally different types of networks that primarily differ in the number of fibers connected by a crosslink (i.e., connectivity), and that we believe are reasonable idealizations of network structure one might find for substrates used in mechanobiological studies. We have used the less connected growth network to successfully represent the low fiber connectivity typically found in dilute collagen and fibrin gels [37,51–53]. The more highly connected Delaunay networks represent a shift up the connectivity spectrum toward the limiting case of a fully connected and continuous material. In addition, the Delaunay networks are likely more representative of synthetic polymers and other highly crosslinked hydrogels that resemble cellular solids [54] and that could be used as cell substrates either for mechanobiological studies or regenerative medicine applications. Thus, both types of networks should be useful for understanding in vitro experimental findings on cell responses on different materials.
Finally, the results from these simulations should be considered with respect to the assumptions of the model. We chose for simplicity to use a one-element wide, rectangular FE geometry with symmetry boundary conditions on the front and back faces because this configuration allows us to carefully investigate how model predictions change when fundamentally different types of models are used. This geometry is particularly useful for examining the 3D network reorganization occurring in the different models because it reduces additional input from lateral network reorganization that would occur if adjacent elements were present through the width. While not accurate in representing the shape and traction distribution of a particular cell, models that employ simplifying assumptions are still able to provide important insights on potential mechanisms by which cells sense and respond to mechanical cues in their environment. In addition, cell tractions were simulated as a constant force equally distributed among the nodes of the focal adhesion area. However, cells likely adjust the tractions they exert on the substrate as part of a feedback loop in order to achieve some set point of baseline tension, displacement, or energy. Such mechanisms have been included in other modeling schemes [48,55], and future work will seek to incorporate such cell feedback into this model.
In conclusion, traction forces produce a greater propagation of displacements through growth networks than through more connected Delaunay networks and continuum models. Rotational freedom of the fibers in an extracellular matrix network with low fiber connectivity appears to be critical for the enhanced, long-range mechanosensing observed experimentally for cells cultured on fibrous gels. These results aid our understanding of cell–cell communication within sparse tissues and have implications for the design of engineered soft tissue replacements.
Supplementary Material
Acknowledgment
This work was supported in part by the National Institutes of Health (R03-AR063967), the National Science Foundation (National Science Foundation CAREER CMMI 1452728), and the Carver Charitable Trust (#14-4384). Computational Resources were provided by the University of Iowa ITS Helium Cluster.
Contributor Information
Maziar Aghvami, Department of Biomedical Engineering, , University of Iowa, , Iowa City, IA 52242.
Kristen L. Billiar, Department of Biomedical Engineering, , Worcester Polytechnic Institute, , Worcester, MA 01609
Edward A. Sander, Department of Biomedical Engineering, , University of Iowa, , Iowa City, IA 52242 , e-mail: edward-sander@uiowa.edu.
References
- [1]. Yip, C. Y. Y. , Chen, J. H. , Zhao, R. G. , and Simmons, C. A. , 2009, “ Calcification by Valve Interstitial Cells is Regulated by the Stiffness of the Extracellular Matrix,” Arterioscler., Thromb., Vasc. Biol., 29(6), pp. 936–942. 10.1161/ATVBAHA.108.182394 [DOI] [PubMed] [Google Scholar]
- [2]. Saha, K. , Keung, A. J. , Irwin, E. F. , Li, Y. , Little, L. , Schaffer, D. V. , and Healy, K. E. , 2008, “ Substrate Modulus Directs Neural Stem Cell Behavior,” Biophys. J., 95(9), pp. 4426–4438. 10.1529/biophysj.108.132217 [DOI] [PMC free article] [PubMed] [Google Scholar]
- [3]. Discher, D. E. , Janmey, P. , and Wang, Y. L. , 2005, “ Tissue Cells Feel and Respond to the Stiffness of Their Substrate,” Science, 310(5751), pp. 1139–1143. 10.1126/science.1116995 [DOI] [PubMed] [Google Scholar]
- [4]. Lutolf, M. P. , Gilbert, P. M. , and Blau, H. M. , 2009, “ Designing Materials to Direct Stem-Cell Fate,” Nature, 462(7272), pp. 433–441. 10.1038/nature08602 [DOI] [PMC free article] [PubMed] [Google Scholar]
- [5]. Reilly, G. C. , and Engler, A. J. , 2010, “ Intrinsic Extracellular Matrix Properties Regulate Stem Cell Differentiation,” J. Biomech., 43(1), pp. 55–62. 10.1016/j.jbiomech.2009.09.009 [DOI] [PubMed] [Google Scholar]
- [6]. Lo, C.-M. , Wang, H.-B. , Dembo, M. , and Wang, Y.-l. , 2000, “ Cell Movement Is Guided by the Rigidity of the Substrate,” Biophys. J., 79(1), pp. 144–152. 10.1016/S0006-3495(00)76279-5 [DOI] [PMC free article] [PubMed] [Google Scholar]
- [7]. Provenzano, P. P. , and Keely, P. J. , 2011, “ Mechanical Signaling Through the Cytoskeleton Regulates Cell Proliferation by Coordinated Focal Adhesion and Rho GTPase Signaling,” J. Cell Sci., 124(Pt. 8), pp. 1195–1205. 10.1242/jcs.067009 [DOI] [PMC free article] [PubMed] [Google Scholar]
- [8]. Engler, A. J. , Sen, S. , Sweeney, H. L. , and Discher, D. E. , 2006, “ Matrix Elasticity Directs Stem Cell Lineage Specification,” Cell, 126(4), pp. 677–689. 10.1016/j.cell.2006.06.044 [DOI] [PubMed] [Google Scholar]
- [9]. Guilak, F. , Butler, D. L. , Goldstein, S. A. , and Baaijens, F. P. , 2014, “ Biomechanics and Mechanobiology in Functional Tissue Engineering,” J. Biomech., 47(9), pp. 1933–1940. 10.1016/j.jbiomech.2014.04.019 [DOI] [PMC free article] [PubMed] [Google Scholar]
- [10]. De Jesus, A. M. , Aghvami, M. , and Sander, E. A. , 2016, “ A Combined In Vitro Imaging and Multi-Scale Modeling System for Studying the Role of Cell Matrix Interactions in Cutaneous Wound Healing,” PloS One, 11(2), p. e0148254. 10.1371/journal.pone.0148254 [DOI] [PMC free article] [PubMed] [Google Scholar]
- [11]. Pelham, R. J., Jr. , and Wang, Y. , 1997, “ Cell Locomotion and Focal Adhesions Are Regulated by Substrate Flexibility,” Proc. Natl. Acad. Sci. U.S.A., 94(25), pp. 13661–13665. 10.1073/pnas.94.25.13661 [DOI] [PMC free article] [PubMed] [Google Scholar]
- [12]. Zarkoob, H. , Bodduluri, S. , Ponnaluri, S. V. , Selby, J. C. , and Sander, E. A. , 2015, “ Substrate Stiffness Affects Human Keratinocyte Colony Formation,” Cell. Mol. Bioeng., 8(1), pp. 32–50. 10.1007/s12195-015-0377-8 [DOI] [PMC free article] [PubMed] [Google Scholar]
- [13]. Evans, N. D. , Minelli, C. , Gentleman, E. , LaPointe, V. , Patankar, S. N. , Kallivretaki, M. , Chen, X. , Roberts, C. J. , and Stevens, M. M. , 2009, “ Substrate Stiffness Affects Early Differentiation Events in Embryonic Stem Cells,” Eur. Cells Mater., 18, pp. 1–13.http://www.ecmjournal.org/journal/papers/vol018/vol018a01.php [DOI] [PubMed] [Google Scholar]
- [14]. Rudnicki, M. S. , Cirka, H. A. , Aghvami, M. , Sander, E. A. , Wen, Q. , and Billiar, K. L. , 2013, “ Nonlinear Strain Stiffening is Not Sufficient to Explain How Far Cells Can Feel on Fibrous Protein Gels,” Biophys. J., 105(1), pp. 11–20. 10.1016/j.bpj.2013.05.032 [DOI] [PMC free article] [PubMed] [Google Scholar]
- [15]. Winer, J. P. , Oake, S. , and Janmey, P. A. , 2009, “ Non-Linear Elasticity of Extracellular Matrices Enables Contractile Cells to Communicate Local Position and Orientation,” PLoS One, 4(7), p. e6382. 10.1371/journal.pone.0006382 [DOI] [PMC free article] [PubMed] [Google Scholar]
- [16]. Leong, W. S. , Tay, C. Y. , Yu, H. , Li, A. , Wu, S. C. , Duc, D. H. , Lim, C. T. , and Tan, L. P. , 2010, “ Thickness Sensing of hMSCs on Collagen Gel Directs Stem Cell Fate,” Biochem. Biophys. Res. Commun., 401(2), pp. 287–292. 10.1016/j.bbrc.2010.09.052 [DOI] [PubMed] [Google Scholar]
- [17]. Ali, M. Y. , Chuang, C. Y. , and Saif, M. T. , 2014, “ Reprogramming Cellular Phenotype by Soft Collagen Gels,” Soft Matter, 10(44), pp. 8829–8837. 10.1039/C4SM01602E [DOI] [PMC free article] [PubMed] [Google Scholar]
- [18]. Breuls, R. G. , Sengers, B. G. , Oomens, C. W. , Bouten, C. V. , and Baaijens, F. P. , 2002, “ Predicting Local Cell Deformations in Engineered Tissue Constructs: A Multilevel Finite Element Approach,” ASME J. Biomech. Eng., 124(2), pp. 198–207. 10.1115/1.1449492 [DOI] [PubMed] [Google Scholar]
- [19]. Guilak, F. , and Mow, V. C. , 2000, “ The Mechanical Environment of the Chondrocyte: A Biphasic Finite Element Model of Cell–Matrix Interactions in Articular Cartilage,” J. Biomech., 33(12), pp. 1663–1673. 10.1016/S0021-9290(00)00105-6 [DOI] [PubMed] [Google Scholar]
- [20]. Stops, A. J. , McMahon, L. A. , O'Mahoney, D. , Prendergast, P. J. , and McHugh, P. E. , 2008, “ A Finite Element Prediction of Strain on Cells in a Highly Porous Collagen-Glycosaminoglycan Scaffold,” ASME J. Biomech. Eng., 130(6), p. 061001. 10.1115/1.2979873 [DOI] [PubMed] [Google Scholar]
- [21]. Sen, S. , Engler, A. J. , and Discher, D. E. , 2009, “ Matrix Strains Induced by Cells: Computing How Far Cells Can Feel,” Cell. Mol. Bioeng., 2(1), pp. 39–48. 10.1007/s12195-009-0052-z [DOI] [PMC free article] [PubMed] [Google Scholar]
- [22]. Mehrotra, S. , Hunley, S. C. , Pawelec, K. M. , Zhang, L. X. , Lee, I. , Baek, S. , and Chan, C. , 2010, “ Cell Adhesive Behavior on Thin Polyelectrolyte Multilayers: Cells Attempt to Achieve Homeostasis of Its Adhesion Energy,” Langmuir, 26(15), pp. 12794–12802. 10.1021/la101689z [DOI] [PMC free article] [PubMed] [Google Scholar]
- [23]. Maloney, J. M. , Walton, E. B. , Bruce, C. M. , and Van Vliet, K. J. , 2008, “ Influence of Finite Thickness and Stiffness on Cellular Adhesion-Induced Deformation of Compliant Substrata,” Phys. Rev. E, 78(4 Pt. 1), p. 041923. 10.1103/PhysRevE.78.041923 [DOI] [PubMed] [Google Scholar]
- [24]. Zielinski, R. , Mihai, C. , Kniss, D. , and Ghadiali, S. N. , 2013, “ Finite Element Analysis of Traction Force Microscopy: Influence of Cell Mechanics, Adhesion, and Morphology,” ASME J. Biomech. Eng., 135(7), p. 071009. 10.1115/1.4024467 [DOI] [PMC free article] [PubMed] [Google Scholar]
- [25]. Lin, Y.-C. , Tambe, D. T. , Park, C. Y. , Wasserman, M. R. , Trepat, X. , Krishnan, R. , Lenormand, G. , Fredberg, J. J. , and Butler, J. P. , 2010, “ Mechanosensing of Substrate Thickness,” Phys. Rev. E, 82(4), p. 041918. 10.1103/PhysRevE.82.041918 [DOI] [PMC free article] [PubMed] [Google Scholar]
- [26]. del Álamo, J. C. , Meili, R. , Álvarez-González, B. , Alonso-Latorre, B. , Bastounis, E. , Firtel, R. , and Lasheras, J. C. , 2013, “ Three-Dimensional Quantification of Cellular Traction Forces and Mechanosensing of Thin Substrata by Fourier Traction Force Microscopy,” PloS One, 8(9), p. e69850. 10.1371/journal.pone.0069850 [DOI] [PMC free article] [PubMed] [Google Scholar]
- [27]. Aghvami, M. , Rudnicki, M. S. , Cirka, H. A. , Zarkoob, H. , Billiar, K. L. , and Sander, E. A. , 2013, “ Non-Affine Fiber Network Model Predicts Longe-Range Stress Propagation Through Fibrous Gels,” Biomedical Engineering Society Annual Fall Meeting, Seattle, WA. [Google Scholar]
- [28]. Vanni, S. , Lagerholm, B. C. , Otey, C. , Taylor, D. L. , and Lanni, F. , 2003, “ Internet-Based Image Analysis Quantifies Contractile Behavior of Individual Fibroblasts Inside Model Tissue,” Biophys. J., 84(4), pp. 2715–2727. 10.1016/S0006-3495(03)75077-2 [DOI] [PMC free article] [PubMed] [Google Scholar]
- [29]. Aghvami, M. , Barocas, V . H. , and Sander, E. A. , 2013, “ Multiscale Mechanical Simulations of Cell Compacted Collagen Gels,” ASME J. Biomech. Eng., 135(7), p. 071004. 10.1115/1.4024460 [DOI] [PMC free article] [PubMed] [Google Scholar]
- [30]. Notbohm, J. , Lesman, A. , Rosakis, P. , Tirrell, D. A. , and Ravichandran, G. , 2015, “ Microbuckling of Fibrin Provides a Mechanism for Cell Mechanosensing,” J. R. Soc., Interface, 12(108), p. 20150320. 10.1098/rsif.2015.0320 [DOI] [PMC free article] [PubMed] [Google Scholar]
- [31]. Abhilash, A. S. , Baker, B. M. , Trappmann, B. , Chen, C. S. , and Shenoy, V. B. , 2014, “ Remodeling of Fibrous Extracellular Matrices by Contractile Cells: Predictions From Discrete Fiber Network Simulations,” Biophys. J., 107(8), pp. 1829–1840. 10.1016/j.bpj.2014.08.029 [DOI] [PMC free article] [PubMed] [Google Scholar]
- [32]. Reinhardt, J. W. , Krakauer, D. A. , and Gooch, K. J. , 2013, “ Complex Matrix Remodeling and Durotaxis Can Emerge From Simple Rules for Cell–Matrix Interaction in Agent-Based Models,” ASME J. Biomech. Eng., 135(7), p. 071003. 10.1115/1.4024463 [DOI] [PMC free article] [PubMed] [Google Scholar]
- [33]. Wen, Q. , and Janmey, P. A. , 2011, “ Polymer Physics of the Cytoskeleton,” Curr. Opin. Solid State Mater. Sci., 15(5), pp. 177–182. 10.1016/j.cossms.2011.05.002 [DOI] [PMC free article] [PubMed] [Google Scholar]
- [34]. Munevar, S. , Wang, Y. , and Dembo, M. , 2001, “ Traction Force Microscopy of Migrating Normal and H-ras Transformed 3T3 Fibroblasts,” Biophys. J., 80(4), pp. 1744–1757. 10.1016/S0006-3495(01)76145-0 [DOI] [PMC free article] [PubMed] [Google Scholar]
- [35]. Yang, Z. , Lin, J. S. , Chen, J. , and Wang, J. H. , 2006, “ Determining Substrate Displacement and Cell Traction Fields—A New Approach,” J. Theor. Biol., 242(3), pp. 607–616. 10.1016/j.jtbi.2006.05.005 [DOI] [PubMed] [Google Scholar]
- [36]. Yeoh, O. H. , 1993, “ Some Forms of the Strain-Energy Function for Rubber,” Rubber Chem. Technol., 66(5), pp. 754–771. 10.5254/1.3538343 [DOI] [Google Scholar]
- [37]. Stylianopoulos, T. , and Barocas, V. H. , 2007, “ Volume-Averaging Theory for the Study of the Mechanics of Collagen Networks,” Comput. Methods Appl. Mech. Eng., 196(31–32), pp. 2981–2990. 10.1016/j.cma.2006.06.019 [DOI] [Google Scholar]
- [38]. Sander, E. A. , and Barocas, V. H. , 2009, “ Comparison of 2D Fiber Network Orientation Measurement Methods,” J. Biomed. Mater. Res., Part A, 88(2), pp. 322–331. 10.1002/jbm.a.31847 [DOI] [PubMed] [Google Scholar]
- [39]. Sander, E. A. , Stylianopoulos, T. , Tranquillo, R. T. , and Barocas, V. H. , 2009, “ Image-Based Biomechanics of Collagen-Based Tissue Equivalents,” IEEE Eng. Med. Biol. Mag., 28(3), pp. 10–18. 10.1109/MEMB.2009.932486 [DOI] [PMC free article] [PubMed] [Google Scholar]
- [40]. Stylianopoulos, T. , Bashur, C. A. , Goldstein, A. S. , Guelcher, S. A. , and Barocas, V. H. , 2008, “ Computational Predictions of the Tensile Properties of Electrospun Fibre Meshes: Effect of Fibre Diameter and Fibre Orientation,” J. Mech. Behav. Biomed. Mater., 1(4), pp. 326–335. 10.1016/j.jmbbm.2008.01.003 [DOI] [PMC free article] [PubMed] [Google Scholar]
- [41]. Stylianopoulos, T. , and Barocas, V. H. , 2007, “ Multiscale, Structure-Based Modeling for the Elastic Mechanical Behavior of Arterial Walls,” ASME J. Biomech. Eng., 129(4), pp. 611–618. 10.1115/1.2746387 [DOI] [PubMed] [Google Scholar]
- [42]. Hadi, M. F. , Sander, E. A. , and Barocas, V. H. , 2012, “ Multiscale Model Predicts Tissue-Level Failure From Collagen Fiber-Level Damage,” ASME J. Biomech. Eng., 134(9), p. 091005. 10.1115/1.4007097 [DOI] [PMC free article] [PubMed] [Google Scholar]
- [43]. Billiar, K. L. , and Sacks, M. S. , 2000, “ Biaxial Mechanical Properties of the Native and Glutaraldehyde-Treated Aortic Valve Cusp: Part II—A Structural Constitutive Model,” ASME J. Biomech. Eng., 122(4), pp. 327–335. 10.1115/1.1287158 [DOI] [PubMed] [Google Scholar]
- [44]. Bonet, J. , and Wood, R. , 1997, Nonlinear Continuum Mechanics for Finite Element Analysis, Cambridge University Press, Cambridge, UK. [Google Scholar]
- [45]. Chandran, P. L. , and Barocas, V. H. , 2006, “ Affine Versus Non-Affine Fibril Kinematics in Collagen Networks: Theoretical Studies of Network Behavior,” ASME J. Biomech. Eng., 128(2), pp. 259–270. 10.1115/1.2165699 [DOI] [PubMed] [Google Scholar]
- [46]. Ma, X. , Schickel, M. E. , Stevenson, M. D. , Sarang-Sieminski, A. L. , Gooch, K. J. , Ghadiali, S. N. , and Hart, R. T. , 2013, “ Fibers in the Extracellular Matrix Enable Long-Range Stress Transmission Between Cells,” Biophys. J., 104(7), pp. 1410–1418. 10.1016/j.bpj.2013.02.017 [DOI] [PMC free article] [PubMed] [Google Scholar]
- [47]. Mohammadi, H. , Arora, P. D. , Simmons, C. A. , Janmey, P. A. , and McCulloch, C. A. , 2015, “ Inelastic Behaviour of Collagen Networks in Cell–Matrix Interactions and Mechanosensation,” J. R. Soc., Interface, 12(102), p. 20141074. 10.1098/rsif.2014.1074 [DOI] [PMC free article] [PubMed] [Google Scholar]
- [48]. Wang, H. , Abhilash, A. S. , Chen, C. S. , Wells, R. G. , and Shenoy, V. B. , 2014, “ Long-Range Force Transmission in Fibrous Matrices Enabled by Tension-Driven Alignment of Fibers,” Biophys. J., 107(11), pp. 2592–2603. 10.1016/j.bpj.2014.09.044 [DOI] [PMC free article] [PubMed] [Google Scholar]
- [49]. Picu, R. C. , 2011, “ Mechanics of Random Fiber Networks—A Review,” Soft Matter, 7(15), pp. 6768–6785. 10.1039/c1sm05022b [DOI] [Google Scholar]
- [50]. Sander, E. , Stein, A. , Swickrath, M. , and Barocas, V. , 2010, “ Out of Many, One: Modeling Schemes for Biopolymer and Biofibril Networks,” Trends in Computational Nanomechanics, Springer, The Netherlands, pp. 557–602. 10.1007/978-1-4020-9785-0_19 [DOI] [Google Scholar]
- [51]. Chandran, P. L. , and Barocas, V. H. , 2007, “ Deterministic Material-Based Averaging Theory Model of Collagen Gel Micromechanics,” ASME J. Biomech. Eng., 129(2), pp. 137–147. 10.1115/1.2472369 [DOI] [PubMed] [Google Scholar]
- [52]. Sander, E. A. , Stylianopoulos, T. , Tranquillo, R. T. , and Barocas, V. H. , 2009, “ Image-Based Multiscale Modeling Predicts Tissue-Level and Network-Level Fiber Reorganization in Stretched Cell-Compacted Collagen Gels,” Proc. Natl. Acad. Sci. U.S.A., 106(42), pp. 17675–17680. 10.1073/pnas.0903716106 [DOI] [PMC free article] [PubMed] [Google Scholar]
- [53]. Hadi, M. F. , Sander, E. A. , Ruberti, J. W. , and Barocas, V. H. , 2012, “ Simulated Remodeling of Loaded Collagen Networks Via Strain-Dependent Enzymatic Degradation and Constant-Rate Fiber Growth,” Mech. Mater., 44, pp. 72–82. 10.1016/j.mechmat.2011.07.003 [DOI] [PMC free article] [PubMed] [Google Scholar]
- [54]. Gibson, L. J. , 2005, “ Biomechanics of Cellular Solids,” J. Biomech., 38(3), pp. 377–399. 10.1016/j.jbiomech.2004.09.027 [DOI] [PubMed] [Google Scholar]
- [55]. Deshpande, V. S. , McMeeking, R. M. , and Evans, A. G. , 2006, “ A Bio-Chemo-Mechanical Model for Cell Contractility,” Proc. Natl. Acad. Sci. U.S.A., 103(38), pp. 14015–14020. 10.1073/pnas.0605837103 [DOI] [PMC free article] [PubMed] [Google Scholar]
Associated Data
This section collects any data citations, data availability statements, or supplementary materials included in this article.