Abstract
Purpose
To develop and compare with classical ROI-based approach, a fully-automatic, local and unbiased way of studying the knee T1ρ relaxation time by creating an atlas and using Voxel Based Relaxometry (VBR) in OA and ACL subjects
Materials and Methods
In this study 110 subjects from 2 cohorts: (i) Mild OA 40 patients with mild-OA KL ≤ 2 and 15 controls KL ≤ 1; (ii) ACL cohort (a model for early OA): 40 ACL-injured patients imaged prior to ACL reconstruction and 1-year post-surgery and 15 controls are analyzed. All the subjects were acquired at 3T with a protocol that includes: 3D-FSE (CUBE) and 3D-T1ρ. A Non-rigid registration technique was applied to align all the images on a single template. This allows for performing VBR to assess local statistical differences of T1ρ values using z-score analysis. VBR results are compared with those obtained with classical ROI-based technique
Results
ROI-based results from atlas-based segmentation were consistent with classical ROI-based method (CV = 3.83%). Voxel-based group analysis revealed local patterns that were overlooked by ROI-based approach; e.g. VBR showed posterior lateral femur and posterior lateral tibia significant T1ρ elevations in ACL injured patients (sample mean z-score=9.7 and 10.3). Those elevations were overlooked by the classical ROI-based approach (sample mean z-score =1.87, and −1.73)
Conclusion
VBR is a feasible and accurate tool for the local evaluation of the biochemical composition of knee articular cartilage. VBR is capable of detecting specific local patterns on T1ρ maps in OA and ACL subjects
Keywords: T1ρ, knee cartilage, Voxel Based Relaxometry, Atlas-based segmentation, ACL, Osteoarthritis
1. INTRODUCTION
Osteoarthritis (OA) is a heterogeneous and multifactorial disease characterized primarily by the progressive loss of hyaline articular cartilage [1,2].
Anterior cruciate ligament (ACL) has been shown to be risk factor for the development of post traumatic osteoarthritis in young and active population [3–6]
Despite the fact that the main diagnostic imaging tool for OA remains conventional radiography, there is ample evidence that molecular and biochemical changes take place in the joint tissue in OA and ACL-injured knees [7,8], before radiographic change is visible. Recent advances in magnetic resonance (MR) imaging, including T1ρ and T2 relaxation time quantification, allow for the characterization of articular cartilage biochemical composition [9–12]. Previous studies have also shown that T1ρ may be used to detect early degeneration within one and two years after ACL reconstruction [13,14]. MRI quantitative assessment of relaxation time maps reflecting degenerative changes in the knee are usually accomplished using region of interest (ROI)-based approaches [9,15]. In this class of techniques, compartments of the cartilage are segmented, and each ROI is described by the average of the T1ρ and T2 values. Articular cartilage segmentation is often performed manually or semi-automatically, which introduces user variation and utilizes extensive human resources and time. Recently, several automatic techniques have been proposed for the knee articular cartilage segmentation including: statistical-based [16,17] active shape model-based [18,19], texture-based [20] and atlas-based [21] methods.
Previous studies have also shown that spatially assessing knee cartilage relaxation time maps using laminar and texture analyses could lead to better and probably earlier identification of cartilage matrix abnormalities [22]. While sub-compartmental, laminar and texture analysis could help in increasing specificity and sensitivity of this technique, studying the local spatial distribution of the T1ρ and T2 values in different group of patients remains a challenge [23,24].
Thus, the two challenges are the automatic segmentation of articular cartilage and a method to evaluate the cartilage regions of interest for all subjects using a single template, so comparative regions maybe compared across subjects, at different time points. Voxel Based Relaxometry is a technique based on the alignment of all the subjects on a single reference space. VBR was previously adopted to perform both groups and single subject analysis of T2 relaxation time changes in patients with epilepsy. [25,26]. These studies showed how VBR is consistent with ROI-based analysis providing additional information about the local distribution of the T2 values. Due to the thin shape of the cartilage and to the relative low resolution of the T1ρ≤ MRI images, the application of this technique in the analysis of the knee articular cartilage is still a medical imaging challenge.
Our hypothesis is that VBR is a feasible method for the fully automatic analysis of local patterns of T1ρ spatial distribution and the assessment of local cartilage composition differences between two cohorts, or at different time points in the same cohort. The aim of this work is to develop a fully automatic, local and unbiased way of studying the knee relaxation times by creating an atlas of the knee, and using Voxel Based Relaxometry (VBR),
2. METHODS
Subjects
MR images from two different cohorts, collected for previous ongoing longitudinal studies, are considered in this study. An OA cohort that includes 40 mild osteoarthritic patients (age = 54.3 ± 8.06 years, BMI = 24.05 ± 2.52 kg/m2 Kellgren–Lawrence (KL) score: <= 2) and 15 matched age controls (age = 47.6 ± 10.3 years, BMI = 25.39 ± 3.1 kg/m2 Kellgren–Lawrence (KL) score<=1). An ACL cohort includes 40 patients with unilateral ACL tears imaged within 1–33 weeks after injury prior to surgical reconstruction (baseline) (average = 8.4 ± 6.4 weeks) and 1-year after reconstruction (age = 29.55 ± 8.07 years, BMI = 23.53 ± 2.52 kg/m2) and 15 controls with no history of knee injuries underwent MR imaging at baseline and 12 months later (age = 31.7 ± 4.6 years, BMI = 23.7 ± 4.8 kg/m2); The overall dataset consisted of 165 images: 40 OA and 15 control; 40 baseline ACL, 15 baseline controls, 40 1 year ACL and 15 1 year controls. All subjects gave informed consent, and the study was approved by and carried out in accordance with the rules and regulations of the Committee for Human Research at our institution both OA and ACL studies were IRB approved.
MRI Image Protocol
All imaging was done using a 3T MRI scanner (GE Healthcare, Milwaukee, WI, USA) with an 8-channel phased array knee coil (Invivo Inc, Orlando, FL, USA). The sequences included were: (1) Sagittal intermediate-weighted, fluid sensitive, fat-saturated three-dimensional (3D) fast spin-echo (CUBE) images [repetition time (TR)/echo time (TE) = 1500/25 ms, field of view (FOV) = 16 cm, matrix = 384 x 384, slice thickness = 1 mm, echo train length = 50, bandwidth = 50 kHz, number of excitations = 0.5] Scan time 8.54 min; (2) Sagittal combine 3D T1ρ/T2 imaging sequences obtained using a previously developed 3D sequence [27], Just T1ρ data are used in this study. The acquisition parameters were: TR/TE = 9/2.6 ms, FOV = 14 cm, matrix = 256 x 128, slice thickness = 4 mm, Views Per Segment = 64, time of recovery = 1.2 s, spin-lock frequency = 500 Hz, ARC phase AF = 2, time of spin lock (TSL) = 0/10/40/80 ms for the ACL cohort Scan time 8.18 min and TSL = 0/2/4/8/12/20/40/80 ms for the OA cohort scan time 8.32 min.
Image Processing
All post processing was performed using a program written in MATLAB (Mathworks, Natick, MA) integrated with the elastix toolbox for the non-rigid image registration [28,29].
The overall procedure included the following steps:
Reference identification
Semi-automatic articular cartilage segmentation in the reference image
Non-rigid morphing
Voxel-by-voxel fitting of morphed T1ρ -weighted maps
All images in both datasets (ACL and OA cohort) were downsampled to a matrix = [50x50x10] and iteratively morphed to the space of a reference randomly chosen in the dataset. B-spline transformation was used for the morphing and Advance Mattes Mutual Information image similarity metric was used as a figure of merit of the transformation to be optimized. This process was iterated, selecting each of the 165 instances in the dataset as a candidate reference. The best reference was then chosen as the sample that minimizes the average deformation of the overall dataset: Minimal Deformation Template (MDL).
The local deformation of each case was assessed with the analysis of the Jacobian determinant (J), which is an indicator for the volumetric change at the voxel level. The reference that ensured absence of local volume vanishing in the cartilage region (J < 0), minimized the local volume contraction (J < 1) and expansion (J > 0) was chosen. A single representative reference was selected instead of constructing an average atlas [30]. This guaranteed high reliability in the semi-automatic identification of the articular cartilage border in the reference image. An atlas generated by averaging images over a number of subjects would not be as reliable due to image gradients smoothing.
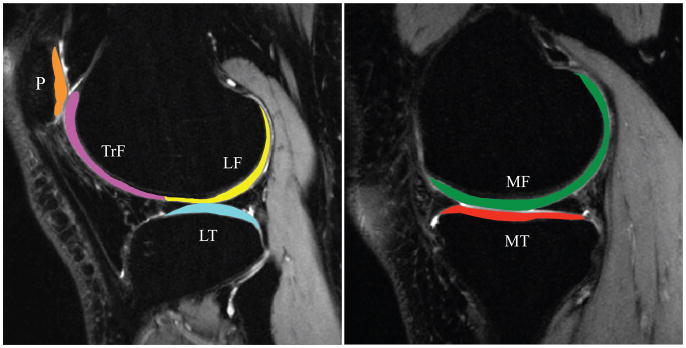
The reference case sagittal high-resolution CUBE images were rigidly registered with the first TSL = 0 T1ρ -weighted image using the VTK CISG registration Toolkit and used for cartilage segmentation. Six cartilage compartments consisting of the medial femoral condyle (MF), medial tibia (MT), lateral femoral condyle (LF), lateral tibia (LT), femoral trochlea (TrF) and patella (P) were segmented semi-automatically using a method based on edge detection and Bezier splines (Figure 1) [31].
Figure 1.
Knee cartilage compartments
Non-rigid registration was developed using elastix. Five level recursive pyramidal multi-resolution with random sampler approach was used to estimate the non-rigid transformation between fixed and moving image. For the initialization step, both fixed and moving image were cropped in a fixed window size of 200 x 200 x 20 with the centroid lying in the columns mean, slices mean and in the maximum of the vertical MIP’s line of profile that corresponds with the tibiofemoral cartilage interface. This phase corrects any large inconsistencies in the MR image prescription during acquisition and cuts image areas acquired at the edge of the knee coil characterized by poor signal-to-noise ratio.
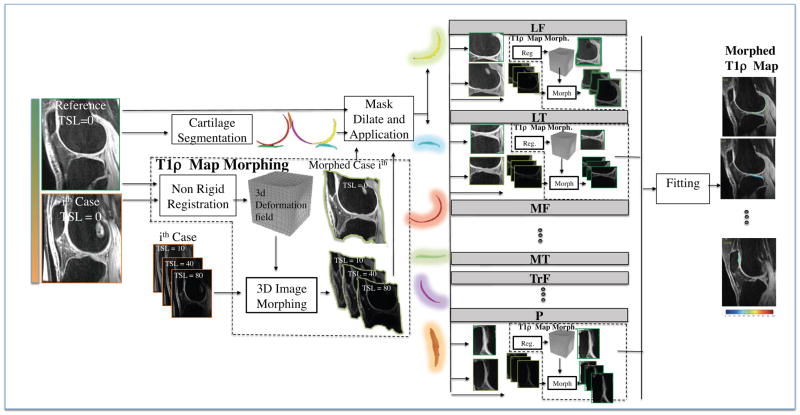
The non-rigid registration technique was applied between the reference and each of the 165 cases first TSL = 0 T1ρ -weighted image. The transformation field obtained is then applied on all the later TSL images (Figure 2). Despite the high registration performance globally obtained after this first phase, the particular shape of the cartilage requires a high level of precision, such that small errors could compromise the matching of the cartilage regions of interest (ROIs). However, the performance of this phase were enough to define a ROI around each cartilage compartment on the fixed image, and the application of this ROI on the registered image guaranteed that the same anatomical area would be compared. Six ROIs were considered based on the cartilage compartments semi-automatically segmented on the reference image to which are applied a 2D dilatation with a fixed 20 pixel structural element. The masks generated were used to constrain the image area to be considered in the registration process for both the fixed image and the output of the first non-rigid registration phase. The technique was iterated for all the six cartilage compartments.
Figure 2.
Schematic representation of the non-rigid registration strategy.
T1ρ maps were obtained by fitting the morphed T1ρ -weighted images obtained with different TSLs using a Levenberg-Marquardt mono-exponential (S(TSL) ∝ exp(−TSL/ T1ρ)) applied on each voxel[32,9]. The reference ROIs were applied on the morphed maps, setting in this way for a fully automatic single atlas-based segmentation that allows for the application of the classical ROI-based technique. All the maps were visually checked to ensure the morphing does not alter the local spatial distribution of the T1ρ values.
Automatic ROI-based Method
The first set of experiments was aimed to evaluate the performance of the registration algorithm that accomplishes automatic segmentation of articular cartilage. The cartilage was semi-automatically segmented and quantified on both the original and the morphed maps according to the ROI-based methods described in previous studies [9,15]. The most posterior and anterior points of each ROI segmented on the original images, were considered as control landmarks. These landmarks are transformed according to the deformation field computed through the non-rigid registration procedure. The distance between the reference and the transformed landmarks for all 165 morphed cases were considered as a metric of the registration’s performance.
The average T1ρ values computed from the fully automatic segmentations on the morphed maps were compared to the values obtained from the semi-automatic segmentations for each case on the original maps. This analysis was performed both for the ACL and mild OA subjects.
The semiautomatic segmentation was performed by 2 users (FS and NC) with 4 and 2 years of experience in cartilage image analysis. Both the users were trained under the supervision of experienced musculoskeletal radiologists. The procedure for semiautomatic segmentation was evaluated in previous studies reporting processing/reprocessing inter-observer ICC and RMS-CV of the sub-compartment T1ρ quantification equal to 0.961 and 3.9%, respectively [33] and scan/rescan RMS-CV of the T1ρ quantification in compartment equal to o 3.1% [34].
The procedure for the VBR, being fully automatic and deterministic, is completely repeatable in processing/reprocessing of the same dataset. The scan/rescan repeatability of the both automatic and semi automatic segmentation procedure were assessed on the same dataset of six healthy volunteers.
Automatic ROI-based Method Statistical Analysis
Automatic and semi-automatic ROI-based results are compared in terms of group mean and standard deviation, average of each case’s coefficient of variation (CV), absolute T1ρ differences (ms) and linear Pearson correlation coefficients. Paired t-test was calculated between the automatic and semi-automatic results to check for the presence of any drift introduced by the map morphing. Scan/Rescan variably was computed using average CVs.
Voxel based Relaxometry Statistical Analysis
The second set of experiments aimed to show the application of group VBR and single subject VBR.
All the morphed maps in the different datasets were analyzed to extract local first- and second-order statistical indexes for each voxel (mean, min, max and standard deviation) in the baseline and 1-year ACL, Mild OA and controls groups. Group differences were locally analyzed using sample mean z-score statistical parametric maps (SPMs) [35,36]. Z-score SPMs were computed as follows:
where (x, y, z) denotes the coordinates of the voxel. Mean {ACLb, ACL1y, OA} are the averages of T1ρ values across ACL baseline, ACL 1-year and mild-OA subjects, respectively. Mean and SD {ACLcontrol, OAcontrol} are the averages of T1ρ values across the control subjects matched in gender, age and BMI with the ACL and OA-mild groups. NACL and NOA are the sample sizes. Group VBR results were compared with those obtained from applying the classical semi-automatic ROI-based method.
All the morphed maps were then converted to single sample z-score (SPMs), and each map was characterized using specific features previously used as a similarity retrieval tool for brain fMRI parametric maps [37]. Those features were proposed for identifying similar patterns between brain SPMs, with the aim of the classification of patients in groups for which the outcome was already known. They describe information about the location, extension, clusterization, z-score differences and standard deviation of the areas with elevated T1ρ values.
In each cartilage SPM, all the voxels with z-score greater then zero are considered as active volume of interests (aVOI) and each aVOI is described by 9 features including: position of the aVOI centroid [Xc, Yc, Zc]:mean and standard deviation distances of all the active voxels from the centroid [Dm, Ds], volume [V] computed as number of active voxels, number of connected regions [Nc], and mean and standard deviation of the z-score values [M,S]. Each cartilage compartment is individually described. Paired t-test were used to study longitudinal differences between baseline and 1-year features vectors in the ACL dataset and unpaired t-test were used to assess group differences between ACL and mild OA subjects. Significant threshold was consider at p<0.05.
3. RESULTS
Fully Automatic ROI-based T1ρ Evaluation
The qualitative assessment of the morphed map did not show major alterations of the local spatial distribution of the T1ρ values that can be potentially introduced by registration errors or interpolation issues.
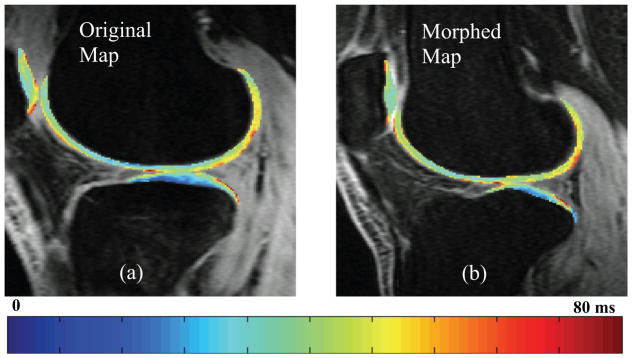
The comparison between original and morphed T1ρ map of one representative patient from the ACL baseline dataset is shown (Figure 3). This example shows similar T1ρ spatial distribution in the two maps and accurate preservation the original map’s local features.
Figure 3.
Comparison between (a) an original T1ρ map and (b) a morphed T1ρ map in the lateral compartment of a representative patient from the ACL baseline group
The mean distance of the landmark control points was 0.67 ± 0.47 mm, and 0.78 ± 0.59 mm for the ACL (baseline and 1 year f/u) and mild OA group respectively.
Automatic and semi-automatic T1ρ ROI-based quantification results are significantly correlated and no significant drift are generally shown. The differences in the group means were 0.93% and 1.97% for the ACL (baseline) and mild OA, respectively. Average CVs over the six compartments and 40 patients were 3.81% and 3.91% for the ACL (baseline) and mild OA groups, respectively. Only the ACL LF compartment shows a significant overestimation of the T1ρ values in the morphed map (p-value = 0.04). Slightly lower but still in a good scale the performances observed in MT and P compartments (Table 1). No significant differences in the algorithm performances were observed between baseline and 1 year ACL subjects (1 year average CV = 3.78%).
Table 1.
| Evaluation Metrics | ACL Patients, N=40 (Mean, SD) | Mild OA Patient, N=40 (Mean, SD) | |
|---|---|---|---|
| MF | ROI T1ρ Mean: Semi Auto Seg. | (38.70, 2.45) | (43.39, 3.57) |
| ROI Morphed T1ρ≤ mean: Automatic | (38.10, 2.74) | (42.26, 3.69) | |
| Coefficients of Variation | (2.46%, 3.16%) | (3.33%, 2.34%) | |
| Absolute Differences (ms) | (1.31, 1.62) | (1.98, 1.38) | |
| Auto vs Manual t-test | Not Significant:≤α=0.32 | Not Significant: α=0.17 | |
| Auto vs Manual Pearson Corr. (R, p-value) | (0.70, <0.000) | (0.82, <0.000) | |
| LF | ROI T1ρ Mean: Semi Auto Seg. | (38.83, 2.28) | (40.71, 3.23) |
| ROI Morphed T1ρ≤ mean: Automatic | (40.17, 3.22) | (41.18, 3.17) | |
| Coefficients of Variation | (3.31%, 2.65%) | (3.31%, 2.65%) | |
| Absolute Differences (ms) | (1.87, 1.56) | (1.87, 1.56) | |
| Auto vs Manual t-test | Significant: α=0.04 | Not Significant: α=0.13 | |
| Auto vs Manual Pearson Corr. (R, p-value) | (0.77, <0.000) | (0.81, <0.000) | |
| MT | ROI T1ρ Mean: Semi Auto Seg. | (34.98, 2.72) | (35.59, 4.18) |
| ROI Morphed T1ρ≤ mean: Automatic | (34.79, 4.17) | (37.03, 4.76) | |
| Coefficients of Variation | (4.07%, 3.04%) | (4.60%, 3.44%) | |
| Absolute Differences (ms) | (1.98, 1.44) | (2.33, 1.85) | |
| Auto vs Manual t-test | Not Significant: α=0.8 | Not Significant: α=0.15 | |
| Auto vs Manual Pearson Corr. (R, p-value) | (0.86, <0.000) | (0.83, <0.000) | |
| LT | ROI T1ρ Mean: Semi Auto Seg. | (34.16, 2.68) | (34.7, 3.99) |
| ROI Morphed T1ρ≤ mean: Automatic | (34.34, 2.46) | (35.66, 3.72) | |
| Coefficients of Variation | (3.53%, 3.53%) | (3.9%, 2.9%) | |
| Absolute Differences (ms) | (1.69, 1.64) | (1.98, 1.43) | |
| Auto vs Manual t-test | Not Significant:≤α=0.76 | Not Significant: α=0.27 | |
| Auto vs Manual Pearson Corr. (R, p-value) | (0.60, <0.000) | (0.83, <0.000) | |
| P | ROI T1ρ Mean: Semi Auto Seg. | (38.43, 3.10) | (43.11, 5.77) |
| ROI Morphed T1ρ≤ mean: Automatic | (38.69, 4.71) | (43.82, 4.52) | |
| Coefficients of Variation | (6.63%, 5.06%) | (5.09%, 3.97%) | |
| Absolute Differences (ms) | (3.63, 2.76) | (3.56, 2.40) | |
| Auto vs Manual t-test | Not Significant: α=0.77 | Not Significant: α=0.55 | |
| Auto vs Manual Pearson Corr. (R, p-value) | (0.37, 0.018) | (0.72, <0.000) | |
| TrF | ROI T1ρ Mean: Semi Auto Seg. | (40.28, 2.70) | (41.82, 2.81) |
| ROI Morphed T1ρ≤ mean: Automatic | (40.06, 3.43) | (41.10, 3.44) | |
| Coefficients of Variation | (2.83%, 2.21%) | (3.21%, 2.12%) | |
| Absolute Differences (ms) | (1.61, 1.22) | (1.86, 1.28) | |
| Auto vs Manual t-test | Not Significant: α=0.76 | Not Significant: α=0.3 | |
| Auto vs Manual Pearson Corr. (R, p-value) | (0.80, <0.000) | (0.77, <0.000) |
Scan/rescan repeatability average CVs compute on six healthy volunteers were 2.76% and 2.38% for semi automatic and fully segmentation respectively.
VBR Groups Analysis
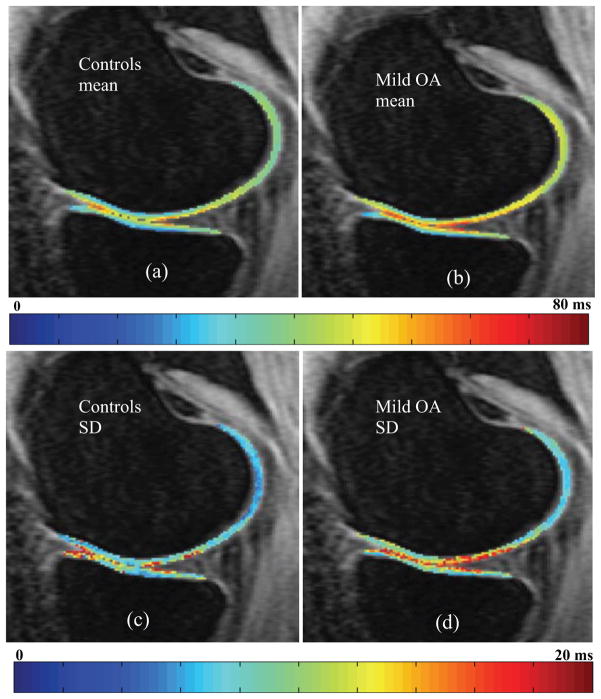
The voxel-based T1ρ mean maps show values in the expected range for both ACL baseline, ACL 1-year and mild OA subjects with a global average of 40.69, 40.75 and 42.01 ms, respectively. It is also worth noting that the group mean maps retain the laminar appearance showing lower T1ρ values in the cartilage closest to the subchondral bone compared to the superficial layer, despite the averaging among subjects. The preservation of this feature is an evidence of the precision of the registration strategy estimated through the control points to be on the order of 0.72 mm (1.33 times the in plane pixel and 0.18 times the slice thickness). Higher standard deviation is observed in the OA subjects than in the controls (Figure 4).
Figure 4.
Control and mild OA voxel-based (a, b) mean and (c, d) standard deviation (SD) maps
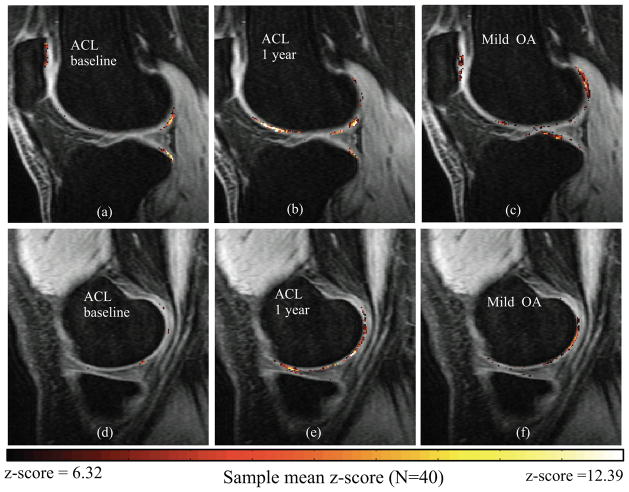
The analysis of the sample mean z-score maps shows significant elevation in posterolateral femur and posterolateral tibia in the ACL subjects [Figure 5(a)]. Subtle local elevations are observed in the medial side [Figure 5(d)]. At 1-year, the posterolateral femur and posterolateral tibia had significantly elevated z-scores [Figure 5(b)]. There were also significant increases in 1-year z-scores in the femoral trochlea and medial femoral condyle [Figure 5(e)]. A different pattern is observed in the lateral side of mild OA subjects, showing subtle but diffuse elevation in more central portion of posterolateral tibia and posterolateral femur [Figure 5(c)]. However, similar spatial distribution is observed in the medial side, particularly in the posterior aspect of the medial femoral condyle, between 1-year ACL and mild OA subjects [Figure 5(e) and 5(f)].
Figure 5.
z-score maps for the local analysis of T1ρ group differences: first row lateral compartment second row medial compartment. (a, d) ACL baseline, (b, e) ACL 1 year, (c, f) Mild OA.
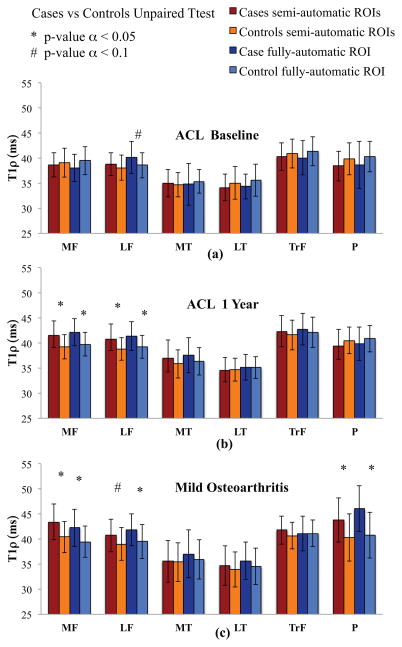
When the same dataset is analyzed with the classical ROIs-based method, no differences are observed at baseline between T1ρ averages in ACL subject and controls in any of the six compartments [Figure 6(a)]. By dividing the cartilage into sub-compartments using the anterior and posterior horns of the menisci as anatomical landmarks, significant differences are observed in posterolateral tibia and posterolateral femur consistently on what observed applying VBR [(Figure 5(a)]. Significant differences are observed at 1-year time point between ACL and control subjects in both MF and LF compartments [Figure 6(b)]. The femoral trochlea was slightly elevated compared to controls, albeit this finding was not significant, while significant T1ρ increase is observed with VBR [(Figure 5(b)]. Patients with mild OA had significantly higher T1ρ in the MF and P than that of controls. T1ρ values were higher in LF and TrF compartments of patients with mild OA compared to control subjects, but this finding was not significant. ROIs computed with semi automatic segmentation and fully automatic segmentation method show generally consistent results in the case-control comparison. Few the differences observed. LF for the baseline ACL patients is nearly to be significant different from controls p=0.09 in the automatic ROIs and not different in the semi automatic ROIs p=0.30. 1 year ACL patient’s analysis showed totally consistent results between the 2 methods. For the Mild OA patients LFC is nearly to be significant p=0.09 and MFC is significant p=0.006 for the semi automatic method. The differences resulted both significant using the automatic ROIs method.
Figure 6.
Results of the semi-automatic and fully automatic ROI-based methods for the cartilage compartment analysis of T1ρ group differences: (a) ACL baseline, (b) ACL 1 year, (c) Mild OA.
Single Subject VBR Analysis
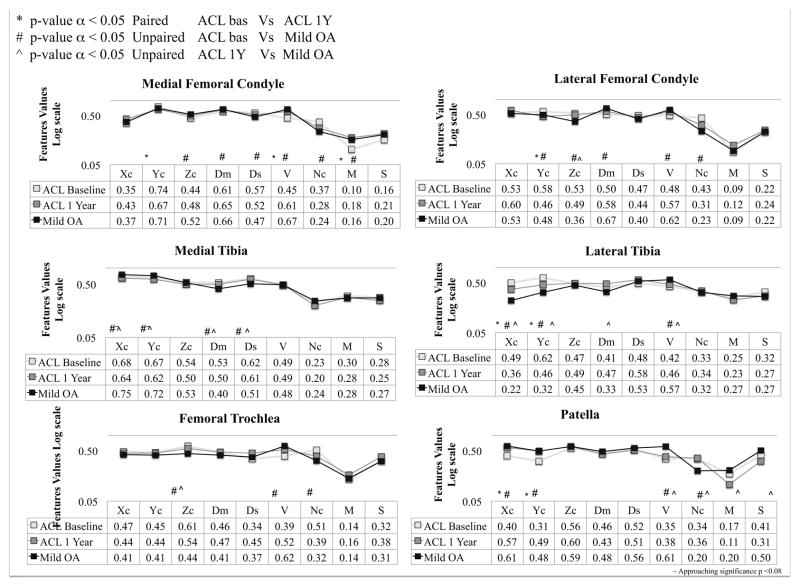
Figure 7 shows the results of the single subject VBR analysis and how to use the proposed technique to explore similarities and differences in the z-score spatial distribution between groups both cross-sectionally and longitudinally. ACL subjects show a significant longitudinal change in aVOI centroid’s position volume and z-score mean in MF. In addition to the trend in z-score mean, several features including Ds, V and Nc show a trend towards the Mild OA spatial distribution pattern from baseline to 1 year in the ACL subject in addition to the trend in the z-score mean, which is the only feature detectable using the classical ROI-based method. The differences in the centroid location (Yc) in LT and LFC compartments quantify the more posteriorly located elevation in the lateral compartment of baseline ACL subjects. It is worth noting a trend towards the OA location in the 1 year ACL subjects for this features. Interestingly in both of these compartments, no significant difference was observed in the z-score mean features, showing the sensitivity of the proposed method to features that can be potentially overlooked using just the classic ROI-based approach.
Figure 7.
Single subject VBR features analysis: comparison between mild OA and ACL subjects
Subtle trends are observed in MT with a decrease of Dm and Ds in OA subjects with respect the ACL subjects, showing more focused aVOI in mild OA patient compared with the more scattered elevations observed in ACL patient in both time points. No differences are observed in the z-score mean feature in the MT, which is consistent with the ROI-based method.
Differences in volume and number of connected regions are observed in the TrF compartment between baseline ACL and mild OA; both the indexes show a trend towards the mild OA values from baseline to 1-year in the ACL subjects. The aVOI’s TrF centroid is more laterally shifted in the ACL patinets in both time points with respect to the OA patients. In the patella, significant differences were observed in volume and number of connected regions between OA and ACL subjects in both time points. There was a decrease in the mean z-score in the patella between baseline to 1 year in ACL group. However, the location of the elevation shows a trend toward the mild OA pattern between baseline to 1-year in ACL subject.
4. Discussion
In the current study, we present a new fully automatic method for MR T1ρ relaxation time quantification to assess the biochemical composition of the cartilage matrix at each voxel in the knee. The method includes an atlas-based fully automatic cartilage segmentation, which allows this technique to be used even for performing the classical ROI-based approach without any human intervention. A CV of 3.85% and an absolute difference of 2.13 ms are observed between semi-automatic and fully automatic method for the ROI-based T1ρ quantification. Furthermore, the mean T1ρ of semi-automatic [9,15] and automatic ROIs are strongly correlated, and the automatic algorithm did not introduce any drift in the values. Moreover, the atlas based fully automatic segmentation proposed in this study showed an optimal Scan/Rescan repeatability 2.38%, even slightly better then the one obtained by the semiautomatic method 2.78%. This is probably due to the intra-rater variation that affects the semi automatic method but not the fully automatic one. Particularly sensitive to human error is the choice of the number and location of slices to be segmented. Slices located at the border of the cartilage are be badly effected by partial volume effect making difficult for the operator to decide the exact location of the edge. These findings suggest that the method presented in this study is reliable and repeatable.
A comparable atlas-based method for locally analyzing knee cartilage previously done by Carbadillo at el [38] used high-resolution images (three-dimensional double-echo steady-statel with water excitation: 3D DESS-WE) to perform the inter-subject registration task and a second step of intra-subject registration between T2 and DESS and resampling of the map, introducing a possible source of variability. In contrast, the atlas-based approach proposed in this study robustly and effectively solves the registration task directly using the relatively low resolution and highly anisotropic T1ρ -weighted images without the need of an high resolution anatomical image, which is often not available in clinical protocols. The prior study demonstrated the atlas-based approach in the patella only, we have extended the methodology to the knee joint overall, and demonstrated its’ applicability in a larger sample size. We have also done the statistical analysis for both group and single subject VBR for patients with mild OA, and longitudinally over a one year period for ACL-injured subjects after the surgical reconstruction.
Group VBR showed consistent results with ROI-based approach, but was more sensitive to the differences in the global compartment than the ROI-based method. Only by dividing the cartilage ROIs into sub-compartments can the ROI-based method reach similar sensitivity as described in Li et al. [13]. VBR results presented in this study are generally consistent with those obtained in [13] with the great advantage to be computed in a fully automatic fashion.
Moreover, the boundaries used in the a priori division of cartilage into sub-compartments or layers, has been widely debated in literature without consensus [39,9,15]. Even if a consensus in the use of specific anatomical landmarks would be reached; the manual identification of those landmarks would be affected by intra- and inter- rater variation. Additionally, the position of the knee during the MRI acquisition could affect the sub-compartment division, with the chance of analyzing different cartilage locations in the different patients or longitudinally. Non-rigid image registration and VBR allow for overcoming all this limitation.
Single subject VBR reveals a novel way of approaching the T1ρ quantification. This technique can characterize the T1ρ map of each patient and consider aspects that could be overlooked in the classical ROI-based method. For instance, the volume of the elevations, spatial sparsity, position of the aVOI in ACL-injured patients from baseline to 1-year were becoming more similar to mild OA patients.
Furthermore, by converting the patient morphed maps to z-scores, the maps become invariant to the inhomogeneities observed in the control groups caused by local properties of the tissue or technical limitations, such as magic angle effects.
Our experiments show several features of the ACL subjects z-score patterns move towards the mild OA spatial distribution, most of these findings would have been overlooked if using the classical ROI-based method.
Despite the promising results, there are several limitations of this study, including the relatively small sample size and the analysis of just one relaxation parameter.
Increasing the sample size opens the possibility to not only design the features for the analysis of the single subject VBR but also apply deep learning algorithms to exploit latent patterns in the data and describe more complex properties without deciding a priori the indices to be evaluated, such as mean, standard deviation and texture features. The combined use of T1ρ and T2 relaxation times and the local analysis of the correlation between the two could also potentially add more information to the analysis.
In conclusion, VBR is a feasible and accurate tool for the local evaluation of the biochemical composition of knee articular cartilage. The analysis in the current study show that VBR can be used both for the assessment of group differences and for the characterization of the single subject spatial distributions of T1ρ. Moreover, the fully automatic post-processing pipeline makes VBR an attractive way for the translation of the T1ρ relaxation time quantification in the clinical environment where the extensive usage of human resources for manual or semiautomatic cartilage segmentation is not feasible.
Acknowledgments
Grant Support: This study was supported by NIH/NIAMS P50 AR060752 and R01AR046905
References
- 1.Hawamdeh Ziad M, Al-Ajlouni Jihad M. The Clinical Pattern of Knee Osteoarthritis in Jordan: A Hospital Based Study. Int J Med Sci. 2013;10(6):790–795. doi: 10.7150/ijms.5140. [DOI] [PMC free article] [PubMed] [Google Scholar]
- 2.Woolf AD, Pfleger B. Burden of major musculoskeletal conditions. Bull World Health Organ. 2003;81(9):646–56. [PMC free article] [PubMed] [Google Scholar]
- 3.Fu F, Bennett C, Ma C, Menetrey J, Lattermann C. Current trends in anterior cruciate ligament reconstruction. Part II. Operative procedures and clinical correlations. Am J Sports Med. 2000;28:124–130. doi: 10.1177/03635465000280010801. [DOI] [PubMed] [Google Scholar]
- 4.Lohmander L, Englund P, Dahl L, Roos E. The long term consequence of anterior cruciate ligament and meniscus injuries: osteoarthritis. Am J Sports Med. 2007;35:1756–1769. doi: 10.1177/0363546507307396. [DOI] [PubMed] [Google Scholar]
- 5.Roos H, Adalberth T, Dahlberg L, Lohmander LS. Osteoarthritis of the knee after injury to the anterior cruciate ligament or meniscus: the influence of time and age. Osteoarthritis Cartilage. 1995;3:261–267. doi: 10.1016/s1063-4584(05)80017-2. [DOI] [PubMed] [Google Scholar]
- 6.Lohmander LS, Ostenberg A, Englund M, Roos H. High prevalence of knee osteoarthritis, pain, and functional limitations in female soccer players twelve years after anterior cruciate ligament injury. Arthritis Rheum. 2004 Oct;50(10):3145–52. doi: 10.1002/art.20589. [DOI] [PubMed] [Google Scholar]
- 7.Lohmander L, Ionescu M, Jugessur H, Poole A. Changes in joint cartilage aggrecan after knee injury and in osteoarthritis. Arthritis Rheum. 1999;42:534–544. doi: 10.1002/1529-0131(199904)42:3<534::AID-ANR19>3.0.CO;2-J. [DOI] [PubMed] [Google Scholar]
- 8.Price J, Till S, Bickerstaff D, Bayliss M, Hollander A. Degradation of cartilage type II collagen precedes the onset of osteoarthritis following anterior cruciate ligament rupture. Arthritis Rheum. 1999;42:2390–2398. doi: 10.1002/1529-0131(199911)42:11<2390::AID-ANR18>3.0.CO;2-9. [DOI] [PubMed] [Google Scholar]
- 9.Li X, Ma C, Link T, et al. In vivo T1ρ and T2 mapping of articular cartilage in osteoarthritis of the knee using 3 Tesla MRI. Osteoarthritis and Cartilage. 2007;15:789–797. doi: 10.1016/j.joca.2007.01.011. [DOI] [PMC free article] [PubMed] [Google Scholar]
- 10.Mosher TJ, Dardzinski BJ, Smith MB. Human articular cartilage: influence of aging and early symptomatic degeneration on the spatial variation of T2--preliminary findings at 3 T. Radiology. 2000;214:259–266. doi: 10.1148/radiology.214.1.r00ja15259. [DOI] [PubMed] [Google Scholar]
- 11.Dunn TC, Lu Y, Jin H, Ries MD, Majumdar S. T2 relaxation time of cartilage at MR imaging: comparison with severity of knee osteoarthritis. Radiology. 2004;232:592–598. doi: 10.1148/radiol.2322030976. [DOI] [PMC free article] [PubMed] [Google Scholar]
- 12.Regatte R, Akella S, Lonner J, Kneeland J, Reddy R. T1ρ relaxation mapping in human osteoarthritis (OA) cartilage: comparison of T1ρ with T2. J Magn Reson Imaging. 2006;23:547–553. doi: 10.1002/jmri.20536. [DOI] [PubMed] [Google Scholar]
- 13.Li Xiaojuan, Kou Daniel, Theologis Alexander, Carballido-Gamio Julio, Stehling Christoph, Link Thomas M, et al. Cartilage in Anterior Cruciate Ligament–Reconstructed Knees: MR Imaging T1ρ and T2—Initial Experience with 1-year Follow-up. Radiology. 2011 Feb;258(2):505–514. doi: 10.1148/radiol.10101006. [DOI] [PMC free article] [PubMed] [Google Scholar]
- 14.Su Favian, Hilton Joan F, Nardo Lorenzo, Wu Samuel, Liang Fei, et al. Cartilage Morphology and T1ρ and T2 Quantification in ACL-reconstructed Knees: A 2-year Follow-up. Osteoarthritis Cartilage. 2013 Aug;21(8):1058–1067. doi: 10.1016/j.joca.2013.05.010. [DOI] [PMC free article] [PubMed] [Google Scholar]
- 15.Souza RB, Kumar D, Calixto N, Singh J, Schooler J, Subburaj K, Li X, et al. Response of knee cartilage T1ρ and T2 relaxation times to in vivo mechanical loading in individuals with and without knee osteoarthritis. Osteoarthritis and Cartilage. Special Themed Issue - Imaging in Osteoarthritis. 2014 Oct;22(10):1367–1376. doi: 10.1016/j.joca.2014.04.017. [DOI] [PMC free article] [PubMed] [Google Scholar]
- 16.Folkesson J, Dam EB, Olsen OF, Pettersen PC, Christiansen C. Segmenting articular cartilage automatically using a voxel classification approach. IEEE Trans Med Imag. 2007;26:106–115. doi: 10.1109/TMI.2006.886808. [DOI] [PubMed] [Google Scholar]
- 17.Zhang K, Lu W. Automatic human knee cartilage segmentation from multi- contrast mr images using extreme learning machines and discriminative random fields. MLMI’11 Proceedings of the Second International Conference on Machine Learning in Medical Imaging; 2011. pp. 335–343. [Google Scholar]
- 18.Fripp J, Crozier S, Warfield SK, Ourselin S. Automatic Segmentation and Quantitative Analysis of the Articular Cartilages from Magnetic Resonance Images of the Knee. IEEE Trans Med Imaging 2010. 2010 Jan;29(1):55–64. doi: 10.1109/TMI.2009.2024743. [DOI] [PMC free article] [PubMed] [Google Scholar]
- 19.Vincent G, Wolstenholme C, Scott I, Bowes M. Fully automatic segmentation of the knee joint using active appearance models. Med Image Anal Clin: A Grand Challenge. 2010:24–230. [Google Scholar]
- 20.Dodin P, Pelletier JP, Martel-Pelletier J, Abram F. Automatic human knee cartilage segmentation from 3-d magnetic resonance images. IEEE Trans Biomed Eng. 2010;57:2699–2711. doi: 10.1109/TBME.2010.2058112. [DOI] [PubMed] [Google Scholar]
- 21.Shan Liang, Zach Christopher, Charles Cecil, Niethammer Marc. Automatic atlas-based three-label cartilage segmentation from MR knee images. Medical Image Analysis. 2014 Oct;18(7):1233–124. doi: 10.1016/j.media.2014.05.008. [DOI] [PMC free article] [PubMed] [Google Scholar]
- 22.Carballido-Gamio J Stahl R, Blumenkrantz G, Romero A, Majumdar S, Link TM. Spatial analysis of magnetic resonance T1ρ and T2 relaxation times improves classification between subjects with and without osteoarthritis. Med Phys. 2009 Sep;36(9):4059–67. doi: 10.1118/1.3187228. [DOI] [PMC free article] [PubMed] [Google Scholar]
- 23.Li X, Pai A, Blumenkrantz G, Carballido-Gamio J, Link T, Ma B, Ries M, Majumdar S. Spatial distribution and relationship of T1ρ and T2 relaxation times in knee cartilage with osteoarthritis. Magn Reson Med. 2009;61(6):1310–8. doi: 10.1002/mrm.21877. [DOI] [PMC free article] [PubMed] [Google Scholar]
- 24.Joseph GB, Baum T, Carballido-Gamio J, Nardo L, Virayavanich W, Alizai H, Lynch JA, McCulloch CE, Majumdar S, Link TM. Texture analysis of cartilage T2 maps: individuals with risk factors for OA have higher and more heterogeneous knee cartilage MR T2 compared to normal controls-data from the osteoarthritis initiative. Arthritis Res Ther. 2011;13(5) doi: 10.1186/ar3469. [DOI] [PMC free article] [PubMed] [Google Scholar]
- 25.Pell Gaby S, Briellmann Regula S, Waites Anthony B, Abbott David F, Jackson Graeme D. Voxel-based relaxometry: a new approach for analysis of T2 relaxometry changes in epilepsy. NeuroImage. 2004;21(2):707–713. 1053–8119. doi: 10.1016/j.neuroimage.2003.09.059. [DOI] [PubMed] [Google Scholar]
- 26.Kosior RK, Sharkey R, Frayne R, Federico P. Voxel-based relaxometry for cases of an unresolved epilepsy diagnosis. Epilepsy Res. 2012 Mar;99(1–2):46–54. doi: 10.1016/j.eplepsyres.2011.10.015. [DOI] [PubMed] [Google Scholar]
- 27.Li X, Wyatt C, Rivoire J, Han E, Chen W, Schooler J, Liang F, Shet K, Souza R, Majumdar S. Simultaneous acquisition of T1ρ and T2 quantification in knee cartilage: repeatability and diurnal variation. J Magn Reson Imaging. 2014;39(5):1287–93. doi: 10.1002/jmri.24253. [DOI] [PMC free article] [PubMed] [Google Scholar]
- 28.Klein S, Staring M, Murphy K, Viergever MA, Pluim JPW. elastix: a toolbox for intensity based medical image registration. IEEE Transactions on Medical Imaging. 2010 Jan;29(1):196–205. doi: 10.1109/TMI.2009.2035616. [DOI] [PubMed] [Google Scholar]
- 29.Shamonin DP, Bron EE, Lelieveldt BPF, Smits M, Klein S, Staring M. Fast Parallel Image Registration on CPU and GPU for Diagnostic Classification of Alzheimer’s Disease. Frontiers in Neuroinformatics. 7(50):1–15. doi: 10.3389/fninf.2013.00050. [DOI] [PMC free article] [PubMed] [Google Scholar]
- 30.Joshi S, Davis B, Jomier M, Gerig G. Unbiased diffeomorphic atlas construction for computational anatomy. Neuroimage. 2004;23(Suppl 1):S151–60. doi: 10.1016/j.neuroimage.2004.07.068. [DOI] [PubMed] [Google Scholar]
- 31.Carballido-Gamio J, Bauer JS, Stahl R, Lee KY, Krause S, Link TM, et al. Inter-subject comparison of MRI knee cartilage thickness. Med Image Anal. 2008;12:120–135. doi: 10.1016/j.media.2007.08.002. [DOI] [PMC free article] [PubMed] [Google Scholar]
- 32.Marquardt D. An Algorithm for Least-Squares Estimation of Nonlinear Parameters. Journal of the Society for Industrial and Applied Mathematics. 1963;11(2):431–441. [Google Scholar]
- 33.Gupta R, Virayavanich W, Kuo D, Su F, Link T, Ma B, Li X. MR T(1)ρ quantification of cartilage focal lesions in acutely injured knees: correlation with arthroscopic evaluation. Magn Reson Imaging. 2014;32(10):1290–6. doi: 10.1016/j.mri.2014.07.015. [DOI] [PMC free article] [PubMed] [Google Scholar]
- 34.Li X, Pedoia V, Kumar D, Rivoire J, Wyatt C, Lansdown D, Amano K, Okazaki N, Savic D, Koff MF, Felmlee J, Williams SL, Majumdar S. Cartilage T1ρ and T2 relaxation times: longitudinal reproducibility and variations using different coils, MR systems and sites. Osteoarthritis Cartilage. 2015 doi: 10.1016/j.joca.2015.07.006. [DOI] [PMC free article] [PubMed] [Google Scholar]
- 35.Smith MM, Weaver KE, Grabowski TJ, Rao RP, Darvas F. Non-invasive detection of high gamma band activity during motor imagery. Front Hum Neurosci. 2014;16(8):817. doi: 10.3389/fnhum.2014.00817. [DOI] [PMC free article] [PubMed] [Google Scholar]
- 36.Peller M, Zeuner KE, Munchau A, Quartarone A, Weiss M, Knutzen A, Hallett M, Deuschl G, Siebner HR. The basal ganglia are hyperactive during the discrimination of tactile stimuli in writer’s cramp. Brain. 2006 Oct;129(Pt 10):2697–708. doi: 10.1093/brain/awl181. [DOI] [PubMed] [Google Scholar]
- 37.Tungaraza Rosalia, Guan Jinyan, Shapiro Linda, Brinkley James, Ojemann Jeffrey, Franklin Joshua. A similarity retrieval method for functional magnetic resonance imaging statistical maps. International Journal of Biomedical Data Mining. 2013;2 [Google Scholar]
- 38.Carballido-Gamio J, Majumdar S. Atlas-based knee cartilage assessment. Magn Reson Med. 2011 Aug;66(2):574–83. doi: 10.1002/mrm.22836. [DOI] [PMC free article] [PubMed] [Google Scholar]
- 39.Matzat SJ, McWalter EJ, Kogan F, Chen W, Gold GE. T2 Relaxation time quantitation differs between pulse sequences in articular cartilage. J Magn Reson Imaging. 2015 Jul;42(1):105–13. doi: 10.1002/jmri.24757. [DOI] [PMC free article] [PubMed] [Google Scholar]


