Abstract
Auditory nerve fibers in the adult ear are divided into functional subgroups according to spontaneous rate (SR) and threshold sensitivity. The high-threshold, low-SR fibers are morphologically and spatially distinct from the low-threshold high-SR fibers at their synaptic contacts with inner hair cells. This distinction between SR groups in the adult ear is visible in confocal microscopy as complementary size gradients of presynaptic ribbons and post-synaptic glutamate receptor patches across the modiolar-pillar and habenular-cuticular axes in the inner hair cell area. The aim of the present study was to track the post-natal development of this morphological gradient, in mouse, to determine the earliest age at which this important aspect of cochlear organization is fully mature. Here we show, using morphometric analysis of the organ of Corti immunostained for pre- and post-synaptic markers of efferent and afferent innervation, that this SR-based morphological gradient is not fully established until postnatal day 28, well after other features, such as synaptic counts and efferent innervation density in both the inner and outer hair cell areas, appear fully mature.
Keywords: auditory nerve, inner ear, synaptic ribbon, glutamate receptor
Introduction
All acoustic information reaching each ear is transformed into spike trains and carried to the brain by roughly 40,000 spiral ganglion neurons (SGNs) (Arnesen et al., 1978; Makary et al., 2011). There are two types of SGNs in the mammalian cochlea. Each type-I SGN sends a myelinated peripheral axon to the organ of Corti, where it synapses with a single inner hair cell (IHC), and a myelinated central axon, i.e. auditory nerve fiber (ANF), to the cochlear nucleus where it branches to innervate many functionally disparate secondary neurons driving numerous parallel central circuits (Liberman, 1980; Liberman, 1991). Type-II SGNs constitute only ~5% of all ANFs (Spoendlin, 1969). Each type-II sends an unmyelinated peripheral axon to the organ of Corti where it branches profusely to contact up to 100 outer hair cells (Simmons et al., 1988), and an unmyelinated central axon to the cochlear nucleus (Brown et al., 1988). The type II neurons may be nociceptors (Flores et al., 2015; Simmons et al., 1988); the information mediating what we conventionally think of as “hearing” is carried by the type I fibers (Liberman, 1982b).
Electrophysiological studies of the response properties of single type-I SGNs in adult mammals have extensively documented the rules of stimulus coding (for review, see (Heil et al., 2015)). Thus, the patterns of ANF activity for essentially any stimulus can be predicted with a high degree of accuracy. There are two orthogonal dimensions that are critical to this prediction: characteristic frequency (CF) and spontaneous rate (SR). CF, the stimulus frequency to which an ANF is maximally sensitive, defines position along the mechanically tuned cochlear spiral (Liberman, 1982a); the SR is tightly correlated with threshold sensitivity, and defines the position of the synapse around the circumference of the IHC (Liberman, 1978; Liberman, 1982b).
The relationship between SR and threshold sensitivity has suggested three functional subgroups of ANFs: high-SR fibers with the lowest thresholds, low-SR fibers with the highest thresholds and medium-SR fibers with intermediate thresholds (Liberman, 1978). Single-fiber labeling experiments in adult mammals, in vivo, have shown that high-, medium and low-SR fibers all contact a single IHC via a single synaptic complex, but differ in their diameter, mitochondrial content, synaptic position on the hair cell circumference and associated presynaptic morphology (Liberman, 1980; Liberman, 1982b).
Further insight into the cellular mechanisms underlying SR-based response differences have been provided by in vitro studies of ionic currents in isolated SGNs (Davis et al., 2015; Liu et al., 2014), and of excitatory post-synaptic currents in ANF terminals from cochlear explants (Grant et al., 2010). Such in vitro experiments are generally most successful in tissue isolated from extremely young animals: < postnatal day (P) 8 for the SGN recordings and < P21 for the terminal recordings. Conversely, recording in vivo from such young animals is extremely difficult (Wong et al., 2013). Interpreting the correlations between in vitro and in vivo data requires a better understanding of the postnatal development of these primary auditory synapses, and the postnatal age at which in vitro data can be considered adult-like.
This purpose of the present study was to provide that developmental roadmap. Recent immunohistochemical work from our laboratory has suggested that the SR-based distinction among adult ANFs is reflected in complementary size gradients in the pre-synaptic ribbons and post-synaptic glutamate-receptor patches around the IHC circumference (Liberman et al., 2011; Yin et al., 2014). Thus, we set out to document the post-natal age at which these gradients become fully adult-like. In addition to providing a timeline to help interpret the in vitro physiology data, this analysis should also provide a template against which to view developmental changes in gene expression in the ongoing search for the molecular drivers of this key aspect of ANF differentiation.
Materials and Methods
Animals and groups
CBA/CaJ mice obtained from Jackson Laboratories were used for all experiments, and all procedures were approved by the IACUC of the Massachusetts Eye and Ear Infirmary. Cochleas were extracted from animals in an age graded series: P4, P7, P10, P14, P18, P21, P28, adult (P56). Full data sets were obtained from at least 2 cochleas at each age, except adult, for which data were obtained from 4-12 cochleas, depending on the metric.
Histological Preparation
At the designated age, each animal was anesthetized with ketamine, and the cochleas were removed for histological analysis. The fixative was 4% paraformaldehyde in phosphate-buffered saline at pH 7.3. At P4 and P7, animals were decapitated and cochleas were immersion-fixed for 2 – 2.5 hrs after rapid removal of the temporal bone and opening of the round and oval windows. Animals at P10 and older were intravascularly perfused with fixative, then cochleas immediately perfused through the cochlear scalae, then extracted and post-fixed for 2 hrs. After post-fixation, ears older than P10 were decalcified in EDTA for 2-3 days at room temperature. After decalcification, each cochlea was dissected into 6 pieces (roughly half turns of the cochlear spiral) for whole-mount processing of the cochlear epithelium. Immunostaining began with a blocking buffer (PBS with 5% normal horse serum and 0.3 % Triton X-100) for 1 h at room temperature and followed by overnight incubation at 37 °C with some combination of the following primary antibodies: 1) mouse (IgG1) anti-CtBP2 (C-terminal Binding Protein) from BD Biosciences at 1:200, to quantify pre-synaptic ribbons: 2) mouse (IgG2a) anti-GluA2 (Glutamate receptor subunit A2) from Millipore at 1:2000, to quantify post-synaptic receptor patches, 3) rabbit anti-VAT from Abcam at 1:200 to label terminals of cochlear efferent fibers, and/or 4) rabbit anti-Myosin VIIa from Proteus Biosciences at 1:200 to delineate the hair cell cytoplasm. Primary incubations were followed by 2 sequential 60-min incubations at 37°C in species-appropriate s econdary antibodies (coupled to Alexafluor dyes) with 0.3% TritonX. After immunostaining and mounting of dissected pieces in Vectashield, slides were coverslipped and sealed with nail polish.
Cochlear Frequency Mapping
After immunostaining, each cochlea was mapped by tracing the arc of the pillar heads in each dissected piece using a custom plug-in to ImageJ, which performs a spline fit to the spiral, computes the cumulative length, and displays the positions of designated half-octave frequency points (5.6, 8.0, 11.3, 16.0, 22.6, 32.0, 45.2 and 64 kHz) in each case. Printouts of the maps for each case provide a “roadmap” to guide acquisition of images at precisely stereotyped positions along the spiral in all cases.
Image Acquisition
At each of the 8 half-octave frequency points along the cochlear spiral, zstacks were acquired using a 63× glycerol-immersion objective (N.A. 1.3) on a Leica SP8 confocal microscope with a digital zoom of 2.4, a raster size of 1024 × 512 and a resultant pixel size of 75 nm in the x-y plane and a z-step of 0.33 μm between optical slices. Z-span was always carefully adjusted to include all synaptic elements in all the hair cells in the stack. Laser power, acquisition filters and PMT gains were always carefully adjusted to minimize pixel saturation in all channels, and to eliminate inter-channel crossover in the acquired signals, however, alterations in acquisition parameters were minimal within or across cases. 4-channel images were acquired separately in the IHC and OHC areas, At the standard magnification and zoom, each stack spanned roughly 77 μm of cochlea length, i.e. about 10 adjacent IHCs and 11 adjacent OHCs in each of the three rows. In the IHC area, 2 adjacent sets of IHCs were always imaged at each of the designated frequency regions in each ear.
Morphometric Analysis
Morphometric analysis in the present study included 1) counts of ribbons or synapses (closely juxtaposed ribbon-receptor patches) in the IHC and OHC areas, 2) assessment of the spatial size gradient of ribbons and receptor patches in the IHC area and 3) estimation of the density of efferent innervation in the IHC and OHC areas.
Ribbon/synapse counts
The signal-to-noise ratio in the “ribbon channel’ is high enough that the identification of CtBP2-positive puncta is achievable by computer algorithm without any user adjustment. Each acquired z-stack is ported into Amira software, where the “connected components” function is used to identify the x,y,z, positions and volumes of every element in 3-D voxel space of at least 10 contiguous pixels and within which all the pixel intensities are greater than 45 on an 8-bit (0-255) scale. The list of identified puncta is then exported to a spreadsheet, which is read by custom software that uses the x,y,z coordinates to produce a thumbnail re-projection of the 1 μm cube around each CtBP2-positive puncta, and to arrange these thumbnails in a visual output array ordered according to the user’s wishes (by z-position, by ribbon size, by total signal in the GluA2 channel, etc.) and exported as a conventional .png or .tif file readable by any standard imaging software. Selecting “order by GluA2 channel intensity” produces a thumbnail array that is easy to scan and identify ribbons that are not closely juxtaposed to a glutamate receptor patch. Total numbers of ribbons or synapses are then divided by the number of hair cells in the stack (including fractions), as assessed using either the MyosinVIIa channel or the faint nuclear staining in the CtBP2 channel in the native z-stack.
Spatial Gradients
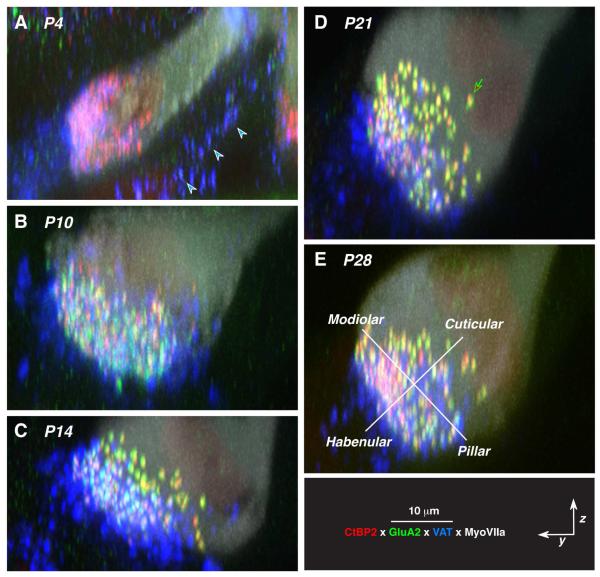
To assess the modiolar-pillar or habenular-cuticular gradients in sizes of pre-synaptic ribbons and post-synaptic receptor patches in the IHC area, the volumes and x,y,z, coordinates of all the ribbons and receptor patches are obtained in Amira as described above and exported as conventional spreadsheet files. These data are then analyzed by a custom software suite. The first step is to transform the x,y,z axes from the acquisition plane (constrained by the way the dissected pieces sit on the microscope slide) to a hair-cell centered system of axes. To make this transformation, the software displays the 4-color yz projection of each acquired stack: this projection is a perfect “side view” of the IHC row, as if siting along the cochlear spiral, because great care is taken, during image acquisition, to align the IHC row perfectly parallel to the x-axes of the image field. Using this “side view”, the user manually defines a modiolar-pillar axis by drawing a straight line on the image, as aided by the appearance of the synaptic cloud and hair cell cytoplasm (See Fig. 4E). The software then computes the new positions of all synaptic elements along this transformed x axis, and assigns the origin at the midpoint between the transformed x positions of the most modiolar and most pillar puncta in the stack. It then defines an orthogonal (habenularcuticular) y axis, and again sets the origin at the midpoint between the extreme transformed y values among all the puncta in the stack. This strategy for defining modiolar-pillar axes and quantifying the spatial gradients in IHC synaptic puncta is described in more detail elsewhere (Liberman et al., 2015). For the spatial analysis, the element sizes are all normalized to the median value in the same z-stack, because small differences in staining intensity from ear to ear translate into large differences in puncta volume between cases; thus, the gradients are clearer when each stack is internally normalized (Yin et al., 2014). Ribbons and receptor patches are separately normalized.
Figure 4.
Confocal images of the maturing cochlear nerve synapses on inner hair cells, as viewed in y,z plane to reveal the modiolar-pillar size gradients in pre- and post-synaptic puncta. Each panel is the maximum projection onto the yz plane of a confocal z-stack such as pictured in Figure 1; as in Figure 1, all are from the 11.3 kHz region of the cochlea. The orientations of the user-defined modiolar-pillar and habenular-cuticular axes are illustrated for one case (E). Arrowheads in A point to VAT-positive puncta in the pillar cell area. Key at bottom right applies to all panels.
Efferent Innervation Density
To assess the density of efferent innervation in each z-stack, the VAT channel is extracted from the confocal image file, and a maximum projection obtained in the xy plane and exported as a one-color image file. This image file is ported to ImageJ, where a thresholding algorithm is applied and the total silhouette area of the suprathreshold pixels is computed. An intensity value of 45 on an 8 bit (0-255) scale was used as threshold for all images in all cases in both the IHC and OHC areas.
Statistical Analysis
Statistical analysis was carried out in Kaleidagraph using ANOVA with a Bonferroni post hoc correction.
Results
According to prior studies of cochlear development in mouse, hair cells first appear around embryonic day (E)16, and hair cell proliferation and cochlear duct extension is complete before birth (Kelley, 2007). The peripheral processes of cochlear nerve fibers are present in the sensory epithelium around the time of the first hair cell differentiation, and as for hair cells, the proliferation of cochlear ganglion cells is almost complete by birth (for review see (Bulankina et al., 2012; Coate et al., 2013)).
Despite the presence of the adult numbers of hair cells and spiral ganglion neurons by P0, the organization of the afferent and efferent innervation is far from adult like. The aim of the present study was to identify the earliest postnatal age at which the innervation patterns look indistinguishable from those seen in adults. In the adult ear, there are two types of sensory neurons: 1) myelinated type-I spiral ganglion neurons (SGNs) synapsing on IHCs in an extremely punctate fashion: each peripheral axon contacts a single IHC via a single unmyelinated dendrite forming a single, glutamatergic synaptic complex containing a single presynaptic ribbon (Liberman, 1980; Ottersen et al., 1998), and 2) unmyelinated type-II SGNs synapsing on multiple OHCs in an extremely diffuse fashion after spiraling through the outer spiral bundles for significant distances towards the base of the cochlea (Simmons et al., 1988). Adult type-II fibers also differ from type I’s in lacking clear post-synaptic glutamate receptor staining (Huang et al., 2012; Liberman et al., 2011).
A. Maturation of ribbon and synapse counts in IHCs and OHCs
To analyze the postnatal maturation of afferent synapses in the inner and outer hair cell areas, we immunostained the cochlear sensory epithelium from CBA/CaJ mice for pre- and post-synaptic markers at P4, P7, 10, P14, P18, P21, P28 and adult (P56).
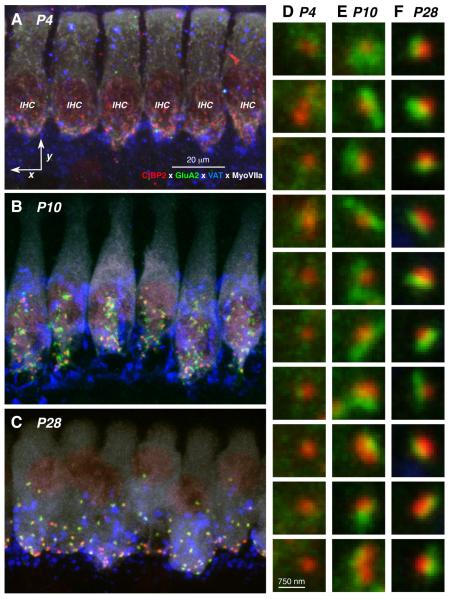
As can be seen in Figure 1, the synaptic zone of the IHC area in P28 mice (panel C) appears to be mature: the basolateral surfaces of each IHC are studied with closely juxtaposed pairs of CtB2-positive puncta (red) representing pre-synaptic ribbons and GluA2-positive puncta (green) representing post-synaptic receptor plaques. There are between 15 and 20 such synaptic pairs on each hair cell, as expected from serial-section electron microscopy (Stamataki et al., 2006). The high-power “thumbnail” view of these immuno-positive paired puncta (Fig. 1E) show that the both the CtBP2 and the GluA immunostaining is highly condensed with bright circumscribed puncta clearly delineated from a low-signal background label.
Figure 1.
Confocal images of the maturing cochlear nerve synapses on IHCs. A,B,C: Maximum projections of confocal z-stacks through 6 adjacent IHCs at the 11.3 kHz region, from cochleas at P4, P10 and P28, respectively. Scale bar in A also applies to B and C; staining key in A applies to all Panels. D,E,F: High-power views of representative synapses, in random order, from each of the three z-stacks shown in A, B and C, respectively, showing only the CtBP2 (red) and GluR2 (green) channels. Scale bar for all these thumbnails is shown at the bottom of column D.
The qualitative view of the IHC synaptic zone at P10 is quite different. Although the presynaptic ribbons are still concentrated in the in sub-nuclear and peri-nuclear regions of the IHCs (Fig. 1B), the GluA2 immunostaining looks much less punctate, and the overall numbers of synaptic elements seem greater than at P28. The less punctate nature of the GluA2 immunostaining is clear in the thumbnail array (Fig. 1D). At P4, the GluA2 label is even more diffuse (Fig. 1A,D), and even the ribbon puncta are less clearly defined than at older ages.
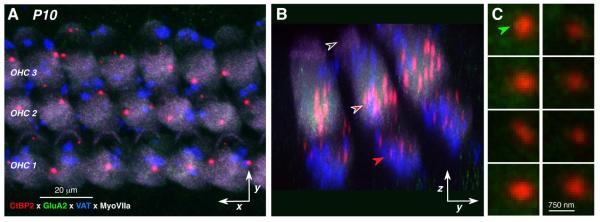
In the OHC area, at all ages =P10, the pre-synaptic ribbons are concentrated in two regions of the OHC cytoplasm: one cluster of relatively large ribbons is located in the supranuclear region (red-filled arrow in Fig. 2B) and a second cluster of smaller ribbons is found at the basolateral pole, just below the nucleus, where the terminals OC efferent fibers and type-II cochlear neurons are also clustered (red-filled arrow in Fig. 2B). At none of the post-natal ages examined were the OHC ribbons clearly paired with post-synaptic GluA2 puncta. Faint GluA2 signal was sometimes seen in close contact with a ribbon (e.g. green arrow in Fig. 2C), but the signal was only visible after increasing the output intensity in the green channel, well above that at which nearby IHC ribbons were clearly coupled with bright post-synaptic GluA2 patches: the OHC ribbon thumbnails in Figure 2C are from the same cochlear region of the same piece as the IHC ribbon thumbnails in Figure 1D.
Figure 2.
Confocal images of P10 OHCs showing lack of GluA2-positive puncta. A,B: Maximum projections of confocal z-stacks through OHCs from the same case and cochlear region shown in Figure 1B: A is the x,y projection and B is the zy projection of the same image stack. Arrows in B point to 1) the cuticular plates from the 2nd row outer hair cells (black-filled), 2) the supranuclear ribbons (white-rimmed red arrow), and 3) the subnuclear ribbons (redrimmed red arrow). Key in A also applies to B. C: High power views of selected ribbons from A, showing only the CtBP2 (red) and GluR2 (green) channels. Green arrow points to the hint of GluA2 staining sometimes seen near the OHC ribbons. Scale bar bottom right applies to all thumbnails.
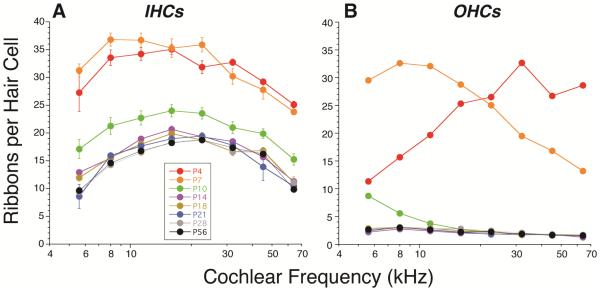
To look at the afferent innervation trends more quantitatively, we counted ribbons in both IHC and OHC areas at the 7 postnatal ages from P4 to P56. As shown in Figure 3, both hair cell types are full of CtBP2-positive puncta at P4 and P7, indeed, the mean numbers per hair cell are more than twice those seen in the adult ear. At P4, the puncta are quite diffuse, thus the criteria for inclusion is more arbitrary, and the counts are rough approximations. Even at P4, these CtBP2 puncta are clustered at the basolateral pole of the cells, as in the adult (Fig. 4A), but none is associated with condensed post-synaptic GluA2 patches in either IHC area (Fig. 1D) or the OHC area. At P10, which is the earliest age at which post-synaptic GluR patches are clearly associated with most IHC ribbons, the IHC ribbon counts fall to values closer to, but still significantly higher than, the adult [P56] ear (p < 0.0001, F=66.18 by two-way ANOVA). By P14, the IHC ribbon counts are very close to adult values, however the differences, which are largest in the apical regions, are still significant across all frequencies (p < 0.0001, F=23.43). At P18, the significance of the difference is borderline (P = 0.011, F=7.414). Finally, by P21, the ribbon counts are statistically indistinguishable (p = 0.929, F=0) from adult [P56]. At all ages ≥ P14, more than 98% of the IHC pre-synaptic ribbon puncta were clearly associated with post-synaptic glutamate receptor patches in all cochlear regions. The lower values for ribbon counts in the adult OHCs are expected because prior ultrastructural studies have suggested that there are fewer afferent synapses per OHC than per IHC (Liberman et al., 1990) and, furthermore, many type-II synapses in the adult do not include pre-synaptic ribbons (Dunn et al., 1975).
Figure 3.
Postnatal maturation of synaptic ribbon counts in inner (A) or outer hair cells (B) from P4 through P42. Key in A also applies to B. OHC ribbon counts include all CtBP2-positive puncta, regardless of whether they appear in the subnuclear or supranuclear cluster (Fig. 2B). Data are obtained from 2-4 ears at each postnatal age. In the IHC area, two z-stacks, each containing 8-11 IHCs were evaluated at each frequency region from each ear. Thus each point represents the average count from at least 32 IHCs. In the OHC area, one z-stack from each ear, each containing 29-33 OHCs (from all three rows) was evaluated at each frequency region. Thus each point represents the average count from at least 58 OHCs.
B. Maturation of spatial size gradients of synaptic elements in IHCs
ANFs have been divided into functional subgroups according to SR and threshold sensitivity, and intracellular labeling studies have shown that low-threshold high-SR fibers tend to synapse on the pillar side of the IHC, whereas the high-threshold, low-SR fibers tend to synapse on the modiolar side of the IHC (Liberman, 1982b). Recent confocal studies from our laboratory have suggested that this spatial separation of ANF synapses around the IHC circumference can be seen as complementary gradients in the sizes of pre-and post-synaptic puncta after immunostaining for CtBP2 and GluA2 when an image stack from a row of IHCs is projected as if sighting along the axis of cochlear spiral (Liberman et al., 2011; Liberman et al., 2015; Yin et al., 2014). A set of these zy projections is assembled in Figure 4, to summarize the maturation of this spatial size gradient during post-natal development.
Working backwards from the most mature morphology, at P28, the gradients appear along the modiolar-pillar axis as an increase in red signal (CtBP2) towards the modiolar side, and increase in the size of the green puncta (GluA2 signal) towards the cuticular end of the synaptic cloud. At P21, signs of those same gradients are visible, but at P14, the habenular-cuticular gradient seems clear but the modiolar-pillar ribbon gradient has not yet appeared. At P10 neither gradient seems very clear, and at P4, there is a plethora of ribbons, with no obvious spatial size gradient and no obvious post-synaptic puncta whatsoever.
To evaluate these gradients more quantitatively, we defined a modiolar-pillar axis in the zy plane to be roughly perpendicular to the long axes of the aligned IHCs in each z-stack. Once this user-defined axis was drawn for each z-stack (in custom software), the origin of the transformed axes was set at the midpoint of the synaptic cloud, i.e. halfway between the most extreme synaptic position along each axis (Fig. 4E). We then compared the mean volumes of pre-synaptic ribbons (Fig. 5) and post-synaptic glutamate receptor patches (Fig. 6) on each side of the transformed axes.
Figure 5.
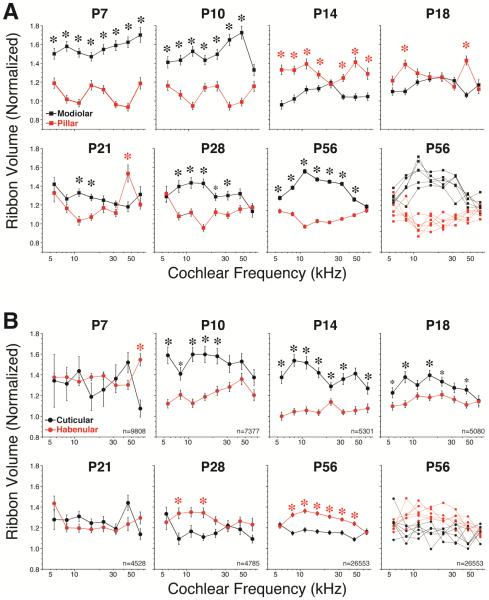
Spatial gradients of ribbon sizes in the IHC area do not appear mature until at least P28, either along the modiolar-pillar axis (A) or the habenular-cuticular axis (B). Data at each age from P7 to P28 are extracted from 4 z-stacks at each frequency region: 2 from each ear of one animal. Each z-stack contains ~10 IHCs and therefore ~180 ribbon puncta, thus each point shows the mean (±SEM) of ~720 synapses from ~40 IHCs, and each panel includes data from ~5000 synapses along the cochlear spiral (total n’s are given at the bottom right of each panel in B). Data at P56 are extracted from 2 z-stacks at each frequency region from each of 12 ears from 6 animals. The data at P56 are shown in two ways: as the ensemble means and SEMs for all 12 ears, and again as the individual means for each of the six pairs of ears in this group: each of the latter graphs represents an identical sample size to the paired-ear data at each of the younger ages. Asterisks indicate statistically significant inter-group differences by one-way ANOVA: large asterisks for p < 0.001; small asterisks for p < 0.01.
Figure 6.
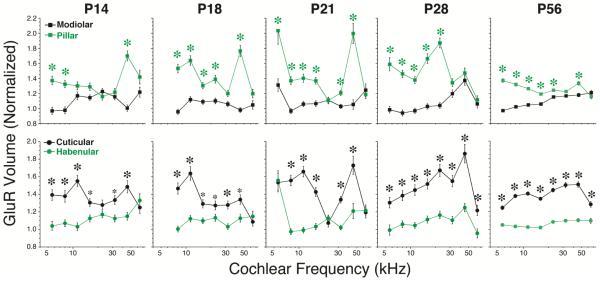
Spatial gradients of GluR patch size are established at P14, the earliest age at which they have coalesced enough to be quantifiable. For further details on the analysis see Figure 5.
As shown in Figure 5, the maturation of ribbon-size gradients is complex, but does not appear to be complete until at least P28. The modiolar-side ribbons are significantly larger than pillar-side ribbons at P7 and P10 (p< 0.001; Fig. 5A). Then the gradient reverses, then collapses, at most frequency regions, from P14 through P21, only to re-establish itself as the mature pattern by P28. As shown in Figure 5B, a significant cuticular-habenular gradient in ribbon size first appears at P10, but in the opposite direction to that seen in the adult. The gradient then collapses by P21 and reverses to something approaching the mature pattern by P28. In the mature ear (P56), the gradients in ribbon size are extremely robust along both the modiolar-pillar and habenular cuticular axes: not only are the mean intergroup differences highly significant (p < 0.001 for all regions except the apical and/or basal ends), the gradients in midcochlear regions are also significant in every individual case examined (Fig. 5A,B).
As shown in Figure 6, the gradients of glutamate receptor patches are present as soon as P14, the earliest age at which the GluA2-immunopositive puncta are condensed and discrete enough to be reliably measured. These gradients do not collapse or reverse and do not seem to change in any fundamental way between P14 and P56 (adult).
C. Maturation of olivocochlear efferent projections to the IHC and OHG areas
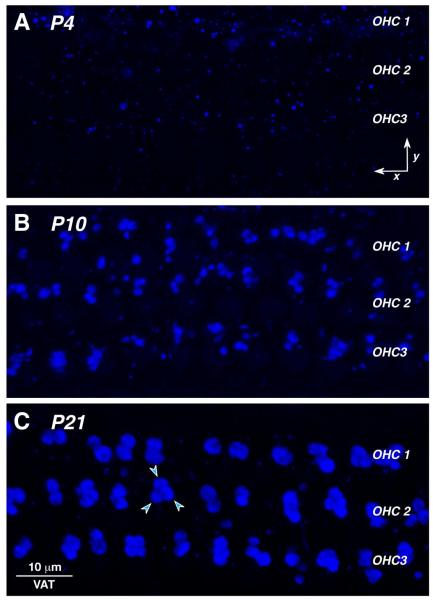
To analyze the olivocochlear efferent innervation, we add anti-VAT antibodies in one of the channels. Vesicular acetylcholine transferase is present in all cholinergic neurons, and, in the cochlea, it is useful for immunostaining the vast majority of efferent terminals (Darrow et al., 2006). As can be seen in Figures 1 and 4, the olivocochlear efferent terminals in the IHC area are seen as a cloud of 1-3 μm puncta, which tend to cluster in the vicinity of the afferent synaptic contacts at the sub-nuclear and peri-nuclear poles of the IHCs. Such puncta are present in the IHC area at all ages examined (P4 – P56), but at the earliest age, they are also present in the tunnel of Corti where they appear to intercalate themselves between the inner and outer pillar cells (Fig. 4A). In the outer hair cell area at P4, the VAT-positive puncta are small and few in number (Fig 7A). As maturation proceeds, the number of OC terminals increases and their size also grows.
Figure 7.
Confocal images of the maturing efferent synapses on OHCs, as viewed in the acquisition (x,y) plane. Each image is the maximum projection of a z-stack from the 16 kHz region, encompassing 10-11 OHCs from each row. Arrowheads in C point to three efferent terminals at the base of one OHC. Scale bar in C applies to all panels.
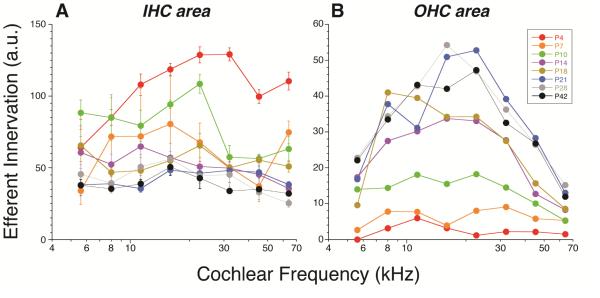
To assess the maturation of the efferent innervation more quantitatively, we measured the silhouette area of the VAT-positive puncta in maximum projections from the acquisition (xy) plane, As shown in Figure 8, the overall density of VAT-positive puncta in the IHC area actually decreases from P4 to P56. The first age at which the density is statistically indistinguishable from adult is P21. In the OHC area, on the other hand, the density increases from P4 to P56, with the earliest age at which the mature pattern emerges is, again, P21.
Figure 8.
Maturation of the density of olivocochlear efferent innervation in the IHC (A) and OHC (B) areas. Data are extracted from the same z-stacks described in Figure 1. Innervation density is estimated by measuring the silhouette areas of VAT-immunostained profiles in maximum projections such as those shown in Figure 7. See Methods for further details.
Discussion
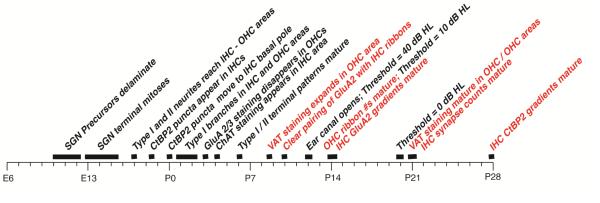
Many aspects of the early development and differentiation of the cochlear afferent and efferent innervation have been well studied in the mouse, as summarized in Figure 9. The precursors of spiral ganglion neurons (SGNs) delaminate from the otic vesicle between embryonic day (E)10 and E13, and undergo terminal mitoses by E15.5 (Coate et al., 2013), by which time the hair cells have also undergone terminal mitoses, and the cochlear spiral is fully formed (Kelley, 2007). By E17, the growing peripheral extensions of SGNs have invaded the organ of Corti, and a subset has crossed the tunnel and begun to spiral towards the cochlear base (Koundakjian et al., 2007); thus, the distinction between type I and type II SGNs innervating IHCs and OHCs respectively, via radial and outer spiral fibers, respectively, is already clearly established before birth.
Figure 9.
Developmental timeline for cochlear afferent and efferent innervation in the mouse. Entries in red are from the present study. Entries in black are from the literature (references are cited in the text).
By E18, CtBP2-positive puncta first appear in the IHCs and OHCs, initially present throughout the cytoplasm, and then congregating towards the basolateral pole by P0 (Huang et al., 2012). From P0 to P3, there is extensive pruning of type I terminals, as they retract from the OHC area and lose all but one branchlet in the IHC area (Druckenbrod et al., 2015; Huang et al., 2007; Huang et al., 2012), i.e. adopt their mature form. By P3, the disappearance of type-I terminals from the OHC area is accompanied by a loss of GluA2/3 AMPA glutamate receptor labeling in the OHC area (Huang et al., 2012) and the first appearance of cholinergic, i.e. olivocochlear efferent, terminals in the IHC area (Huang et al., 2007), at least as seen by expression of choline acetyltransferase (ChAT).
A. Postnatal Maturation of Synaptic Morphology
By P6, roughly the time of the earliest observations in the present study (P4), the mature innervation patterns of SGN type I and type II neurons have emerged (Druckenbrod et al., 2015; Huang et al., 2007; Huang et al., 2012), at least as seen via light-microscopic fiber-tracing techniques. However, the synaptic architecture at P6 is clearly far from mature. Here, we show that the numbers of pre-synaptic ribbons in both IHCs and OHCs don’t approach their mature values until somewhere between P10 and P14 (Fig. 3), the same time period during which the olivocochlear efferent projections to the OHC area are most rapidly expanding (Fig. 8B). This developmental window for ribbon maturation is in agreement with a prior study of C57Bl6 mice, which examined one mid-cochlear location at P0, P3, P6, P12 and adult (P35-42) and concluded that ribbon counts in both IHCs and OHCs matured at P12 (Huang et al., 2012). The present study (Fig. 3) and prior work (Huang et al., 2012; Wong et al., 2014) agree that, at P3 – P6, IHC ribbon counts are 2 – 3 times higher than those in the adult. Electron microscopic studies at these early post-natal ages show that 2 – 3 ribbons are often present at points of contact between IHCs and afferent terminals (Shnerson et al., 1981b; Sobkowicz et al., 1986; Wong et al., 2014). Thus, virtually all the “extra” IHC ribbons at P4 are likely located at points of afferent contact, and the reduction in ribbon counts from P4 to P14 likely represents disappearance of all but one ribbon at each synaptic complex as the synapse matures. The loss of IHC ribbons between P4 and P14 is accompanied by a coalescence of voltage activated calcium channels at the pre-synaptic active zones into a single stripe-like cluster per synapse (Frank et al., 2010; Wong et al., 2014).
Although CtBP2-positive puncta are restricted to the synaptic zone, i.e. the basolateral pole, of the IHCs by P4 (Fig. 4A) and the peripheral branches of type-I SGNs appear mature by P6 (Druckenbrod et al., 2015; Huang et al., 2007), our data suggest that these nascent ribbons are not clearly paired with glutamate receptor labeling until P10 (Fig. 4B), and the glutamatereceptor puncta do not coalesce to a mature form until P14 (Fig. 4C). These light-microscopic observations are consistent with prior electron-microscopic studies of the mouse cochlea, which concluded that the pre-synaptic machinery assembles before the post-synaptic machinery (Sobkowicz et al., 1986). As early as P3, ultrastructural studies in mouse show electron-dense ribbons, tethered to the IHC membrane, surrounded by a halo of synaptic vesicles, and apposed to terminal swellings that appear to be from afferent fibers, but lack the post-synaptic density that characterizes the mature morphology (Sobkowicz et al., 1986). Electron-microscopic analysis also shows that, by P14, ~95% of IHC ribbons are apposed to cochlear nerve terminals and ~90% are associated with post-synaptic densities and that similar patterns were seen at P25 (Sobkowicz et al., 1986). In our data (not shown), close to 100% of IHC ribbons were paired with GluA2 puncta at ages ≥ P14: the slight discrepancy may arise because of interstrain differences in mouse cochleas or because, in electron microscopic studies, a tangential section through a pre-synaptic complex could erroneously suggest that it was unpaired with a post-synaptic density.
In the OHC area, ultrastructural studies report that the proportion of OHC ribbons apposed to nerve terminals falls from ~90% in the first post-natal week to only ~50% in the third postnatal week, and, that in the more mature ear, 30% of the ribbons are “misplaced”, i.e. far from the basolateral pole and from the OHC membrane (Sobkowicz et al., 1986). Our results (e.g. Fig. 2B) are similar: at all ages ≥ P10, ~1/3 of OHC ribbons were in a supranuclear cluster far from the locations of type-II terminals. The functional significance of this persistent population of non-synaptic ribbons in mature OHCs is unknown.
B. Synaptic Morphology and Cochlear/Synaptic Physiology
The period of rapid maturation of ribbon counts and efferent density, i.e. P10 – P14 (Figs. 3 and 8), corresponds to a period of rapid maturation of cochlear function in mouse. As summarized in Figure 9, this developmental window also corresponds to a time when the external ear canal is opening (P11-P12 (Shnerson et al., 1981a)), and the thresholds for soundevoked, round-window neural responses decrease from ~75 dB SPL at P12 to ~45 dB SPL at P14, i.e. within 10 dB of the mature threshold value (Shnerson et al., 1981a). Cochlear thresholds mature by P21, corresponding to the age when ribbon counts and olivocochlear efferent densities have arrived at mature values in both the IHC and OHC areas (Figs. 3 and 8). In light of this developmental timeline, synaptic physiology of type-II terminals obtained from rats at P5-P10 (Liu et al., 2015; Weisz et al., 2014) could differ in significant ways from the mature state.
Here we show that the modiolar-pillar and habenular-cuticular gradients of IHC ribbon size do not mature until sometime between P21 and P28 (Fig. 5). Indeed at P21, the habenularcuticular gradient in ribbon size is still opposite to that seen in the adult (Fig. 5B). Although the functional significance of the habenular-cuticular gradient in synaptic puncta has, as yet, no clear functional correlate, the modiolar-pillar gradient in synaptic morphology is correlated with the hetereogeneity of cochlear nerve fibers with respect to threshold sensitivity and spontaneous rate (SR) (Liberman et al., 2011; Liberman et al., 1990; Merchan-Perez et al., 1996). Single-fiber labeling studies at the electron-microscopic level have shown that the highthreshold, low SR fibers are apposed to larger per-synaptic ribbons in cat (Merchan-Perez et al., 1996). The complementary relation between ribbon size and glutamate-receptor patch size in immunostained mouse ears is also consistent with the association of large-ribbon synapses with high-threshold neurons (Liberman et al., 2011). Work in zebrafish lateral line has suggested that ribbon size is negatively regulated by Ca++ entry at the synapse (Sheets et al., 2012), which is also consistent with the association of large-ribbons with low-activity, low-SR neurons in mammals. On the other hand, work in P14-18 mice shows that ribbon size is positively correlated with depolarization-evoked Ca++ influx in IHCs (Frank et al., 2009). Regardless of how this discrepancy is ultimately resolved, the present study suggests that the fully mature relation between SR and threshold is not present in mouse until after P21. Similarly, a recent study of the topography of Na+ and K+ channel expression in the rat cochlear nerve reports continuing developmental changes post-synaptically until P30 (Kim et al., 2016). Thus, any gene expression study aimed at identifying the molecular differences among the different SR groups should be extracting RNA from animals at P28 or older.
The relatively late maturation of synaptic gradients in mouse IHCs is also relevant to ongoing attempts to relate in vitro post-synaptic physiology and pre-synaptic calcium imaging at the IHC / cochlear nerve synapse to the SR-based heterogeneity of cochlear nerve fibers in the adult. In rats, recordings from type-I terminals at P8-11 vs. P19-21 show a decrease in proportion of multiphasic vs. monophasic excitatory post-synaptic currents (Grant et al., 2010). The authors suggest that this distinction is related to the low- vs. high-SR distinction among mature cochlear nerve fibers. However, an alternate interpretation is that the multiphasic currents arise from terminals opposite immature multi-ribbon synapses (Shnerson et al., 1981b; Sobkowicz et al., 1986), while the monophasic currents arise from the more-mature singleribbon synapses destined to drive mature fibers from all SR groups. Given the similarities in cochlear nerve functional development in mouse and rat (Shnerson et al., 1981a; Uziel et al., 1981), and adjusting for the slightly longer gestational period in the latter, data obtained from P19-21 rats is likely to be just at the cusp of maturity.
In mice, the Moser group has shown that P10 cochlear nerve fibers, in vivo, have low SRs (mean = 11 sp/sec) and no response to sound, whereas at P14, the SR has doubled (mean = 24 sp/sec), and the sound thresholds have dramatically decreased (Wong et al., 2013). This response maturation is coupled to an increase in the depolarization-invoked Ca2+ influx at selected active zones, possibly corresponding to the maturing high-SR group. The increased Ca2+ influx, in turn, may be due to increased expression of pre-synaptic CaV1.3 channels seen in IHCs between P6 and P21 (Wong et al., 2013). However, the difficult physiological experiment of determining at what postnatal age the normal relation between SR and threshold first appears has yet to be done. Thus, the morphological data presented here represent our best guess, at present.
Mouse cochleas were studied at P4 to adult, to track maturation of afferent and efferent synapses
Synapse counts in the inner hair cell area did not reach adult levels until P21
Spatial gradients of synapse morphology in the inner hair cell area were not adult-like until P28
The subdivision of auditory nerve fibers into spontaneous rate groups is likely not mature until P28
Acknowledgments
Research supported by grants from the NIDCD: R01 DC 0188 and P30 DC 05209.
Footnotes
Publisher's Disclaimer: This is a PDF file of an unedited manuscript that has been accepted for publication. As a service to our customers we are providing this early version of the manuscript. The manuscript will undergo copyediting, typesetting, and review of the resulting proof before it is published in its final citable form. Please note that during the production process errors may be discovered which could affect the content, and all legal disclaimers that apply to the journal pertain.
Conflict of Interest
The authors have no relevant financial conflicts of interest to declare.
References Cited
- Arnesen AR, Osen KK. The cochlear nerve in the cat: topography, cochleotopy, and fiber spectrum. The Journal of comparative neurology. 1978;178:661–78. doi: 10.1002/cne.901780405. [DOI] [PubMed] [Google Scholar]
- Brown MC, Berglund AM, Kiang NY, Ryugo DK. Central trajectories of type II spiral ganglion neurons. The Journal of comparative neurology. 1988;278:581–90. doi: 10.1002/cne.902780409. [DOI] [PubMed] [Google Scholar]
- Bulankina AV, Moser T. Neural circuit development in the mammalian cochlea. Physiology. 2012;27:100–12. doi: 10.1152/physiol.00036.2011. [DOI] [PubMed] [Google Scholar]
- Coate TM, Kelley MW. Making connections in the inner ear: recent insights into the development of spiral ganglion neurons and their connectivity with sensory hair cells. Seminars in cell & developmental biology. 2013;24:460–9. doi: 10.1016/j.semcdb.2013.04.003. [DOI] [PMC free article] [PubMed] [Google Scholar]
- Darrow KN, Simons EJ, Dodds L, Liberman MC. Dopaminergic innervation of the mouse inner ear: evidence for a separate cytochemical group of cochlear efferent fibers. The Journal of comparative neurology. 2006;498:403–14. doi: 10.1002/cne.21050. [DOI] [PMC free article] [PubMed] [Google Scholar]
- Davis RL, Crozier RA. Dynamic firing properties of type I spiral ganglion neurons. Cell and tissue research. 2015;361:115–27. doi: 10.1007/s00441-014-2071-x. [DOI] [PubMed] [Google Scholar]
- Druckenbrod NR, Goodrich LV. Sequential Retraction Segregates SGN Processes during Target Selection in the Cochlea. The Journal of neuroscience : the official journal of the Society for Neuroscience. 2015;35:16221–35. doi: 10.1523/JNEUROSCI.2236-15.2015. [DOI] [PMC free article] [PubMed] [Google Scholar]
- Dunn RA, Morest DK. Receptor synapses without synaptic ribbons in the cochlea of the cat. Proceedings of the National Academy of Sciences of the United States of America. 1975;72:3599–603. doi: 10.1073/pnas.72.9.3599. [DOI] [PMC free article] [PubMed] [Google Scholar]
- Flores EN, Duggan A, Madathany T, Hogan AK, Marquez FG, Kumar G, Seal RP, Edwards RH, Liberman MC, Garcia-Anoveros J. A non-canonical pathway from cochlea to brain signals tissue-damaging noise. Current biology : CB. 2015;25:606–12. doi: 10.1016/j.cub.2015.01.009. [DOI] [PMC free article] [PubMed] [Google Scholar]
- Frank T, Khimich D, Neef A, Moser T. Mechanisms contributing to synaptic Ca2+ signals and their heterogeneity in hair cells. Proceedings of the National Academy of Sciences of the United States of America. 2009;106:4483–8. doi: 10.1073/pnas.0813213106. [DOI] [PMC free article] [PubMed] [Google Scholar]
- Frank T, Rutherford MA, Strenzke N, Neef A, Pangrsic T, Khimich D, Fejtova A, Gundelfinger ED, Liberman MC, Harke B, Bryan KE, Lee A, Egner A, Riedel D, Moser T. Bassoon and the synaptic ribbon organize Ca(2)+ channels and vesicles to add release sites and promote refilling. Neuron. 2010;68:724–38. doi: 10.1016/j.neuron.2010.10.027. [DOI] [PMC free article] [PubMed] [Google Scholar]
- Grant L, Yi E, Glowatzki E. Two modes of release shape the postsynaptic response at the inner hair cell ribbon synapse. The Journal of neuroscience : the official journal of the Society for Neuroscience. 2010;30:4210–20. doi: 10.1523/JNEUROSCI.4439-09.2010. [DOI] [PMC free article] [PubMed] [Google Scholar]
- Heil P, Peterson AJ. Basic response properties of auditory nerve fibers: a review. Cell and tissue research. 2015;361:129–58. doi: 10.1007/s00441-015-2177-9. [DOI] [PubMed] [Google Scholar]
- Huang LC, Thorne PR, Housley GD, Montgomery JM. Spatiotemporal definition of neurite outgrowth, refinement and retraction in the developing mouse cochlea. Development. 2007;134:2925–33. doi: 10.1242/dev.001925. [DOI] [PubMed] [Google Scholar]
- Huang LC, Barclay M, Lee K, Peter S, Housley GD, Thorne PR, Montgomery JM. Synaptic profiles during neurite extension, refinement and retraction in the developing cochlea. Neural development. 2012;7:38. doi: 10.1186/1749-8104-7-38. [DOI] [PMC free article] [PubMed] [Google Scholar]
- Kelley MW. Cellular commitment and differentiation in the organ of Corti. The International journal of developmental biology. 2007;51:571–83. doi: 10.1387/ijdb.072388mk. [DOI] [PubMed] [Google Scholar]
- Kim KX, Rutherford MA. Maturation of NaV and KV Channel Topographies in the Auditory Nerve Spike Initiator before and after Developmental Onset of Hearing Function. The Journal of neuroscience : the official journal of the Society for Neuroscience. 2016;36:2111–8. doi: 10.1523/JNEUROSCI.3437-15.2016. [DOI] [PMC free article] [PubMed] [Google Scholar]
- Koundakjian EJ, Appler JL, Goodrich LV. Auditory neurons make stereotyped wiring decisions before maturation of their targets. The Journal of neuroscience : the official journal of the Society for Neuroscience. 2007;27:14078–88. doi: 10.1523/JNEUROSCI.3765-07.2007. [DOI] [PMC free article] [PubMed] [Google Scholar]
- Liberman LD, Wang H, Liberman MC. Opposing gradients of ribbon size and AMPA receptor expression underlie sensitivity differences among cochlear-nerve/hair-cell synapses. The Journal of neuroscience : the official journal of the Society for Neuroscience. 2011;31:801–8. doi: 10.1523/JNEUROSCI.3389-10.2011. [DOI] [PMC free article] [PubMed] [Google Scholar]
- Liberman LD, Suzuki J, Liberman MC. Dynamics of cochlear synaptopathy after acoustic overexposure. Journal of the Association for Research in Otolaryngology : JARO. 2015;16:205–19. doi: 10.1007/s10162-015-0510-3. [DOI] [PMC free article] [PubMed] [Google Scholar]
- Liberman MC. Auditory-nerve response from cats raised in a low-noise chamber. J Acoust Soc Am. 1978;63:442–455. doi: 10.1121/1.381736. [DOI] [PubMed] [Google Scholar]
- Liberman MC. Morphological differences among radial afferent fibers in the cat cochlea: An electron-microscopic study of serial sections. Hear Res. 1980;3:45–63. doi: 10.1016/0378-5955(80)90007-6. [DOI] [PubMed] [Google Scholar]
- Liberman MC. The cochlear frequency map for the cat: Labeling auditory-nerve fibers of known characteristic frequency. J Acoust Soc Am. 1982a;72(5):1441–1449. doi: 10.1121/1.388677. [DOI] [PubMed] [Google Scholar]
- Liberman MC. Single-neuron labeling in the cat auditory nerve. Science. 1982b;216:1239–1241. doi: 10.1126/science.7079757. [DOI] [PubMed] [Google Scholar]
- Liberman MC. Central projections of auditory nerve fibers of differing spontaneous rate, I: Anteroventral cochlear nucleus. Journal of Comparative Neurology. 1991;313:240–258. doi: 10.1002/cne.903130205. [DOI] [PubMed] [Google Scholar]
- Liberman MC, Dodds LW, Pierce S. Afferent and efferent innervation of the cat cochlea: quantitative analysis with light and electron microscopy. The Journal of comparative neurology. 1990;301:443–60. doi: 10.1002/cne.903010309. [DOI] [PubMed] [Google Scholar]
- Liu C, Glowatzki E, Fuchs PA. Unmyelinated type II afferent neurons report cochlear damage. Proceedings of the National Academy of Sciences of the United States of America. 2015;112:14723–7. doi: 10.1073/pnas.1515228112. [DOI] [PMC free article] [PubMed] [Google Scholar]
- Liu Q, Lee E, Davis RL. Heterogeneous intrinsic excitability of murine spiral ganglion neurons is determined by Kv1 and HCN channels. Neuroscience. 2014;257:96–110. doi: 10.1016/j.neuroscience.2013.10.065. [DOI] [PMC free article] [PubMed] [Google Scholar]
- Makary CA, Shin J, Kujawa SG, Liberman MC, Merchant SN. Age-related primary cochlear neuronal degeneration in human temporal bones. Journal of the Association for Research in Otolaryngology : JARO. 2011;12:711–7. doi: 10.1007/s10162-011-0283-2. [DOI] [PMC free article] [PubMed] [Google Scholar]
- Merchan-Perez A, Liberman MC. Ultrastructural differences among afferent synapses on cochlear hair cells: correlations with spontaneous discharge rate. The Journal of comparative neurology. 1996;371:208–21. doi: 10.1002/(SICI)1096-9861(19960722)371:2<208::AID-CNE2>3.0.CO;2-6. [DOI] [PubMed] [Google Scholar]
- Ottersen OP, Takumi Y, Matsubara A, Landsend AS, Laake JH, Usami S. Molecular organization of a type of peripheral glutamate synapse: the afferent synapses of hair cells in the inner ear. Progress in neurobiology. 1998;54:127–48. doi: 10.1016/s0301-0082(97)00054-3. [DOI] [PubMed] [Google Scholar]
- Sheets L, Kindt KS, Nicolson T. Presynaptic CaV1.3 channels regulate synaptic ribbon size and are required for synaptic maintenance in sensory hair cells. The Journal of neuroscience : the official journal of the Society for Neuroscience. 2012;32:17273–86. doi: 10.1523/JNEUROSCI.3005-12.2012. [DOI] [PMC free article] [PubMed] [Google Scholar]
- Shnerson A, Pujol R. Age-related changes in the C57BL/6J mouse cochlea. I. Physiological findings. Brain research. 1981a;254:65–75. doi: 10.1016/0165-3806(81)90059-6. [DOI] [PubMed] [Google Scholar]
- Shnerson A, Devigne C, Pujol R. Age-related changes in the C57BL/6J mouse cochlea. II. Ultrastructural findings. Brain research. 1981b;254:77–88. doi: 10.1016/0165-3806(81)90060-2. [DOI] [PubMed] [Google Scholar]
- Simmons DD, Liberman MC. Afferent innervation of outer hair cells in adult cats: I. Light microscopic analysis of fibers labeled with horseradish peroxidase. J. Comp. Neurol. 1988;270:132–144. doi: 10.1002/cne.902700111. [DOI] [PubMed] [Google Scholar]
- Sobkowicz HM, Rose JE, Scott GL, Levenick CV. Distribution of synaptic ribbons in the developing organ of Corti. Journal of neurocytology. 1986;15:693–714. doi: 10.1007/BF01625188. [DOI] [PubMed] [Google Scholar]
- Spoendlin H. Innervation patterns in the organ of corti of the cat. Acta Otolaryngol. 1969;67:239–54. doi: 10.3109/00016486909125448. [DOI] [PubMed] [Google Scholar]
- Stamataki S, Francis HW, Lehar M, May BJ, Ryugo DK. Synaptic alterations at inner hair cells precede spiral ganglion cell loss in aging C57BL/6J mice. Hear Res. 2006;221:104–18. doi: 10.1016/j.heares.2006.07.014. [DOI] [PubMed] [Google Scholar]
- Uziel A, Romand R, Marot M. Development of cochlear potentials in rats. Audiology : official organ of the International Society of Audiology. 1981;20:89–100. doi: 10.3109/00206098109072687. [DOI] [PubMed] [Google Scholar]
- Weisz CJ, Glowatzki E, Fuchs PA. Excitability of type II cochlear afferents. The Journal of neuroscience : the official journal of the Society for Neuroscience. 2014;34:2365–73. doi: 10.1523/JNEUROSCI.3428-13.2014. [DOI] [PMC free article] [PubMed] [Google Scholar]
- Wong AB, Jing Z, Rutherford MA, Frank T, Strenzke N, Moser T. Concurrent maturation of inner hair cell synaptic Ca2+ influx and auditory nerve spontaneous activity around hearing onset in mice. The Journal of neuroscience : the official journal of the Society for Neuroscience. 2013;33:10661–6. doi: 10.1523/JNEUROSCI.1215-13.2013. [DOI] [PMC free article] [PubMed] [Google Scholar]
- Wong AB, Rutherford MA, Gabrielaitis M, Pangrsic T, Gottfert F, Frank T, Michanski S, Hell S, Wolf F, Wichmann C, Moser T. Developmental refinement of hair cell synapses tightens the coupling of Ca2+ influx to exocytosis. The EMBO Journal. 2014;33:247–264. doi: 10.1002/embj.201387110. [DOI] [PMC free article] [PubMed] [Google Scholar]
- Yin Y, Liberman LD, Maison SF, Liberman MC. Olivocochlear innervation maintains the normal modiolar-pillar and habenular-cuticular gradients in cochlear synaptic morphology. Journal of the Association for Research in Otolaryngology : JARO. 2014;15:571–83. doi: 10.1007/s10162-014-0462-z. [DOI] [PMC free article] [PubMed] [Google Scholar]


