Abstract
Isobaric labeling is a powerful strategy for quantitative mass spectrometry-based proteomic investigations. A complication of such analyses has been the co-isolation of multiple analytes of similar mass-to-charge resulting in the distortion of relative protein abundance measurements across samples. When properly implemented, triple-stage mass spectrometry and synchronous precursor selection (SPS-MS3) can reduce the occurrence of this phenomena, referred to as ion interference. However, no diagnostic tool is available currently to rapidly and accurately assess ion interference. To address this need, we developed a multiplexed TMT-based standard, termed the triple knockout (TKO). This standard is comprised of three yeast proteomes in triplicate, each from a strain deficient in a highly abundant protein (Met6, Pfk2, or Ura2). The relative abundance patterns of these proteins, which can be inferred from dozens of peptide measurements, are representative of ion interference in peptide quantification. We expect no signal in channels where the protein is knocked out, permitting maximum sensitivity for measurements of ion interference against a null background. Here, we emphasize the need to investigate further ion interference-generated ratio distortion and promote the TKO standard as a tool to investigate such issues.
Keywords: MS standard, MuiltiNotch, TMT, Orbitrap Fusion, Lumos, ion interference
Graphical abstract

Introduction
Quantitative mass spectrometry-based proteomic strategies employing multiplexed isobaric labels are rapidly becoming a standard means of determining global protein abundances [1-3]. Isobaric tandem mass tag (TMT) reagents can be used to quantify protein abundances from 2 to 10 samples regardless of origin (i.e., cell culture, tissue, body fluids) in a single multiplexed experiment. Each sample is differentially labeled such that when pooled, the signal-to-noise values of sample-specific reporter ions represent the relative abundance of each protein. A limitation of isobaric tag-based proteomic strategies is ion interference-related ratio distortion resulting from fragmentation and analysis of background ions co-isolated with those of interest -a phenomenon generally observed in MS2-based isobaric label quantification [4]. In a background where most proteins are unaltered, this ion interference can mask subtle differences, thereby decreasing the likelihood of observing significant protein alterations. Recent developments of an MS3 method [4] and the use of a multi-notch waveform allowing for the isolation of multiple precursor ions from the MS2 scan - a process termed synchronous precursor selection (SPS) [5] - have been successful in alleviating the drawbacks of ion interference on Orbitrap Fusion mass spectrometers. However, hitherto no quantitative assessment tool can reliably and efficiently detect ion interference-related issues.
Herein, we describe a novel peptide standard that is simple to construct, yet affords high sensitivity for detecting issues which may arise due to interference from co-isolated ions. We designed a TMT-based multiplexed standard in which highly abundant proteins are absent in select channels. As such, we can assess the degree of ion interference by the level of TMT signal detected in channels where a specific protein should be absent. We chose yeast whole cell lysate as our proteome of interest because it is relatively complex and genetic knockouts are easy to construct or obtain. We selected three deletions strains from the Yeast Deletion Collection [6-8] that lacked the ability to express either Met6, Pfk2 or Ura2. Met6 is a cobalamin-independent methionine synthase that is involved in methionine biosynthesis and regeneration [9]. Pfk2 is the beta subunit of phosphofructokinase that partakes in glycolysis [10]. Ura2 is bifunctional enzyme demonstrating both carbamoylphosphate synthetase and aspartate transcarbamylase activity, which catalyzes the first two enzymatic steps in pyrimidine biosynthesis [11]. Although these proteins have important cellular roles and are highly abundant, their functions are compensated by other proteins, thereby enabling the viability of these deletion strains. Finally, the TKO standard is designed so that each of the three deletion strains is labeled in triplicate using TMT reagents, to produce a TMT9-plex sample [12, 13].
We assessed the TMT signal of the selected TKO peptides and associated proteins which are absent in 3 of the 9 channels. The detected TMT signal should approach zero in channels where that particular protein is knocked out. However, the presence of signal in the designated “knockout” channels indicates instrumental noise and/or ion interference, which when minimized is indicative of an optimally operating instrument. Thus, the TKO standard is unique as a negative control against ion interference.
Methods
We chose Saccharomyces cerevisae strains from the haploid MATalpha collection (BY4742 MATα his3Δ1 leu2Δ0 lys2Δ0 ura3Δ0). Cultures were grown in standard yeast-peptone-dextrose (YPD) media to an optical density (OD) of 0.6/mL and then harvested. Cell lysis, protein digestion, and tandem mass tag (TMT) labeling of the yeast cultures were performed as described previously [12, 14]. Very briefly, cells were lysed via bead beating in 8 M urea. Proteins were chloroform-methanol precipitated and digested with LysC overnight and trypsin for 6 hrs. Peptides were labeled with TMT10-plex reagents, such that peptides from the Δmet6 strain replicates were conjugated to tags 126, 127N, 127C, the Δpfk2 strain replicates with tags 128N, 128C, 129N, and the Δura2 strain replicates with tags 129C, 130N, 130C. The sample was mixed, desalted via SepPak, and dried via vacuum centrifugation. The sample was reconstituted in 5% acetonitrile and 5% formic acid for LC-MS/MS processing. For each analysis, 0.1-1 μg of the TKO standard was loaded onto the C18 capillary column using a Proxeon NanoLC-1000 UHPLC. Mass spectrometric data were collected on an Orbitrap Fusion or Lumos mass spectrometer, as described previously [15], but with no off-line fractionation and analyzed with only 45 min liquid chromatography gradients. Mass spectra were processed with a SEQUEST-based in-house software pipeline [16]. PSMs were identified, quantified, and collapsed to a 1% peptide false discovery rate (FDR) and then collapsed further to a final protein-level FDR of 1% [17, 18]. Proteins and peptides lists with associated TMT signal-to-noise values were exported from our in-house Sequest-based software suite for further analysis in Microsoft Excel, GraphPad Prism, and BoxPlotR [19]. Please refer to Supplementary Material for expanded experimental methods.
Results and Discussion
We describe a diagnostic tool to assess ion interference in isobaric tag-based quantification experiments. Like other standards, the TKO can measure and track informative figures of merit, such as number of peptides (total vs. unique), success rate (MS/MS identified/collected), ion injection times, sum signal-to-noise for reporter ions, and peak width/shape. However, the TKO is unique as it can evaluate the degree of ion interference in isobaric tag-based protein quantification experiments. Previously, a yeast-human two proteome mixture has been used to evaluate ion interference and ratio compression [4]. The TKO standard differs from the two-proteome standard as it detects interference in a complex background by using negative control channels. Our analysis focuses on just 3 proteins, which depending on gradient length, correspond to the measurement of 10 or more peptide-spectral matches per target protein. Little signal should be observed in channels where a protein is knocked out. The presence of unusually high signal in those null channels indicates that quantification measurements are compromised. For example, the selection of multiple SPS ions which are not fragment ions of the sequenced peptide, but rather of a co-eluting peptide, is likely to distort peptide quantification.
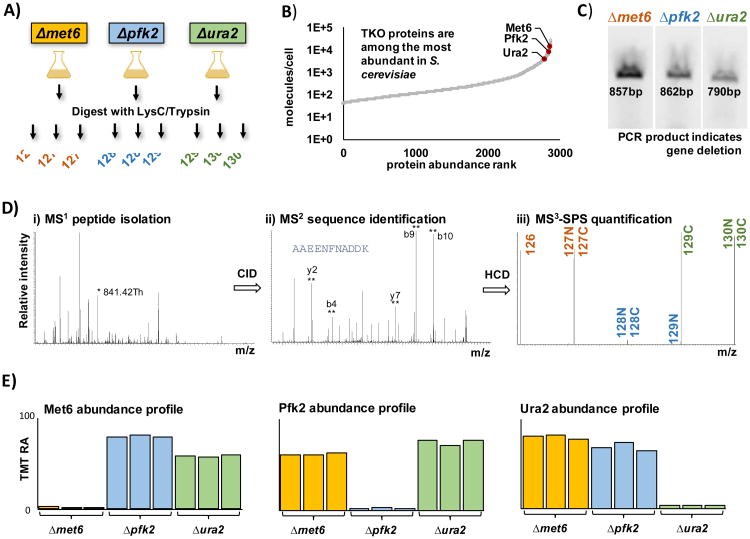
The TKO standard is designed as outlined in Figure 1A. We use TMT10-plex reagents in a 3x3 experimental design, in which 3 different yeast deletion strains are labeled in triplicate. In an effort to limit the analysis time, we chose proteins that are in the top 10% most abundant proteins in yeast [20] and for which several peptides could be identified routinely (Figure 1B). Also, we sought proteins for which their deletion does not affect cell viability and which do not share many tryptic peptides with other proteins in the yeast proteome. This search yielded three proteins - Met6, Pfk2, and Ura2 – which are referred to as the TKO proteins. The three TKO proteins were confirmed by PCR as being deleted in the proper strain (Figure 1C). We illustrate the workflow for an MS3 analysis of the TKO standard in Figure 1D, highlighting i) peptide isolation in the MS1 stage, ii) sequence identification in the M2 stage, and iii) peptide quantification via SPS ions in the MS3 stage. MS3 data represent protein expression patterns that reflect the degree of incorrect quantification as the signal erroneously attributed to the absent protein in each channel. Figure 1E shows an example of the protein expression profiles for Met6, Pfk2, and Ura2 on an instrument that is exhibiting minimal ion interference. Here, we normalize the data to the average value of the three knockout channels and we plot the summed signal-to-noise ratio for the TMT reporter ions. As mentioned earlier, some noise is present in almost all TMT channels, thus the ratio of the relative abundance of a TKO protein in the knockout to that in the non-knockout samples will not be zero, as predicted theoretically.
Figure 1. Characteristics of the TKO standard.
A) TMT-labeling strategy for the preparation of the TKO standard. The three deletion stains of high abundant proteins were digested with LysC/trypsin and the protein samples in triplicate were subsequently labeled with TMT. B) Yeast protein abundance curve based on Chong, et al [20] showing the highly abundant, three TKO proteins: Met6, Pfk2, and Ura2. C) PCR validation of the deletion strains for the genes encoding the knocked out proteins of interest using standard KanC and D primer sets (Integrated DNA Technologies) from the Saccharomyces deletion project. The amplified bands are derived from the sequence spanning from an internal region of the KanMX cassette, which replaces the genes of interest into its 3′ untranslated regions. D) SPS-MS3 method which includes i) peptide isolation (*=selected peptide), ii) sequence identification (**=selected SPS fragments), and iii) peptide quantification via SPS ions. E) Bar chart representation of the TMT relative abundance values for each of the three TKO proteins. TMT, tandem mass tag; RA, relative abundance; KO, knockout.
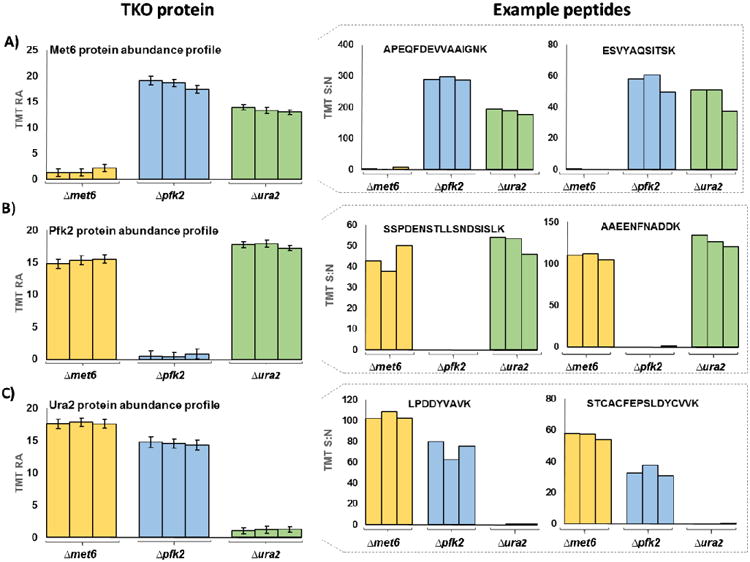
As the TKO proteins are highly abundant, on-line liquid chromatography fractionation of 45 min or less are sufficient to quantify at least 10 peptides each from Met6, Pfk2, and Ura2 per 1 μg injection. In Table 1, we tally the proteins and peptides identified for three analyses (1 μg of TMT standard analyzed across a 45 min gradient) on Orbitrap Fusion and Orbitrap Fusion Lumos mass spectrometers. Moreover, we illustrate the protein abundance profiles for Met6 (Figure 2 A), Pfk2 (Figure 2 B), and Ura2 (Figure 2 C) for this analysis. The ability to observe these proteins in a single, short, data-dependent analysis reveals that longer data collection times and/or more complex methods, such as targeted assays, are unnecessary for adequate analysis of the TKO standard as a benchmark of instrument performance.
Table 1.
Typical protein and peptide tally following 45 min of data collection on Orbitrap Fusion and Fusion Lumos mass spectrometers for a 1μg injection of the TKO standard.
| Instrument | replicate | No. of PSMs a | Sequence coverage b | |||||
|---|---|---|---|---|---|---|---|---|
|
| ||||||||
| total | Met6 | Pfk2 | Ura2 | Met6 | Pfk2 | Ura2 | ||
| Fusion | A | 3369 | 23 | 14 | 19 | 24.1 | 12.9 | 7.3 |
| B | 3731 | 24 | 11 | 17 | 28.1 | 10.3 | 7.4 | |
| C | 3295 | 17 | 16 | 19 | 17.2 | 15.9 | 7.9 | |
|
| ||||||||
| Fusion Lumos | A | 4272 | 24 | 20 | 26 | 28.4 | 19.9 | 10 |
| B | 4316 | 26 | 21 | 23 | 33.1 | 19.3 | 8.2 | |
| C | 4272 | 22 | 20 | 25 | 24.7 | 18.4 | 9.1 | |
No. of PSMs refers to the number of peptide-spectral matches identified.
Sequence coverage is the percentage of a protein's amino acids.
Figure 2. Example protein and peptide level TKO data.

The TMT percent relative abundance (%RA) across the nine channels is displayed for A) Met6, B) Pfk2, and C) Ura2. For each protein, the TMT summed signal-to-noise (S:N) of two example peptides are shown on the right. Error bars for the protein abundance profiles represent the standard error of the mean (S.E.M.) for three, 45-min analyses. TMT, tandem mass tag; RA, relative abundance; S:N, signal-to-noise.
Although a plethora of scores have been developed for protein identification (reviewed in [21]), no equivalent scoring systems are regularly employed that can also assess the accuracy and precision of protein quantification. In the Multi-Notch (SPS-MS3) method, peptides are sequenced at the MS2 level, while quantification is based on data collected by MS3; ergo, a disconnect is inherent between protein identification and quantification. Namely, proper quantification is reliant on the correct selection and precise isolation of fragment ions (i.e., SPS ions). As such, the prevalence of interference may distort ratios via quantification of TMT fragment ions from co-isolated peptides. Poor performance of the SPS-based MS3 method, may be a consequence of many factors, including, but not limited to, SPS ion selection, sample complexity, and functional status of the instrument. In fact, as instrument may pass all calibration evaluations and generate pristine MS2 spectra, but still produce poor relative abundance ratios for SPS- MS3 quantification.
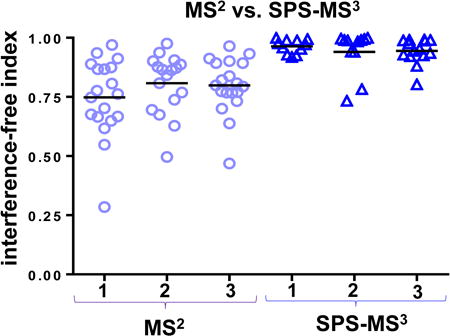
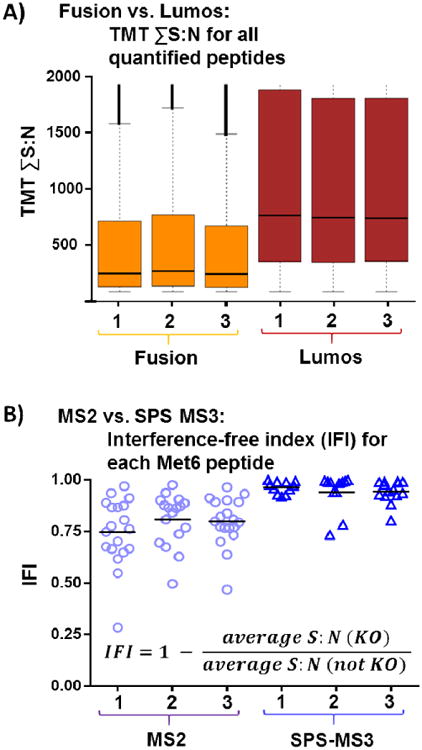
We illustrate two applications of the TKO standard to demonstrate its versatility (Figure 3). First, we show that the TKO standard can be used as a benchmark between different instrument platforms. Approximately 0.1 μg was analyzed over a 45 min method resulting in median ion injection times approaching the set limit of 150ms. We observe an increase approaching 4-fold for the average summed signal-to-noise (S:N) of peptides quantified on a Fusion Lumos compared to a Fusion Classic mass spectrometer (Figure 3A). Second, we can use the TKO to compare ion interference between MS2 and SPS-MS3-based peptide quantification (Figure 3B). As an example, we examine all peptides from Met6 acquired from a single TKO run. For each peptide, we calculate an interference-free index (IFI) as the difference from one of the average TMT signal-to-noise value from the KO channels (for Met6: 126, 127N, and 127C) divided by the average TMT signal-to-noise of the other six channels (Figure 3B inset). As such, a score of 1 reflects no interference, while a score of 0 or less would indicate equal or greater signal for a given TKO peptide in the KO channel than the non-KO channel, in other words, greater interference. This plot for Met6 shows that SPS-MS3 analysis results in less ion interference than MS2-only TMT quantification. Also noteworthy is that the data points for the MS2 analysis are more widely distributed than those of the SPS-MS3 analysis, indicative of the contribution of interference from co-isolated peptide of varying intensities. Although SPS-MS3 greatly reduces ion interference [5] - with estimates of less than 5% interference remaining (Figure 3B) -occasionally co-eluting ions are chosen as SPS ions and so further methodological and technical improvements will be required to overcome this caveat. Therein lies the need for the TKO standard, a diagnostic that can assay for the absence, rather than presence, of signal in specific channels in a complex peptide background.
Figure 3. Example applications of the TKO standard.

A) Box-and-whiskers plot comparing the increase in signal-to-noise measurements between two mass spectrometer platforms. B) Box-and-whiskers plot illustrates all quantified Met6 peptides to assess interference between MS2-only and SPS-MS3 TMT quantification.
Conclusions and Future Directions
The quality of data generated by state-of-the-art mass spectrometers is highly contingent on consistent performance, necessitating frequent and reliable benchmarking. We introduce the TKO standard as a tool for demonstrating ion interference in isobaric tag-based multiplexed proteomic experiments. Preparation of the TKO standard requires merely standard protein extraction methodology and TMT labeling, and does not require synthetic peptides or multiple proteomes, which can complicate sample preparation and data analysis. Further application of this standard for investigating ion interference may include optimizing isolation windows at the MS2 and MS3 levels, defining signal-to-noise cutoffs, as well as determining the ideal number of SPS ions (i.e., minimizing incorrect SPS ion selection, while maximizing the reporter ion signal-to-noise levels). Other versions of the TKO using low or moderately abundant proteins would be value to assess to what degree interference is a function of abundance, but would may require longer runs or targeted analysis. Although the TKO standard will not solve the interference problem, it can accurately and sensitively measure its effects. As such, using the TKO standard can help isolate the idiosyncratic factors influencing interference and guide data collection parameter optimization in efforts to alleviate interference.
Supplementary Material
Acknowledgments
We would like to thank the members of the Gygi Lab at Harvard Medical School for invaluable discussion, particularly Robert A. Everley. This work was funded in part by an NIH/NIDDK grant K01 DK098285 (J.A.P.) and GM97645 (S.P.G.).
References
- 1.Dayon L, Hainard A, Licker V, Turck N, Kuhn K, Hochstrasser DF, et al. Relative quantification of proteins in human cerebrospinal fluids by MS/MS using 6-plex isobaric tags. Anal Chem. 2008;80:2921–2931. doi: 10.1021/ac702422x. [DOI] [PubMed] [Google Scholar]
- 2.Thompson A, Schafer J, Kuhn K, Kienle S, Schwarz J, Schmidt G, et al. Tandem mass tags: a novel quantification strategy for comparative analysis of complex protein mixtures by MS/MS. Analytical chemistry. 2003;75:1895–1904. doi: 10.1021/ac0262560. [DOI] [PubMed] [Google Scholar]
- 3.Ross PL, Huang YN, Marchese JN, Williamson B, Parker K, Hattan S, et al. Multiplexed protein quantitation in Saccharomyces cerevisiae using amine-reactive isobaric tagging reagents. Molecular & cellular proteomics : MCP. 2004;3:1154–1169. doi: 10.1074/mcp.M400129-MCP200. [DOI] [PubMed] [Google Scholar]
- 4.Ting L, Rad R, Gygi SP, Haas W. MS3 eliminates ratio distortion in isobaric multiplexed quantitative proteomics. Nat Methods. 2011;8:937–940. doi: 10.1038/nmeth.1714. [DOI] [PMC free article] [PubMed] [Google Scholar]
- 5.McAlister GC, Nusinow DP, Jedrychowski MP, Wuhr M, Huttlin EL, Erickson BK, et al. MultiNotch MS3 enables accurate, sensitive, and multiplexed detection of differential expression across cancer cell line proteomes. Anal Chem. 2014;86:7150–7158. doi: 10.1021/ac502040v. [DOI] [PMC free article] [PubMed] [Google Scholar]
- 6.Winzeler EA, Shoemaker DD, Astromoff A, Liang H, Anderson K, Andre B, et al. Functional characterization of the S. cerevisiae genome by gene deletion and parallel analysis. Science. 1999;285:901–906. doi: 10.1126/science.285.5429.901. [DOI] [PubMed] [Google Scholar]
- 7.Chu AM, Davis RW. High-throughput creation of a whole-genome collection of yeast knockout strains. Methods Mol Biol. 2008;416:205–220. doi: 10.1007/978-1-59745-321-9_14. [DOI] [PubMed] [Google Scholar]
- 8.Baudin A, Ozier-Kalogeropoulos O, Denouel A, Lacroute F, Cullin C. A simple and efficient method for direct gene deletion in Saccharomyces cerevisiae. Nucleic Acids Res. 1993;21:3329–3330. doi: 10.1093/nar/21.14.3329. [DOI] [PMC free article] [PubMed] [Google Scholar]
- 9.Masselot M, De Robichon-Szulmajster H. Methionine biosynthesis in Saccharomyces cerevisiae. I. Genetical analysis of auxotrophic mutants. Mol Gen Genet. 1975;139:121–132. doi: 10.1007/BF00264692. [DOI] [PubMed] [Google Scholar]
- 10.Parmar L, Lobo Z, Nadkarni M, Maitra PK. Multiple genes control particulate phosphofructokinase of yeast. Mol Gen Genet. 1984;197:515–516. doi: 10.1007/BF00329953. [DOI] [PubMed] [Google Scholar]
- 11.Lacroute F. Regulation of pyrimidine biosynthesis in Saccharomyces cerevisiae. J Bacteriol. 1968;95:824–832. doi: 10.1128/jb.95.3.824-832.1968. [DOI] [PMC free article] [PubMed] [Google Scholar]
- 12.Paulo JA, Gygi SP. A comprehensive proteomic and phosphoproteomic analysis of yeast deletion mutants of 14-3-3 orthologs and associated effects of rapamycin. Proteomics. 2015;15:474–486. doi: 10.1002/pmic.201400155. [DOI] [PMC free article] [PubMed] [Google Scholar]
- 13.Paulo JA, McAllister FE, Everley RA, Beausoleil SA, Banks AS, Gygi SP. Effects of MEK inhibitors GSK1120212 and PD0325901 in vivo using 10-plex quantitative proteomics and phosphoproteomics. Proteomics. 2015;15:462–473. doi: 10.1002/pmic.201400154. [DOI] [PMC free article] [PubMed] [Google Scholar]
- 14.Paulo JA, O'Connell JD, Gaun A, Gygi SP. Proteome-wide quantitative multiplexed profiling of protein expression: Carbon source dependency in S. cerevisiae. Mol Biol Cell. 2015 doi: 10.1091/mbc.E15-07-0499. [DOI] [PMC free article] [PubMed] [Google Scholar]
- 15.Paulo JA, Gaun A, Gygi SP. Global analysis of protein expression and phosphorylation levels in nicotine-treated pancreatic stellate cells. J Proteome Res. 2015 doi: 10.1021/acs.jproteome.5b00398. [DOI] [PMC free article] [PubMed] [Google Scholar]
- 16.Huttlin EL, Jedrychowski MP, Elias JE, Goswami T, Rad R, Beausoleil SA, et al. A tissue-specific atlas of mouse protein phosphorylation and expression. Cell. 2010;143:1174–1189. doi: 10.1016/j.cell.2010.12.001. [DOI] [PMC free article] [PubMed] [Google Scholar]
- 17.Elias JE, Gygi SP. Target-decoy search strategy for mass spectrometry-based proteomics. Methods Mol Biol. 2010;604:55–71. doi: 10.1007/978-1-60761-444-9_5. [DOI] [PMC free article] [PubMed] [Google Scholar]
- 18.Elias JE, Gygi SP. Target-decoy search strategy for increased confidence in large-scale protein identifications by mass spectrometry. Nat Methods. 2007;4:207–214. doi: 10.1038/nmeth1019. [DOI] [PubMed] [Google Scholar]
- 19.Krzywinski M, Altman N. Visualizing samples with box plots. Nat Methods. 2014;11:119–120. doi: 10.1038/nmeth.2813. [DOI] [PubMed] [Google Scholar]
- 20.Chong YT, Koh JL, Friesen H, Duffy SK, Cox MJ, Moses A, et al. Yeast Proteome Dynamics from Single Cell Imaging and Automated Analysis. Cell. 2015;161:1413–1424. doi: 10.1016/j.cell.2015.04.051. [DOI] [PubMed] [Google Scholar]
- 21.Ryu SY. Bioinformatics tools to identify and quantify proteins using mass spectrometry data. Adv Protein Chem Struct Biol. 2014;94:1–17. doi: 10.1016/B978-0-12-800168-4.00001-9. [DOI] [PubMed] [Google Scholar]
Associated Data
This section collects any data citations, data availability statements, or supplementary materials included in this article.


