Abstract
To investigate whether gut microbiota is associated with vitamin A nutritional levels in children with persistent diarrhea, a total of 59 pediatric patients with persistent diarrhea aged 1–12 months were selected from the Department of Gastroenterology at the Children’s Hospital of Chongqing Medical University, China. Subjects were hospitalized and divided into VA-deficient (n = 30) and VA-normal (n = 29) groups according to their venous serum retinol levels. Fecal samples from all 59 subjects were collected immediately after admission and analyzed by Illumina MiSeq for 16S rRNA genes to characterize the overall microbiota of the samples. The gut microbiota of the VA-deficient and VA-normal groups were compared using a bioinformatic statistical approach. The Shannon index (p = 0.02), Simpson index (p = 0.01) and component diagram data indicated significantly lower diversity in the VA-deficient than the VA-normal group. A metagenome analysis (LEfSe) and a differentially abundant features approach using Metastats revealed that Escherichia coli and Clostridium butyricum were the key phylotypes of the VA-normal group, while Enterococcus predominated the VA-deficient group. In conclusion, the diversity of gut microbiota and the key phylotypes are significantly different in children with persistent diarrhea at different VA nutritional levels.
Keywords: vitamin A deficiency (VAD), gut microbiota, key phylotype, persistent diarrhea (PD), children
Introduction
Diarrhea is the second leading cause of death of children in developing countries and contributes to 1.5–2.5 million deaths annually in children under the age of 5.(1,2) Diarrhea lasting more than 14 days is known as persistent diarrhea (PD) or chronic diarrhea. In 3–19% of diarrheal patients, acute onset is followed by a persistence of 14 or more days.(3) PD is associated with over 50% of diarrhea-related deaths in developing countries.(4) PD has multiple causes including infection, protein-energy malnutrition, allergy, and dietary intolerance.(5,6) Infection with bacterial pathogens and damage to the intestinal barrier has been incriminated as the central mechanisms in PD.(7,8)
Vitamin A deficiency (VAD), a major nutritional concern, is considered a global public health issue by UNICEF and the WHO.(9) Increased episodes of diarrhea are correlated with a higher prevalence of VAD. Qiu et al.(10) reported that the rate of VAD in children with diarrhea was 2.37-fold higher than that in normal children. Furthermore, vitamin A (VA) supplementation decreased diarrheal morbidity and mortality in children.(11–14) The popularity of VA supplementation has significantly decreased the hospitalization rate of children with PD in Bangladesh.(15) Nevertheless, the mechanism explaining how VA supplementation treats PD remains unclear.
Our previous study found that 81.89% of 127 children with PD had VAD; 94.49% had microbiota dysbiosis; and 78.74% had both VAD and microbiota dysbiosis.(16) A survey in India indicated that VAD is an independent risk factor for PD.(17) Amit-Romach et al.(18) also showed that a VAD diet increased the total amount of bacteria in the gastrointestinal tract of rats and altered their intestinal microbiota. However, few reports have correlated the level of VA with the gut microbiota of children with PD. Our current study examines the changes in the gut microbiota of children with PD at different VA blood levels and the key phylotypes that might explain these differences.
Materials and Methods
Subjects and sample collection
A total of 59 children with PD aged 1–12 months were recruited from the Department of Gastroenterology in the Children’s Hospital of Chongqing Medical University, China. Clinical history, venous blood and fecal samples were obtained immediately after admission. All subjects were HIV-negative and without serious heart, liver, kidney, or blood diseases. Stool samples were collected from all patients with PD without probiotic treatment. The sample size of the present study was calculated according to the computational formula of n1 = n2 =
We found that the ratio of microbiota dysbiosis in the VAD children with PD was 81% (p1) and 41% in the VAN children with PD (p2);(16) thus p = (p1 + p2)/2 = 0.606. If α = 0.05, β = 0.10, then n1 = n2 = 29.44 after applying the above formula. The current study was approved by the Ethics Committee of Children’s Hospital of Chongqing Medical University, China (Approval No. 008/2013), and documented written informed consent was obtained from the parents or guardians of all study participants.
Diagnostic criteria
All patients met the diagnostic criteria for PD.(19) Malnutrition was defined based on anthropometric measurements that fell below 2 standard deviations of the normal weight-for-age (underweight), height-for-age (stunting) or weight-for-height (wasting) values.(20) Allergy was diagnosed by skin testing and food-specific serum IgE.(21) A serum retinol level of 0.7 µmol/L is the classic clinical human limit based on high-performance liquid chromatography (HPLC). According to the WHO standard, serum retinol levels >0.7 µmol/L indicate a normal VA level; levels <0.7 µmol/L indicate a VA deficiency. In the current study, therefore, we divided the 59 patients with PD into the two groups of VAN (n = 29) and VAD (n = 30) according to the WHO standard (http://apps.who.int/iris/bitstream/10665/44110/1/9789241598019_eng.pdf).
Serum retinol detection
Human blood was collected to detect serum retinol levels using HPLC following a previously described method(22,23) with slight modifications. Briefly, the residue was dissolved in a 0.1-ml mobile phase. A portion (20 µl) of the sample was injected into a column installed with the HPLC apparatus (SHIMADZU, Tokyo, Japan). The mobile phase was a methanol- distilled H2O mixture (97:3). The retinol concentration was determined using spectrophotometry at 315 nm. All procedures were performed by the same operator in a dark room to protect the serum from light.
DNA extraction and PCR amplification
Microbial DNA was extracted from the fecal samples (5 g) using the E.Z.N.A.® DNA Kit (Omega Bio-tek, Norcross, GA) according to the manufacturer’s instructions. Successful DNA isolation was confirmed by 1% agarose gel electrophoresis.
Before sequencing, each DNA sample was amplified with a set of primers targeting the hypervariable V4–V5 region of the bacterial 16S ribosomal RNA gene. Specific primers were 515F 5'-barcode-GTGCCAGCMGCCGCGG-3' and 907R 5'-CCG TCAATTCMTTTRAGTTT-3', where the barcode was an eight-base sequence unique to each sample. PCR reactions were conducted in triplicate with a 20 µl reaction system containing 4 µl of 5 × FastPfu Buffer, 2 µl of 2.5 mM dNTPs, 0.8 µl of each Primer (5 µM), 0.4 µl of FastPfu Polymerase and 10 ng of template DNA. The amplification program was performed under the following conditions: 95°C for 2 min, followed by 25 cycles at 95°C for 30 s, 55°C for 30 s and 72°C for 30 s and a final extension of 72°C for 5 min.
Illumina MiSeq sequencing
After extraction from 2% agarose gels, amplicons were purified using the AxyPrep DNA Gel Extraction Kit (Axygen Biosciences, Union City, CA) according to the manufacturer’s instructions and quantified using QuantiFluorTM-ST (Promega, Madison, US). Purified amplicons were pooled in equimolar ratios and paired-end sequenced (2 × 250) on an Illumina MiSeq platform,(24) which was conducted by Majorbio Bio-Pharm Technology Co., Ltd. (Shanghai, China). The raw reads were deposited into the NCBI Sequence Read Archive (SRA) database (Accession No.: SRP055873).
Bioinformatic analysis
Raw fastq files were quality-filtered using QIIME(25) with the following criteria: (1) The 250 bp reads were truncated at any site receiving an average quality score <20 over a 10 bp sliding window, discarding the truncated reads that were shorter than 50 bp; (2) Exact barcode matching, 2 nucleotide mismatch in primer matching, and reads containing ambiguous characters were removed; (3) Only sequences that overlapped longer than 10 bp were assembled according to their overlap sequence. Reads that could not be assembled were discarded.
After cumulative sum scaling normalization and zero correction being performed, sets of sequences with 97% identity were clustered into an operational taxonomic unit (OTU) using UPARSE (ver. 7.1 http://drive5.com/uparse/). OTUs that reached 97% similarity level were used for community richness (Chao), community diversity (Shannon, Simpson), rarefaction curve analysis, and Shannon-Wiener curve analysis using Mothur (ver. 1.30.1 http://www.mothur.org).(26) An unweighted UniFrac distance metrics analysis using the OTUs,(27) a principal component analysis (PCA) and a permutational MANOVA based on the matrix variable of PCA were applied to reflected the differences and distances among the 59 samples. To more effectively distinguish between the two groups, a partial least-squares discriminant analysis (PLS-DA) was conducted using the mixOmics package.
To obtain species classification information for each OTU, the Ribosomal Database Project (RDP) classifier(28) was utilized to perform a taxonomic analysis in accordance with the Silva (SSU115)16S rRNA database at a 70% confidence level. Community structure component diagrams and heatmap figures were generated in accordance with taxonomic information of each sample. Differentially abundant features and false-discovery rate (FDR) analyses were performed using Matastats. In addition, linear discriminant analysis (LDA) effect size (LEfSE) was determined using LEfSE software to determine the community or species that most influenced the group divisions. After acquiring features that were significantly different at various bacterial levels by LEfSe, the non-parametric factorial Kruskal-Wallis (KW) sum-rank test and LDA were performed to determine whether these features were in accordance with the expected behavior of the different bacterial levels.
Statistical analyses
Student’s t test, chi-square test, MANOVA, Spearman’s rank correlation and Kruskal-Wallis test were performed using SPSS ver. 21.0 for Windows. Linear correlation analyses were applied between variables. Significance was accepted at p<0.05.
Results
Comparison between the VAN and VAD groups
The basic medical information for the 59 patients with PD is displayed in Table 1. The average age was 4.9 ± 2.2 months for the VAD group and 5.6 ± 2.8 months for the VAN group. The M:F ratio was 2:1 in the VAD group and 1.2:1 in the VAN group; these differences were not significant (p>0.05). The VAD and VAN groups did not differ significantly with regard to their nutritional status, history of allergies, feeding, antibiotic use times, or duration of diarrhea (see Table 1). Interestingly, the average serum retinol level of the VAD group was 0.51 ± 0.31 µmol/L, which was significantly decreased compared with the VAN group (0.97 ± 0.23 µmol/L) when including the aforementioned potential confounds in a MANOVA (Table 1).
Table 1.
Summary information of subjects
| VAD (n = 30) | VAN (n = 29) | p value | |
|---|---|---|---|
| No. | 30 | 29 | |
| Sex | 0.37† | ||
| Male | 20 | 16 | |
| Female | 10 | 13 | |
| Malnutrition | 0.31† | ||
| Yes | 12 | 8 | |
| No | 18 | 21 | |
| Allergy | 0.36† | ||
| Yes | 14 | 17 | |
| No | 16 | 12 | |
| Feeding | 0.34† | ||
| Breast milk | 7 | 4 | |
| Formula | 14 | 19 | |
| Mixed feeding | 9 | 6 | |
| Antibiotics time | 0.12† | ||
| ≤3 days | 10 | 14 | |
| 3–7 days | 5 | 8 | |
| >7 days | 15 | 7 | |
| Age (months) | 4.9 ± 2.2 | 5.6 ± 2.8 | 0.28‡ |
| PD Duration (days) | 50.9 ± 23.7 | 52.0 ± 24.4 | 0.68‡ |
| Vitamin A (µmol/L) | 0.51 ± 0.13 | 0.97 ± 0.23 | <0.001§ |
Note: †chi-square test, ‡independent-samples t test, §MANOVA.
Reasonable sequences and OTUs
After optimization, a total of 643,749 high-quality sequences were obtained from the 59 samples by MiSeq sequencing. We acquired numerous OTUs from valid sequences showing 97% similarity for further statistical analyses. As shown in Table 2, no significant differences were found in the sequences and OTUs between the VAD and VAN groups.
Table 2.
MANOVA of community features
| Variables | VAD (n = 30) | VAN (n = 29) | Univariate F | p value |
|---|---|---|---|---|
| Reads | 10,911 | 10,911 | 0 | 1 |
| OTUs | 45.6 ± 17.5 | 47.8 ± 25.3 | 0.85 | 0.36 |
| Chao | 60.9 ± 22.9 | 63.8 ± 26.8 | 1.44 | 0.24 |
| Shannon | 1.02 ± 0.63 | 1.36 ± 0.42 | 5.47 | 0.02 |
| Simpson | 0.56 ± 0.27 | 0.40 ± 0.17 | 6.84 | 0.01 |
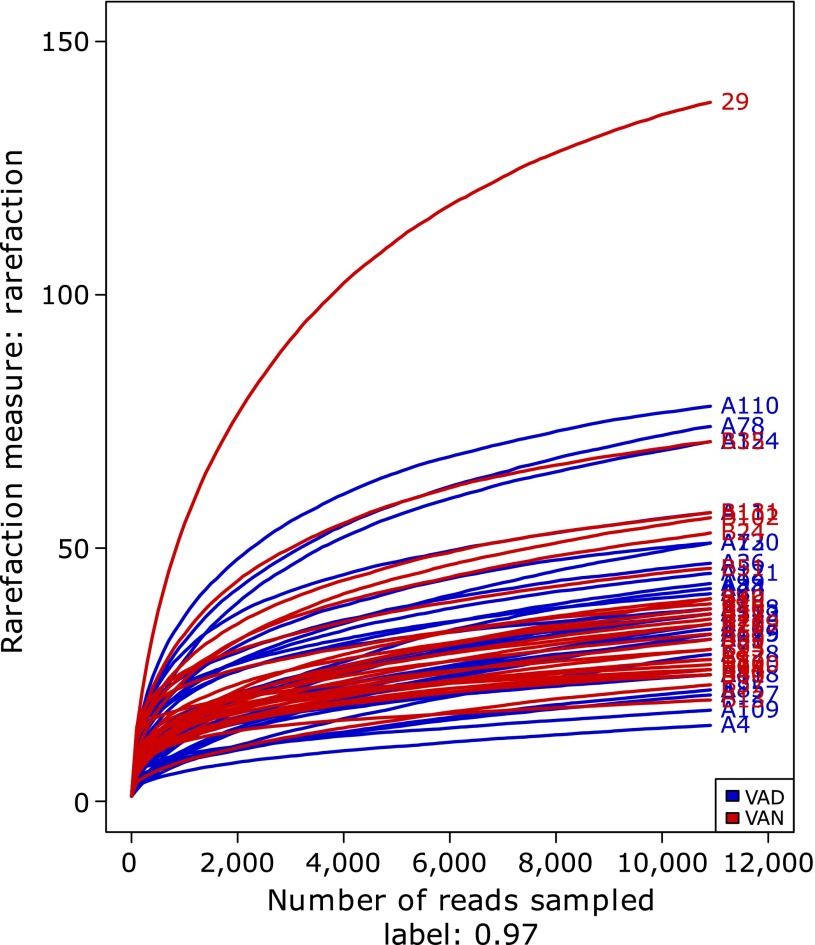
Along with an increase in the amount of sequencing, the rarefaction curves of all the samples shown in Fig. 1 tended to be smooth. The approach of these rarefaction curves to the saturation plateau demonstrates that our sequencing data volume was reasonable for the present study.
Fig. 1.
Rarefaction curves for the VAD and VAN groups of children with PD. Rarefaction curves were calculated at 97% identity OTUs in the gut microbiota of the VAD and VAN groups of PD children by Mothur software. The blue curves represent PD children with VAD, and red curves represent PD children with VAN.
Differences in intestinal microbiota at different levels of VA
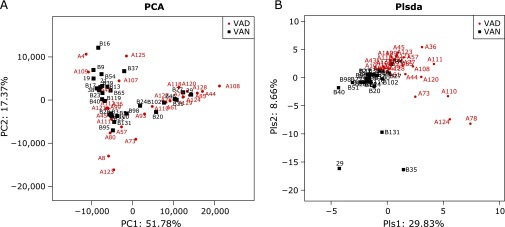
To assess differences in the intestinal microbiota of PD subjects with different VA levels, the unweighted Unifrac distance matrix was calculated according to the OTUs of each sample. Based on the relative abundance of the OTUs, the PCA revealed a separation of the different VA levels based on the first two principal component (PC) scores, accounting for 51.78% and 17.37% of explained variances (Fig. 2A). In addition, we analyzed the matrix variable of PCA using the permutational MANOVA method, and the p value clearly showed a difference between the VAD and VAN groups (p = 0.027). In addition to PCA, the PLS-DA clearly distinguished the VAD and VAN samples based on the direction of the plsda 1 axis, explaining 29.83% of the total variance (Fig. 2B). This segregation suggests the intestinal microbiota of patients with PD significantly differed across disparate VA levels.
Fig. 2.
PCA and PLS-DA. (A) PCA scores were plotted based on the relative abundance of OTUs. (B) PLS-DA was plotted based on the unweighted UniFrac distance metrics. The red circles represent persistent diarrhea (PD) children with VA deficiency (VAD), and blue squares represent PD children with VA normal (VAN).
Higher community diversity in the VAN group
After controlling for the influence of the potential confounds listed in Table 1, a MANOVA was used to compare the VAD and VAN groups with regard to community richness and diversity (Table 2). The Chao estimator did not show a significant difference between the VAD and VAN groups (p = 0.24), suggesting that the community richness was similar for both groups. However, notable differences were observed with regard to the Shannon diversity index (p = 0.02) and the Simpson diversity index (p = 0.01) between the gut microbiota of the VAD and VAN groups. Both diversity indices were correlated with regard to VA according to Spearman’s rank correlation metric (Table 3), further confirming a higher community diversity in the VAN group compared with the VAD group.
Table 3.
Correlations between VA and community diversity
| VA levels | Diversity index | Spearman’s Rho | p value |
|---|---|---|---|
| VA | Shannon | 0.314 | 0.015 |
| VA | Simpson | –0.341 | 0.008 |
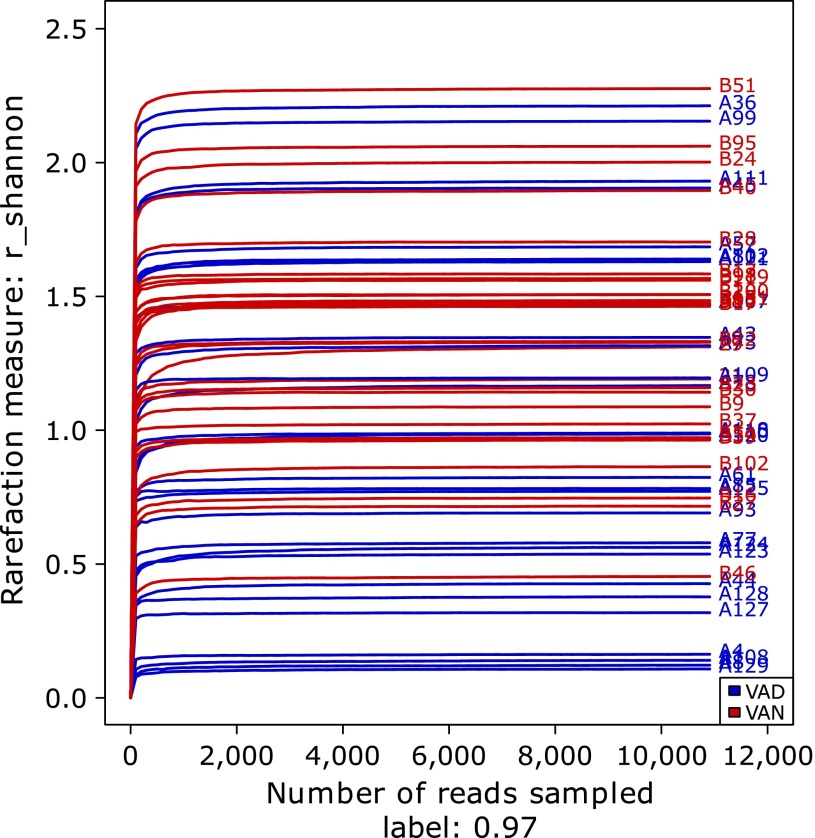
In addition, the Shannon-Wiener curves of the samples were consistent with the above inference (Fig. 3). Although those of the VAD group were relatively scattered, the Shannon curves of samples in the VAN group were generally higher than those of the VAD group. The detailed information for each sample is shown in Supplemental Table 1*.
Fig. 3.
Gut microbiota diversity comparison of the VAD and VAN groups of children with PD via Shannon curves. Shannon curves were obtained using Mothur software. The blue curves represent PD children with VAD, and red curves represent PD children with VAN.
More diversity features of community structure in the VAN group
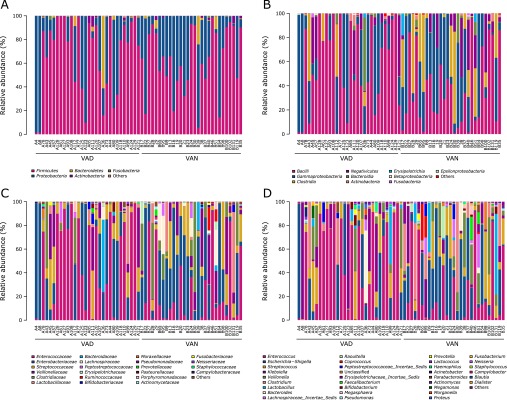
The community structure of the two groups classified by phyla, class, family and genus is shown in Fig. 4. Firmicutes was the predominant phylum, contributing to 68.06% and 62.94% of the gut microbiota in the VAD and VAN groups, respectively, followed by Proteobacteria, which contributed to 28.20% and 34.60%, respectively. Bacteroidetes was the next most dominant phylum, contributing to 2.81% of the VAD group and 1.72% of the VAN group (Fig. 4A). No significant differences were observed between the VAN and VAD groups with regard to the abundances of these three key phylotypes.
Fig. 4.
Relative abundances of the bacterial communities in the gut microbiota of PD children with VAD or VAN levels. The relative abundances of the bacterial communities at the phylum level (A), class level (B), family level (C), and genus level (D). ”Others” represents unclassified bacteria.
A total of 20 and 28 classes of bacteria were found in the VAD and VAN groups, respectively. The dominant classes in the VAD group were Bacilli and Gammaproteobacteria, while the prevailing classes in the VAN group were Bacilli, Gammaproteobacteria and Clostridia. Furthermore, the Bacilli class was highly enriched in the VAD group (56.72%) compared with the VAN group (36.99%; Fig. 4B). At the family level, less variety but more abundant Enterococcaceae were found in the VAD group (43.71%; Fig. 4C). At the genus level, 5 genera accounted for more than 3% of the gut microbiota in VAD: Enterococcus (44.71%), Escherichia-Shigella (14.36%), Klebsiella (11.80%), Streptococcus (10.00%) and Veillonella (6.26%). However, 7 genera accounted for more than 3% of the gut microbiota in the VAN group: Escherichia-Shigella (26.77%), Enterococcus (21.62%), Streptococcus (10.53%), Clostridium (9.95%), Veillonella (8.53%), Klebsiella (5.00%) and Lactobacillus (4.59%). In addition, Escherichia-Shigella was more plentiful in the VAN group, while Enterococcus was more enriched in the VAD group (Fig. 4D).
As the features of community structure at the class, family and genus level of the gut microbiota, there tend to be more diversity in the VAN group than that in the VAD group.
Key phylotypes at different VA levels
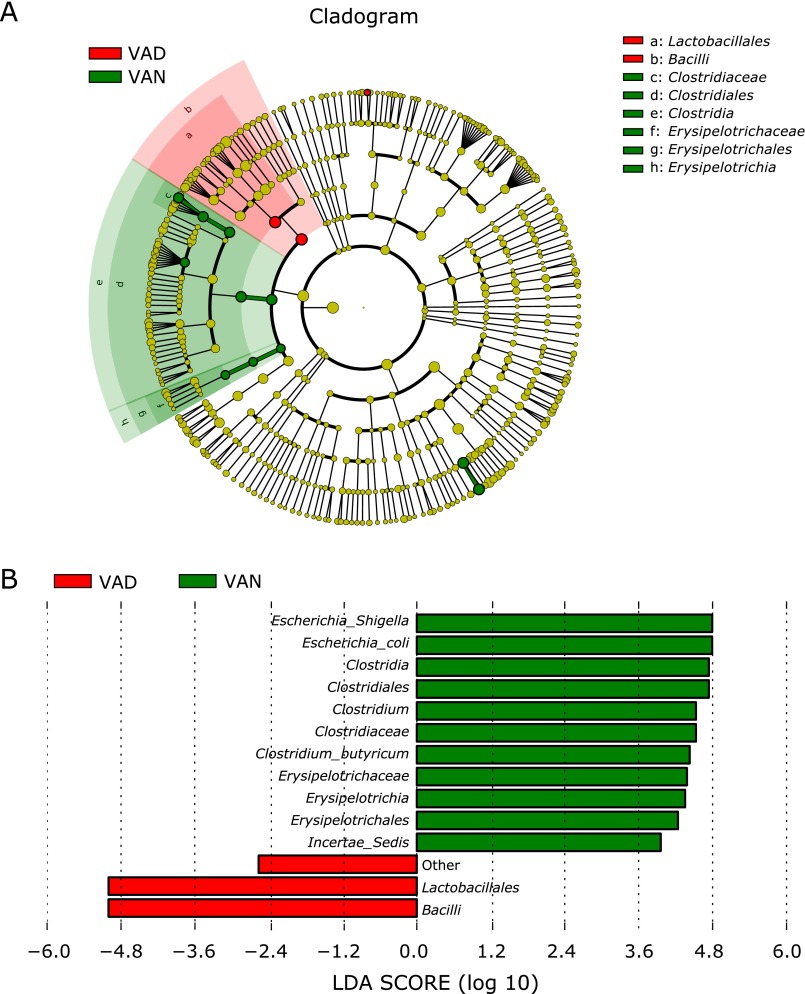
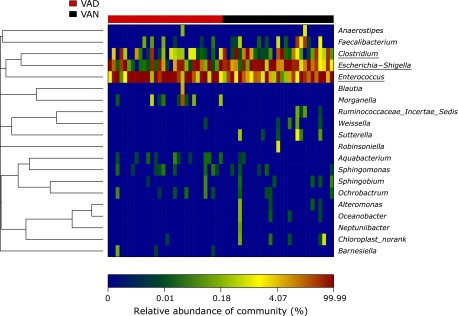
A metagenome analysis approach (LEfSe) was used to identify the key phylotypes responsible for the differences between the two VA levels (Fig. 5). Although no differences were found between the two groups at the phylum level (see Fig. 4A), significant variations were observed in the composition of the VAD and VAN samples at other bacterial classification levels. Escherichia-Shigella (main component: Escherichia coli) and Clostridia (main component: Clostridium butyricum) was significantly more abundant in the VAN samples. However, Bacilli (main component Lactobacillales), the most predominant class in the VAD group, was highly enriched compared with the VAN samples. An additional analysis found that Enterococcaceae (main component: Enterococcus) was significantly more abundant in the VAD group than the VAN group (Table 4). The heatmap at the genus level also illustrates this phenomenon (Fig. 6).
Fig. 5.
Different structures of gut microbiota in PD children with VAD or VAN levels by LEfSE analysis. (A) A cladogram of the statistical and biological differences in the gut microbiota between the VAD and VAN groups, which are shown by the color of the most abundant phylotypes (red indicating VAD, green VAN and yellow non-significant). The diameter of each circle is proportional to its abundance. (B) A histogram of the LDA scores for the most abundant phylotypes.
Table 4.
Differentially abundant features analysis of the VAD and VAN groups below the level of Lactobacillales
| Order/family/genus | VAD (n = 30) | VAN (n = 29) | p value | q value |
|---|---|---|---|---|
| Lactobacillales | 0.57 ± 0.07 | 0.36 ± 0.06 | 0.033 | 0.031 |
| Enterococcaceae | 0.44 ± 0.07 | 0.22 ± 0.05 | 0.024 | 0.096 |
| Enterococcus | 0.44 ± 0.07 | 0.22 ± 0.05 | 0.024 | 0.074 |
Fig. 6.
Heatmap analysis of the significantly different 20 genera in the gut microbiota of the VAD and VAN groups of children with PD. The heatmap analysis demonstrates the relative proportion of each genus (Y-axis clustering) in each sample (X-axis clustering). The relative abundance of each genus in each sample is depicted by color intensity at the bottom of the figure.
Consequently, Escherichia coli, Clostridium butyricum and Enterococcus were the key phylotypes, contributing to the gut microbiota differences at different nutritional VA levels.
Discussion
In a previous study, we found that fecal dysbiosis concomitant with low VA levels was commonly present in children with PD, suggesting that VA nutrition status is closely associated with fecal dysbiosis in pediatric patients.(16) To our knowledge, the current study is among the first to find significant differences in gut microbiota diversity and key phylotypes in children with PD at different VA nutritional levels. The establishment and evolution of pediatric gut microbiota is a dynamic process, which is influenced by many factors, including age,(29) gender,(8) feeding patterns,(30) nutritional status,(31) and antibiotics. The current study analyzed these factors to determine the effect of VA levels on the gut microbiota.
The diversity and balance of the gut microbiota is important for maintaining the normal biological barrier of the intestine.(32,33) PD can be aggravated by an imbalance of gut microbiota in genetically susceptible persons. VA is required for the proliferation and differentiation of epithelial tissues that maintain healthy mucosal barriers against pathogens. Adequate VA levels allow for the maintenance of the mucosal epithelial barrier and the balance of the gut microbiota.(34,35) In this study, we found a significantly lower diversity of gut microbiota in the VAD compared to the VAN group of children with PD. However, no difference was observed between the two groups with regard to the richness of gut microbiota (see ”Chao” richness estimator listed in Table 2). Therefore, it can be inferred that VA promotes the variety and balance rather than the richness of gut microbiota. Amit-Romach’s study(18) revealed that a VAD diet decreased Lactobacillus sp. but increased Escherichia coli in the gastrointestinal tract of rats; however, the diet did not affect the relative amounts of Lactobacillus and Bifidobacterium sp. in feces. The source of the samples, the health of the animals and the species studied might help to explain these apparently different results.
A crucial component of gut microbiota diversity might be the significant decrease of butyrate-producing bacteria in the gut microbiota of patients with VAD. Adequate butyrate can suppress over-growth of pathogenic bacteria and reinforce the intestinal defense barrier.(36–38) This protection against gastrointestinal diseases might be mediated by modulating transepithelial ion transport,(39) reducing oxidative damage to DNA, and apoptosis induction in DNA-damaged cells.(40,41) Butyrate is primarily supplied by butyrate-producing bacteria in vivo, specifically the Clostridium genera of Firmicutes.(42) Our sequencing analysis showed reduced contributions of Clostridium and Clostridium butyricum in the gut microbiota of patients with VAD, suggesting a decrease of butyrate-producing bacteria in PD children with low VA levels.
Another feature of the lower diversity of the gut microbiota in patients with VAD might be a significant increase in opportunistic pathogens. Enterococcus has been reported as one of the most common opportunistic pathogens, and E. faecalis is the most common species.(43) E. faecalis enhances the expression of proinflammatory chemokine genes in intestinal epithelial cells(44) and promotes colorectal inflammation in mice.(45) In addition, VA deficiency leads to destruction of the gastrointestinal mucosal barrier(18) and increases the risk of mucosal infection.(46,47) In our study, Enterococcus was highly enriched in children with PD at low VA status. Increased Enterococcus might result from the destruction of the mucosal barrier via VA deficiency.
Moreover, we found that Escherichia coli was the dominant genus of VAN, and Enterococcus was the prevailing genus of VAD. This significant segregation indicated that different conditional pathogenic bacteria are present in PD children with different levels of VA. Although fecal samples do not completely represent children’s intestinal microbiota, these results have meaningful clinical applications; different antibacterial drugs might be chosen for children with PD depending on their VA level.
We acknowledge that the present study has several limitations. One potential limitation is the effect that antibiotics might have on the gut microbiota of children with PD. Our study focused only on the duration of the use of β-lactam antibiotics and found no significant difference between VAD and VAN groups according to a PCA (Supplemental Fig. 1*) or permutational MANOVA (p = 0.714); however, antibiotic category (including cephalosporin and penicillin) was not analyzed. Second, because of the limited sample collection from patients, only fecal samples (and not intestinal tissue) were analyzed, and these samples do not completely represent the intestinal microbiota. Our next study should focus on additional functional evidence regarding the difference in butyrate production, the presence of opportunistic pathogens and the biological mechanisms through which VA nutritional levels affect bacterial diversity and gut microbiota alterations in children with PD.
In conclusion, the diversity of gut microbiota and key phylotypes differed significantly between PD children with different VA nutritional levels. MiSeq sequencing of fecal microbiota indicated that a decrease in butyrate-producing bacteria and an increase in opportunistic pathogens might have partially caused the reduced diversity in the VAD group.
Acknowledgments
This work was supported by National Nature Science Foundation of China (Grant No. 81070286, 81470799) and Science & Technology Project of Yuzhong District of Chongqing (2012). We would like to thank all the pediatric patients enrolled in this study and their guardians.
Abbreviations
- LEfSE
linear discriminant analysis effect size
- OTU
operational taxonomic unit
- PCA
principal component analysis
- PD
persistent diarrhea
- PLS-DA
partial least squares discriminant analysis
- VA
vitamin A
- VAD
vitamin A deficient
- VAN
vitamin A normal
Conflict of Interest
No potential conflicts of interest were disclosed.
Supplementary Material
References
- 1.Wardlaw T, Salama P, Brocklehurst C, Chopra M, Mason E. Diarrhoea: why children are still dying and what can be done. Lancet. 2010;375:870–872. doi: 10.1016/S0140-6736(09)61798-0. [DOI] [PubMed] [Google Scholar]
- 2.Kosek M, Bern C, Guerrant RL. The global burden of diarrhoeal disease, as estimated from studies published between 1992 and 2000. Bull World Health Organ. 2003;81:197–204. [PMC free article] [PubMed] [Google Scholar]
- 3.Lima AA, Guerrant RL. Persistent diarrhea in children: epidemiology, risk factors, pathophysiology, nutritional impact, and management. Epidemiol Rev. 1992;14:222–242. doi: 10.1093/oxfordjournals.epirev.a036088. [DOI] [PubMed] [Google Scholar]
- 4.Mathers CD, Bernard C, Iburg KM, et al. Global burden of disease in 2002: data sources, methods and results. In Global Programme on Evidence for Health Policy Discussion Paper No. 54, (revised 2004) Geneva: WHO; 2003. [Google Scholar]
- 5.Guerrant RL, Oriá RB, Moore SR, Oriá MO, Lima AA. Malnutrition as an enteric infectious disease with long-term effects on child development. Nutr Rev. 2008;66:487–505. doi: 10.1111/j.1753-4887.2008.00082.x. [DOI] [PMC free article] [PubMed] [Google Scholar]
- 6.Fagundes-Neto U. Persistent diarrhea: still a serious public health problem in developing countries. Curr Gastroenterol Rep. 2013;15:345. doi: 10.1007/s11894-013-0345-1. [DOI] [PubMed] [Google Scholar]
- 7.Sullivan PB. Studies of the small intestine in persistent diarrhea and malnutrition: the Gambian experience. J Pediatr Gastroenterol Nutr. 2002;34 Suppl 1:S11–S13. doi: 10.1097/00005176-200205001-00003. [DOI] [PubMed] [Google Scholar]
- 8.Bhutta ZA, Ghishan F, Lindley K, Memon IA, Mittal S, Rhoads JM; Commonwealth Association of Paediatric Gastroenterology and Nutrition. Persistent and chronic diarrhea and malabsorption: Working Group report of the second World Congress of Pediatric Gastroenterology, Hepatology, and Nutrition. J Pediatr Gastroenterol Nutr. 2004;39 Suppl 2:S711–S716. doi: 10.1097/00005176-200406002-00019. [DOI] [PubMed] [Google Scholar]
- 9.World Health Organization. Global Prevalence of Vitamin A Deficiency in Populations at Risk 1995–2005: WHO Global Database on Vitamin A Deficiency. Geneva: WHO; 2009. [Google Scholar]
- 10.Qiu X, Chen X, Yang S. Effect of vitamin A deficiency of children on infectious diseases. Maternal and Child Health Care of China. 2009;24:2684–2686. [Google Scholar]
- 11.Daulaire NM, Starbuck ES, Houston RM, Church MS, Stukel TA, Pandey MR. Childhood mortality after a high dose of vitamin A in a high risk population. BMJ. 1992;304:207–210. doi: 10.1136/bmj.304.6821.207. [DOI] [PMC free article] [PubMed] [Google Scholar]
- 12.Barreto ML, Santos LM, Assis AM, et al. Effect of vitamin A supplementation on diarrhoea and acute lower-respiratory-tract infections in young children in Brazil. Lancet. 1994;344:228–231. doi: 10.1016/s0140-6736(94)92998-x. [DOI] [PubMed] [Google Scholar]
- 13.Sempértegui F, Estrella B, Camaniero V, et al. The beneficial effects of weekly low-dose vitamin A supplementation on acute lower respiratory infections and diarrhea in Ecuadorian children. Pediatrics. 1999;104:e1. doi: 10.1542/peds.104.1.e1. [DOI] [PubMed] [Google Scholar]
- 14.Villamor E, Mbise R, Spiegelman D, et al. Vitamin A supplements ameliorate the adverse effect of HIV-1, malaria, and diarrheal infections on child growth. Pediatrics. 2002;109:E6. doi: 10.1542/peds.109.1.e6. [DOI] [PubMed] [Google Scholar]
- 15.Das SK, Faruque AS, Chisti MJ, Malek MA, Salam MA, Sack DA. Changing trend of persistent diarrhoea in young children over two decades: observations from a large diarrhoeal disease hospital in Bangladesh. Acta Paediatr. 2012;101:e452–e457. doi: 10.1111/j.1651-2227.2012.02761.x. [DOI] [PubMed] [Google Scholar]
- 16.Wang Y, Gao Y, Liu Q, et al. Effect of vitamin A and Zn supplementation on indices of vitamin A status, haemoglobin level and defecation of children with persistent diarrhoea. J Clin Biochem Nutr. 2016;59:58–64. doi: 10.3164/jcbn.15-68. [DOI] [PMC free article] [PubMed] [Google Scholar]
- 17.Umamaheswari B, Biswal N, Adhisivam B, Parija SC, Srinivasan S. Persistent diarrhea: risk factors and outcome. Indian J Pediatr. 2010;77:885–888. doi: 10.1007/s12098-010-0125-y. [DOI] [PubMed] [Google Scholar]
- 18.Amit-Romach E, Uni Z, Cheled S, Berkovich Z, Reifen R. Bacterial population and innate immunity-related genes in rat gastrointestinal tract are altered by vitamin A-deficient diet. J Nutr Biochem. 2009;20:70–77. doi: 10.1016/j.jnutbio.2008.01.002. [DOI] [PubMed] [Google Scholar]
- 19.Persistent diarrhoea in children in developing countries: memorandum from a WHO meeting. Bull World Health Organ. 1988;66:709–717. [PMC free article] [PubMed] [Google Scholar]
- 20.Waterlow JC. Classification and definition of protein-calorie malnutrition. BMJ. 1972;3:566–569. doi: 10.1136/bmj.3.5826.566. [DOI] [PMC free article] [PubMed] [Google Scholar]
- 21.Fiocchi A, Brozek J, Schünemann H, et al. World Allergy Organization (WAO) Diagnosis and Rationale for Action against Cow’s Milk Allergy (DRACMA) Guidelines. World Allergy Organ J. 2010;3:57–161. doi: 10.1097/WOX.0b013e3181defeb9. [DOI] [PMC free article] [PubMed] [Google Scholar]
- 22.Cuesta Sanz D, Castro Santa-Cruz M. Simultaneous measurement of retinol and alpha-tocopherol in human serum by high-performance liquid chromatography with ultraviolet detection. J Chromatogr. 1986;380:140–144. doi: 10.1016/s0378-4347(00)83634-8. [DOI] [PubMed] [Google Scholar]
- 23.Zhang X, Chen K, Chen J, Liu YX, Qu P, Li TY. Effect of marginal vitamin A deficiency during pregnancy on retinoic acid receptors and N-methyl-D-aspartate receptor expression in the offspring of rats. J Nutr Biochem. 2011;22:1112–1120. doi: 10.1016/j.jnutbio.2010.09.010. [DOI] [PubMed] [Google Scholar]
- 24.Caporaso JG, Lauber CL, Walters WA, et al. Ultra-high-throughput microbial community analysis on the Illumina HiSeq and MiSeq platforms. ISME J. 2012;6:1621–1624. doi: 10.1038/ismej.2012.8. [DOI] [PMC free article] [PubMed] [Google Scholar]
- 25.Caporaso JG, Kuczynski J, Stombaugh J, et al. QIIME allows analysis of high-throughput community sequencing data. Nat Methods. 2010;7:335–336. doi: 10.1038/nmeth.f.303. [DOI] [PMC free article] [PubMed] [Google Scholar]
- 26.Schloss PD, Westcott SL, Ryabin T, et al. Introducing mothur: open-source, platform-independent, community-supported software for describing and comparing microbial communities. Appl Environ Microbiol. 2009;75:7537–7541. doi: 10.1128/AEM.01541-09. [DOI] [PMC free article] [PubMed] [Google Scholar]
- 27.Lozupone C, Knight R. UniFrac: a new phylogenetic method for comparing microbial communities. Appl Environ Microbiol. 2005;71:8228–8235. doi: 10.1128/AEM.71.12.8228-8235.2005. [DOI] [PMC free article] [PubMed] [Google Scholar]
- 28.Wang Q, Garrity GM, Tiedje JM, Cole JR. Naive Bayesian classifier for rapid assignment of rRNA sequences into the new bacterial taxonomy. Appl Environ Microbiol. 2007;73:5261–5267. doi: 10.1128/AEM.00062-07. [DOI] [PMC free article] [PubMed] [Google Scholar]
- 29.Avershina E, Storro O, Øien T, Johnsen R, Pope P, Rudi K. Major faecal microbiota shifts in composition and diversity with age in a geographically restricted cohort of mothers and their children. FEMS Microbiol Ecol. 2014;87:280–290. doi: 10.1111/1574-6941.12223. [DOI] [PubMed] [Google Scholar]
- 30.Fan W, Huo G, Li X, et al. Diversity of the intestinal microbiota in different patterns of feeding infants by Illumina high-throughput sequencing. World J Microbiol Biotechnol. 2013;29:2365–2372. doi: 10.1007/s11274-013-1404-3. [DOI] [PubMed] [Google Scholar]
- 31.Schiller LR. Chronic diarrhea. Curr Treat Options Gastroenterol. 2005;8:259–266. doi: 10.1007/s11938-005-0018-8. [DOI] [PubMed] [Google Scholar]
- 32.Topping DL, Clifton PM. Short-chain fatty acids and human colonic function: roles of resistant starch and nonstarch polysaccharides. Physiol Rev. 2001;81:1031–1064. doi: 10.1152/physrev.2001.81.3.1031. [DOI] [PubMed] [Google Scholar]
- 33.Round JL, O'Connell RM, Mazmanian SK. Coordination of tolerogenic immune responses by the commensal microbiota. J Autoimmun. 2010;34:J220–J225. doi: 10.1016/j.jaut.2009.11.007. [DOI] [PMC free article] [PubMed] [Google Scholar]
- 34.Stephensen CB. Vitamin A, infection, and immune function. Annu Rev Nutr. 2001;21:167–192. doi: 10.1146/annurev.nutr.21.1.167. [DOI] [PubMed] [Google Scholar]
- 35.Smith JE. Preparation of vitamin A-deficient rats and mice. Methods Enzymol. 1990;190:229–236. doi: 10.1016/0076-6879(90)90027-x. [DOI] [PubMed] [Google Scholar]
- 36.Hamer HM, Jonkers D, Venema K, Vanhoutvin S, Troost FJ, Brummer RJ. Review article: the role of butyrate on colonic function. Aliment Pharmacol Ther. 2008;27:104–119. doi: 10.1111/j.1365-2036.2007.03562.x. [DOI] [PubMed] [Google Scholar]
- 37.Hooper LV, Gordon JI. Commensal host-bacterial relationships in the gut. Science. 2001;292:1115–1118. doi: 10.1126/science.1058709. [DOI] [PubMed] [Google Scholar]
- 38.Wachtershauser A, Stein J. Rationale for the luminal provision of butyrate in intestinal diseases. Eur J Nutr. 2000;39:164–171. doi: 10.1007/s003940070020. [DOI] [PubMed] [Google Scholar]
- 39.Canani RB, Terrin G, Elce A, et al. Genotype-dependency of butyrate efficacy in children with congenital chloride diarrhea. Orphanet J Rare Dis. 2013;8:194. doi: 10.1186/1750-1172-8-194. [DOI] [PMC free article] [PubMed] [Google Scholar]
- 40.Pryde SE, Duncan SH, Hold GL, Stewart CS, Flint HJ. The microbiology of butyrate formation in the human colon. FEMS Microbiol Lett. 2002;217:133–139. doi: 10.1111/j.1574-6968.2002.tb11467.x. [DOI] [PubMed] [Google Scholar]
- 41.Rose DJ, DeMeo MT, Keshavarzian A, Hamaker BR. Influence of dietary fiber on inflammatory bowel disease and colon cancer: importance of fermentation pattern. Nutr Rev. 2007;65:51–62. doi: 10.1111/j.1753-4887.2007.tb00282.x. [DOI] [PubMed] [Google Scholar]
- 42.Louis P, Flint HJ. Diversity, metabolism and microbial ecology of butyrate-producing bacteria from the human large intestine. FEMS Microbiol Lett. 2009;294:1–8. doi: 10.1111/j.1574-6968.2009.01514.x. [DOI] [PubMed] [Google Scholar]
- 43.de Fátima Silva Lopes M, Ribeiro T, Abrantes M, Figueiredo Marques JJ, Tenreiro R, Crespo MT. Antimicrobial resistance profiles of dairy and clinical isolates and type strains of enterococci. Int J Food Microbiol. 2005;103:191–198. doi: 10.1016/j.ijfoodmicro.2004.12.025. [DOI] [PubMed] [Google Scholar]
- 44.Hoffmann M, Kim SC, Sartor RB, Haller D. Enterococcus faecalis strains differentially regulate Alix/AIP1 protein expression and ERK 1/2 activation in intestinal epithelial cells in the context of chronic experimental colitis. J Proteome Res. 2009;8:1183–1192. doi: 10.1021/pr800785m. [DOI] [PubMed] [Google Scholar]
- 45.Balish E, Warner T. Enterococcus faecalis induces inflammatory bowel disease in interleukin-10 knockout mice. Am J Pathol. 2002;160:2253–2257. doi: 10.1016/S0002-9440(10)61172-8. [DOI] [PMC free article] [PubMed] [Google Scholar]
- 46.Potential interventions for the prevention of childhood pneumonia in developing countries: a meta-analysis of data from field trials to assess the impact of vitamin A supplementation on pneumonia morbidity and mortality. The Vitamin A and Pneumonia Working Group. Bull World Health Organ. 1995;73:609–619. [PMC free article] [PubMed] [Google Scholar]
- 47.Ross AC, Stephensen CB. Vitamin A and retinoids in antiviral responses. FASEB J. 1996;10:979–985. [PubMed] [Google Scholar]
Associated Data
This section collects any data citations, data availability statements, or supplementary materials included in this article.


