Abstract.
Quantifying tissue biomechanical properties can assist in detection of abnormalities and monitoring disease progression and/or response to a therapy. Optical coherence elastography (OCE) has emerged as a promising technique for noninvasively characterizing tissue biomechanical properties. Several mechanical loading techniques have been proposed to induce static or transient deformations in tissues, but each has its own areas of applications and limitations. This study demonstrates the combination of Lorentz force excitation and phase-sensitive OCE at A-lines per second to quantify the elasticity of tissue by directly imaging Lorentz force-induced elastic waves. This method of tissue excitation opens the possibility of a wide range of investigations using tissue biocurrents and conductivity for biomechanical analysis.
Keywords: optical coherence elastography, Lorentz force, biocurrent, tissue, elasticity
Quantifying tissue biomechanical properties can assist in the detection of abnormalities and monitoring progression of diseases and/or response to therapy. For example, it is well-known that malignant breast cancer is stiffer than healthy surrounding tissue.1 Elastography is a technique to map the local mechanical properties of tissues by measuring the deformation in response to external loading. Various elastography techniques have been developed and applied clinically, such as ultrasound elastography2 and magnetic resonance elastography.3 However, these techniques require relatively large displacement amplitudes to produce a detectable signal and have relatively poor spatial resolution ranging from mm to cm.
Optical coherence tomography (OCT) is a well-established noninvasive imaging technique with micrometer scale spatial resolution. As a functional extension of OCT, optical coherence elastography (OCE) shows great promise for biomechanical characterization of tissues due to its high spatial and temporal resolutions. Typically, OCT structural images have micrometer scale spatial resolution, but analyzing the phase of the complex OCT signal enables nanometer scale displacement sensitivity, which has enabled ultra-sensitive OCE techniques.4
Various excitation techniques have been proposed for OCE. For example, a surgical needle was combined with a fiber-based OCE system to detect tissue margins.5 Acoustic-radiation force loading and OCE were used to demonstrate the age-related changes in the stiffness of rabbit crystalline lens6 and cornea biomechanical change after cross linking.7 Magnetomotive OCE (MM-OCE) was used to investigate resonance frequencies of tissue by modulating magnetic nanoparticles embedded in tissue with an external magnetic field.8 Low-amplitude elastic waves have been induced by a 532-nm laser9 and a micro air-pulse10 to investigate the elasticity of the cornea under various physiological conditions. However, there is no single excitation that is suitable for all applications and the development of new stimulation techniques might extend applications of OCE.
The ability of living tissue to conduct current has aroused great interest for researchers for decades. The induction of current in tissue has been used for various treatments in clinical practice.11,12 The electrical properties of tissue such as conductivity and permittivity are associated with its physiological and pathological conditions. For example, previous studies have shown that malignant tumor tissue has significantly higher permittivity as compared to normal tissue.13 Therefore, conductivity and permittivity of tissues could be used as effective markers for tissue diagnostics.
Lorentz force is generated when electrical current flows through the sample within an external magnetic field. Since biological tissues are inherently conductive, this force can be potentially used to investigate their electric property and chemical composition. The Lorentz force has been previously utilized in biomedical imaging for magneto-acoustic tomography14 and electrical impedance tomography.15 It can mechanically oscillate the tissue, which, in turn, might induce elastic waves.16 Thus, the Lorentz force presents another method to perform dynamic elastography based on mechanical wave propagation in biological tissues, which has not yet to be combined with OCE, and could open the possibility of wide range investigations using biocurrents and conductivity of tissue for biomechanical analysis.
Conventional elastic wave imaging OCE requires synchronization between multiple M-mode acquisitions (repeated A-lines measured as a function of time at one location) and multiple excitations for each measurement, resulting in long acquisition time. Recently, we have demonstrated a noncontact phase-sensitive OCE (PhS-OCE) technique at A-lines per second that was able to accurately quantify the elasticity of agar phantoms and an in situ porcine cornea.17 Multiple B-scans were acquired over the measurement region during elastic wave propagation (B–M mode) in because of the significantly faster A-line rate. Therefore, this technique required only a single excitation, whereas previous investigations, which utilized M–B mode acquisition, needed an excitation for each OCE measurement position.
In this letter, we demonstrate a method of OCE by utilizing the Lorentz force to induce an elastic wave in tissue. The elasticity of agar phantoms of various concentrations and porcine liver tissue was quantified from the group velocity of a Lorentz force-induced elastic wave, which was imaged by a PhS-OCE system at A-lines per second.
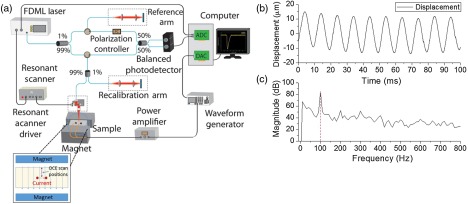
Figure 1(a) is a schematic representation of the experimental setup. The Lorentz force OCE system was composed of a home-built phase-sensitive OCT system and a magnetic field generator, which was used for the Lorentz force excitation. The OCT acquisition and Lorentz excitation were synchronized by a trigger signal generated by the computer. The OCT system was based on a 4X buffered Fourier domain mode locking (FDML) swept source laser (OptoRes GmbH) with a scan rate of , central wavelength of 1316 nm, scan range of 100 nm, and output power up to 160 mW. The axial resolution and phase stability of the system in air were and , respectively. Scanning was performed by a resonant scanner over , resulting in a frame rate of .
Fig. 1.
(a) Schematic of the experimental setup. (b) Vertical temporal displacement profile of the agar sample when excited with a sinusoidal signal. (c) Spectrum of the displacement in (b) obtained by fast Fourier transform (FFT).
The Lorentz force excitation system consisted of two NdFeB magnets, two copper wire electrodes, an arbitrary waveform generator, and a power amplifier. The two magnets were separated by a mounting base to create a sample space of . The small area of Lorentz force excitation was approximately located at the center of the sample space, which has a magnetic field strength of gauss measured by a Gaussmeter (Model GM-1-ST, Alphalab Inc.). The arbitrary waveform generator output a 1.5-ms square pulse, which was then amplified up to a voltage of 20 to 60 V, depending on the conductivity of the sample. The two electrodes were separated in a plastic bracket and connected to the sample. This ensured that the Lorentz force was parallel to the OCT scan direction. The current flowing through the sample was measured by a digital multimeter connected in the excitation circuit.
To simulate soft tissue samples of controlled stiffness, agar phantoms of three different concentrations (1%, 1.5%, and 2% w/w) were cast by mixing agar powder, 5% salt, and distilled water. A small amount of milk was added to increase scattering. Porcine liver was collected fresh from a local butcher shop and all experiments were performed within 24 h after obtaining the liver. The Lorentz force driving signal was 20 V in the phantoms and 60 V in the porcine liver.
The phase data was converted to displacement and corrected for sample surface motion. The Young’s modulus was calculated from the elastic wave group velocity by the surface wave equation for simplicity9
| (1) |
where was the measured density of the agar phantoms, was the density of the porcine liver, and was the Poisson’s ratio to account for the incompressible nature of the phantoms and liver. All the samples were tested with a uniaxial mechanical compression testing system (Model 5943, Instron Corp.) after OCE measurements.
Figure 1(b) shows the vertical temporal displacement profile from the surface of the sample when a 100-Hz sinusoidal voltage was used to power the Lorentz force driving current. As confirmed by the spectrum obtained by FFT plotted in Fig. 1(c), each cycle was 10 ms, which corresponded to the period of input signal.
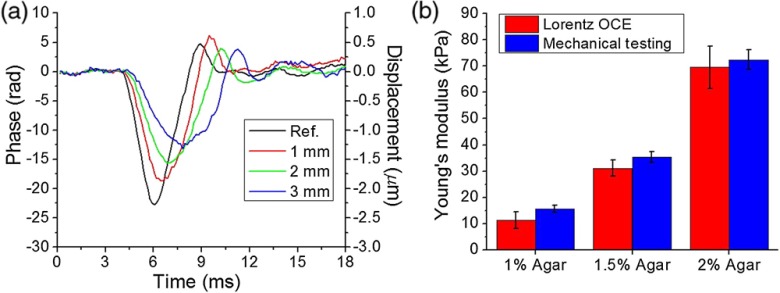
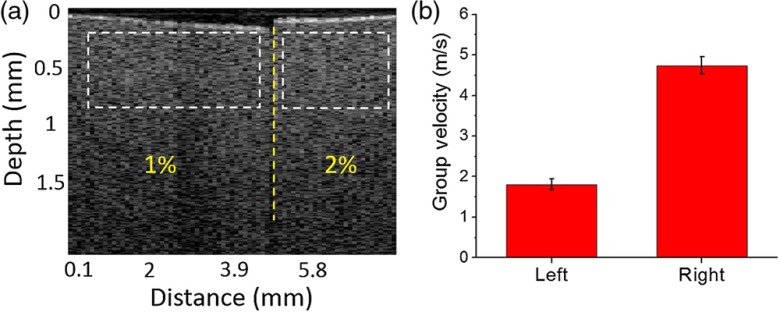
The elastic wave velocity for each sample was calculated by linearly fitting the propagation delays to the corresponding distances. The OCE measurement was taken aside of the Lorentz excitation area. Within the excitation region no time delay was observed from the OCE because the whole excitation region experienced a similar displacement. The reference position was chosen where wave propagation delays started to be observed. Displacement profiles from the surface of a 2% agar sample at 1, 2, and 3 mm away from the reference position along the wave propagation direction are presented in Fig. 2(a). The group velocities of the elastic wave in the 1%, 1.5%, and 2% phantoms were , , and , respectively. Figure 2(b) shows the comparison of Young’s moduli of the agar phantoms as assessed by Lorentz force OCE and as measured by uniaxial mechanical testing. The Young’s moduli of 1%, 1.5%, and 2% agar phantoms as estimated by Lorentz force OCE were , , and , respectively. Uniaxial mechanical testing showed that the elasticities of the 1%, 1.5%, and 2% agar phantoms were , , and , respectively. Figure 3 demonstrates the wave propagation in a spatially heterogeneous phantom made up of 1% agar on the left and 2% agar on the right (Video 1). The elastic wave velocities were calculated as and on the 1% and 2% components, respectively, showing the capability of using Lorentz force OCE to detect spatial variations in stiffness.
Fig. 2.
(a) Vertical temporal displacement profiles at the indicated distances from the reference OCE measurement position from the surface of a 2% agar sample. (b) Comparison of Young’s modulus of agar phantoms as assessed by Lorentz OCE and as measured by uniaxial mechanical testing ( samples for each concentration).
Fig. 3.
(a) The OCT structural image of the heterogeneous phantom. (b) Group velocity calculated from the selected windows (Video 1, MP4, 472 KB) [URL: http://dx.doi.org/10.1117/1.JBO.21.9.090502.1].
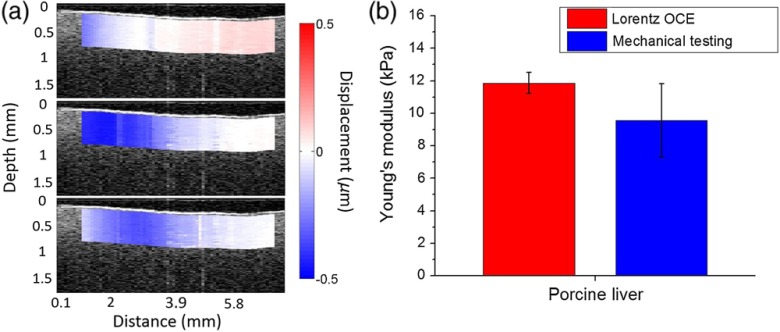
Porcine liver was utilized to test the feasibility of Lorentz force OCE to quantify the stiffness of tissue. Figure 4(a) shows the elastic wave propagation at different time points after excitation overlaid on the OCT structural image of a porcine liver sample (Video 2). The displacement is color mapped with blue as downward and red as upward displacement to better illustrate the wave propagation, and the Lorentz force excitation location lies at the left edge of the image. The elastic wave group velocity in the porcine liver was , which translated to a Young’s modulus of by Eq. (1). The stiffness of the porcine liver as measured by mechanical testing was . The OCE-measured elastic wave velocity corroborates with previous investigations.18
Fig. 4.
(a) The OCT structural image of a porcine liver sample and elastic wave propagation overlay. (b) Comparison of elasticity as assessed by Lorentz force OCE and as measured by uniaxial mechanical testing (Video 2, MP4, 693 KB) [URL: http://dx.doi.org/10.1117/1.JBO.21.9.090502.2].
The Lorentz force is a new technique for elastographic excitation. Similar to MM-OCE, Lorentz force OCE needs an external magnetic field to induce a deformation. Lorentz excitation only relies on the internal conductive properties of tissue and the bioelectric current flow, so it is possible to be utilized in air and liquid environments. One advantage of Lorentz excitation is that the excitation frequency can be customized by changing the driving signal frequency as shown in Fig. 1(b), which makes it suitable for resonant spectroscopic study. Recent advances have made it possible to deliver the Lorentz excitation remotely.19
It should be noted that the OCE results shows better correlation with mechanical compression testing for agar samples compared to the porcine liver. This is primarily due to assumptions made about the sample in Eq. (1). Since the viscosity of agar is usually very small and can be ignored, the Young’s modulus obtained in agar by OCE and mechanical compression testing have a better match while the viscosity effect can be neglected. In the liver, the viscosity may affect the wave speed for OCE measurement. For compression testing, the viscosity has almost no influence on the elasticity measurement. Therefore, OCE-measured Young modulus and compression results for biological samples typically show greater variability. The application of more robust mechanical models that can provide more accurate assessment of biomechanical properties is an avenue of our future work.20
The elastic wave time delay at different measurement locations was obtained by cross correlation of the displacement profiles between the starting reference position and other measurement positions. The strength of the Lorentz force should only influence the amplitude of the elastic wave instead of the elastic wave speed, however, low SNR will reduce the accuracy of the cross correlation results, which further affects the OCE results. There are several methods to increase the displacement amplitude and improve SNR. Since the electric field, magnetic field, and ion concentration of the tissue dictate the amplitude of generated Lorentz force, the change of any of these parameters will help improve the signal. The most obvious method would be to increase the driving signal current or excitation duration. Another approach would be to increase the magnetic field strength. Clinical MRI systems generate magnetic fields at least 10 times stronger than what was used in this study, and a stronger magnetic field would increase the displacement amplitude without increasing the risk for tissue damage from a higher driving current. Increasing the conductivity of the tissue would also increase the elastic wave amplitude and previous work has shown that a simple saline solution can accomplish this safely.21 Future work will investigate the effects of the aforementioned techniques on the elastic wave amplitude and sensitivity of the Lorentz force OCE measurements.
The induction of current in tissue has been used for various treatments in clinical practice. One important issue for Lorentz force excitation is the potential tissue damage by pulsed electrical stimulation. The electrical current during excitation in liver was estimated to be 15 mA in this work, and it was still larger than the suggested maximum in transcranial direct current stimulation—up to 2 mA.22 The excitation current needs to be reduced for in vivo use by aforementioned methods. In addition to electrical damage, resistive heating can also burn tissue. Since the pulse duration was only 1.5 ms, Joule heating should be negligible.23 However, the interaction between an electric field and tissue is a complicated process, which has been previously investigated using OCT.24,25 The electrical field change may cause various electro-kinetic responses such as electric field-induced mechanical changes, especially in vivo. Due the relatively weak and short duration of the electric field, these changes are typically confined locally to the excitation position, but this deserves further investigation.
We have demonstrated a stimulation technique utilizing the Lorentz force to induce an elastic wave in tissue, which was imaged by a PhS-OCE system at A-lines per second. The results show that Lorentz force OCE was able to accurately assess the elasticity of tissue as compared to mechanical testing.
Supplementary Material
Acknowledgments
This work was funded in part by the NIH under Grant Nos. 1R01EY022362, 2R01EY022362, 1R01HL120140, and U54HG006348 and DOD CDMRP under Grant No. PR150338.
References
- 1.Tanter M., et al. , “Quantitative assessment of breast lesion viscoelasticity: initial clinical results using supersonic shear imaging,” Ultrasound Med. Biol. 34(9), 1373–1386 (2008). 10.1016/j.ultrasmedbio.2008.02.002 [DOI] [PubMed] [Google Scholar]
- 2.Ophir J., et al. , “Elastography: a quantitative method for imaging the elasticity of biological tissues,” Ultrason. Imaging 13(2), 111–134 (1991). 10.1177/016173469101300201 [DOI] [PubMed] [Google Scholar]
- 3.Muthupillai R., et al. , “Magnetic resonance elastography by direct visualization of propagating acoustic strain waves,” Science 269(5232), 1854–1857 (1995). 10.1126/science.7569924 [DOI] [PubMed] [Google Scholar]
- 4.Wang R. K., Kirkpatrick S., Hinds M., “Phase-sensitive optical coherence elastography for mapping tissue microstrains in real time,” Appl Phys Lett 90(16), 164105 (2007). 10.1063/1.2724920 [DOI] [Google Scholar]
- 5.Kennedy K. M., et al. , “Needle optical coherence elastography for the measurement of microscale mechanical contrast deep within human breast tissues,” J. Biomed. Opt. 18(12), 121510 (2013). 10.1117/1.JBO.18.12.121510 [DOI] [PubMed] [Google Scholar]
- 6.Wu C., et al. , “Assessing age-related changes in the biomechanical properties of rabbit lens using a coaligned ultrasound and optical coherence elastography system,” Invest. Ophthalmol. Vis. Sci. 56(2), 1292–1300 (2015). 10.1167/iovs.14-15654 [DOI] [PMC free article] [PubMed] [Google Scholar]
- 7.Qu Y., et al. , “Acoustic radiation force optical coherence elastography of corneal tissue,” IEEE J. Sel. Top. Quantum Electron 22(3), 6803507 (2016). 10.1109/JSTQE.2016.2524618 [DOI] [PMC free article] [PubMed] [Google Scholar]
- 8.Oldenburg A. L., Boppart S. A., “Resonant acoustic spectroscopy of soft tissues using embedded magnetomotive nanotransducers and optical coherence tomography,” Phys. Med. Biol. 55(4), 1189–1201 (2010). 10.1088/0031-9155/55/4/019 [DOI] [PMC free article] [PubMed] [Google Scholar]
- 9.Li C., et al. , “Noncontact all-optical measurement of corneal elasticity,” Opt. Lett. 37(10), 1625–1627 (2012). 10.1364/OL.37.001625 [DOI] [PubMed] [Google Scholar]
- 10.Wang S., Larin K. V., “Shear wave imaging optical coherence tomography (SWI-OCT) for ocular tissue biomechanics,” Opt. Lett. 39(1), 41–44 (2014). 10.1364/OL.39.000041 [DOI] [PMC free article] [PubMed] [Google Scholar]
- 11.Rossi S., et al. , “Safety, ethical considerations, and application guidelines for the use of transcranial magnetic stimulation in clinical practice and research,” Clin. Neurophysiol. 120(12), 2008–2039 (2009). 10.1016/j.clinph.2009.08.016 [DOI] [PMC free article] [PubMed] [Google Scholar]
- 12.Herwig U., et al. , “Antidepressant effects of augmentative transcranial magnetic stimulation: randomised multicentre trial,” Br. J. Psychiatry 191, 441–448 (2007). 10.1192/bjp.bp.106.034371 [DOI] [PubMed] [Google Scholar]
- 13.Surowiec A. J., et al. , “Dielectric properties of breast carcinoma and the surrounding tissues,” IEEE Trans. Biomed. Eng. 35(4), 257–263 (1988). 10.1109/10.1374 [DOI] [PubMed] [Google Scholar]
- 14.Xu Y., He B., “Magnetoacoustic tomography with magnetic induction (MAT-MI),” Phys. Med. Biol. 50(21), 5175–5187 (2005). 10.1088/0031-9155/50/21/015 [DOI] [PMC free article] [PubMed] [Google Scholar]
- 15.Grasland-Mongrain P., et al. , “Lorentz force electrical impedance tomography,” IRBM 34(4), 357–360 (2013). 10.1016/j.irbm.2013.08.002 [DOI] [Google Scholar]
- 16.Grasland-Mongrain P., et al. , “Imaging of shear waves induced by lorentz force in soft tissues,” Phys. Rev. Lett. 113(3), 038101 (2014). 10.1103/PhysRevLett.113.038101 [DOI] [PubMed] [Google Scholar]
- 17.Singh M., et al. , “Phase-sensitive optical coherence elastography at 1.5 million A-Lines per second,” Opt. Lett. 40(11), 2588–2591 (2015). 10.1364/OL.40.002588 [DOI] [PMC free article] [PubMed] [Google Scholar]
- 18.Deffieux T., et al. , “Shear wave spectroscopy for in vivo quantification of human soft tissues visco-elasticity,” IEEE Trans. Med. Imaging 28(3), 313–322 (2009). 10.1109/TMI.2008.925077 [DOI] [PubMed] [Google Scholar]
- 19.Grasland-Mongrain P., et al. , “Contactless remote induction of shear waves in soft tissues using a transcranial magnetic stimulation device,” Phys. Med. Biol. 61(6), 2582–2593 (2016). 10.1088/0031-9155/61/6/2582 [DOI] [PubMed] [Google Scholar]
- 20.Han Z., et al. , “Quantitative methods for reconstructing tissue biomechanical properties in optical coherence elastography: a comparison study,” Phys. Med. Biol. 60(9), 3531–3547 (2015). 10.1088/0031-9155/60/9/3531 [DOI] [PMC free article] [PubMed] [Google Scholar]
- 21.Park J. Y., Park C. Y., Lee J. M., “Estimation of saline-mixed tissue conductivity and ablation lesion size,” Comput. Biol. Med. 43(5), 504–512 (2013). 10.1016/j.compbiomed.2013.02.012 [DOI] [PubMed] [Google Scholar]
- 22.Loo C. K., et al. , “Transcranial direct current stimulation for depression: 3-week, randomised, sham-controlled trial,” Br. J. Psychiatry 200(1), 52–59 (2012). 10.1192/bjp.bp.111.097634 [DOI] [PubMed] [Google Scholar]
- 23.Barnes F. S., Greenebaum B., Biological and Medical Aspects of Electromagnetic Fields, CRC Press, Boca Raton, Florida: (2006). [Google Scholar]
- 24.Wawrzyn K., et al. , “Imaging the electro-kinetic response of biological tissues with optical coherence tomography,” Opt. Lett. 38(14), 2572–2574 (2013). 10.1364/OL.38.002572 [DOI] [PubMed] [Google Scholar]
- 25.Pena A. F., et al. , “Imaging of the interaction of low-frequency electric fields with biological tissues by optical coherence tomography,” Opt. Lett. 38(14), 2629–2631 (2013). 10.1364/OL.38.002629 [DOI] [PubMed] [Google Scholar]
Associated Data
This section collects any data citations, data availability statements, or supplementary materials included in this article.


